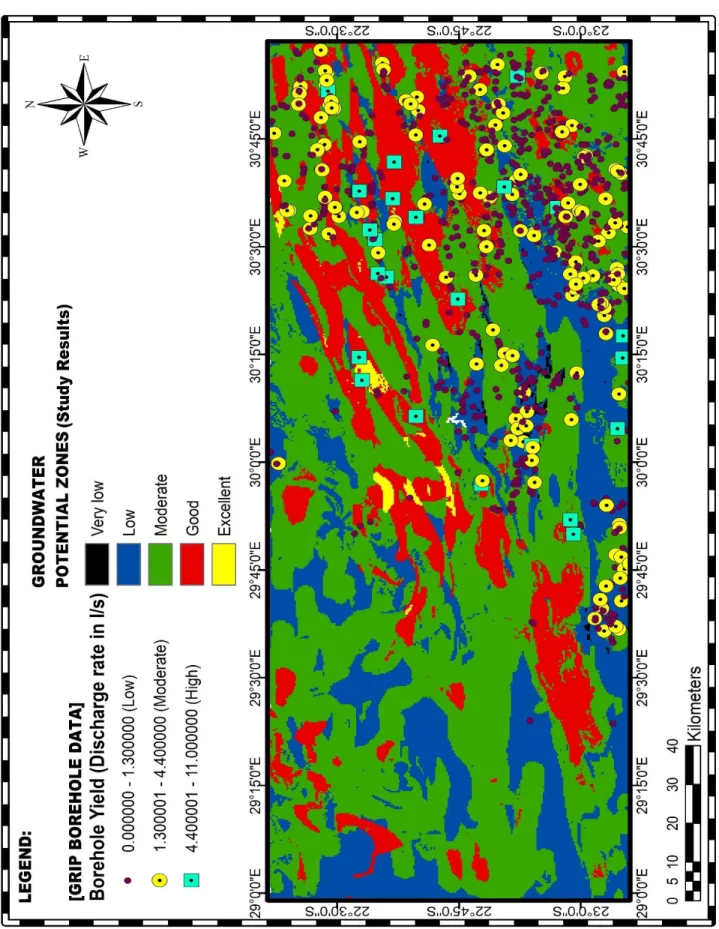
The complexity of the lithologies in the region necessitates the use of good scientific methodologies for the delineation of promising groundwater potential zones. Overlaying the borehole data set on the map showed positive correlation between borehole yield groundwater potential zones.
INTRODUCTION
- Background
- Statement of the problem
- The significance or motivation of the study
- The general and specific research objectives
- The broad objective
- The specific objectives
- The research questions
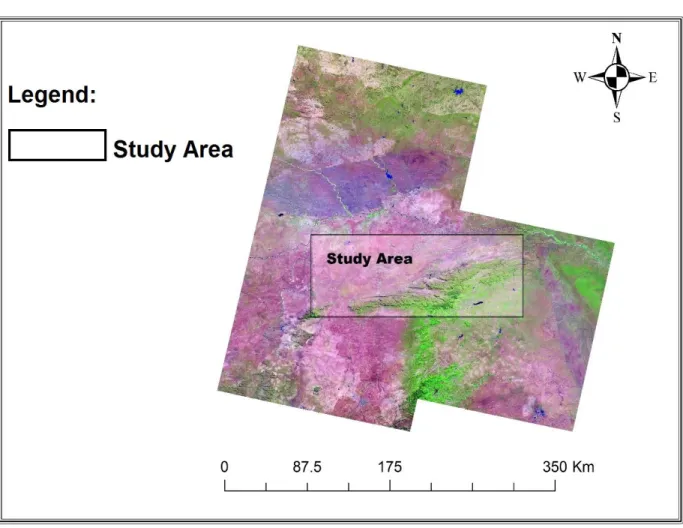
- Characteristics of the study area
- Location
- Geology
- Climate
- Vegetation
A comprehensive understanding of the underlying geology is thus necessary for a proper understanding of the groundwater in the area. This section provides a general description of the investigated area and the historical development of the groundwater in the area.
LITERATURE REVIEW
Introduction
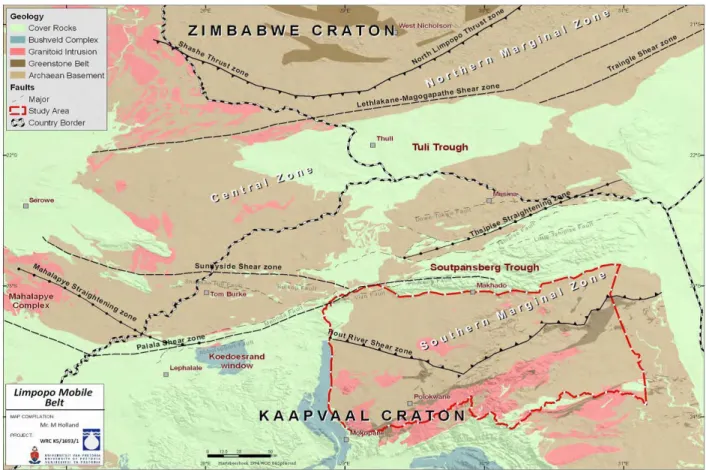
Regional Geology of the study area
The northeastern margin of the study area includes rocks of the Karoo Supergroup, especially those in subsidiary basins. Most strata range in age from Late Carboniferous to Early Jurassic (Johnson et al., 1996).
Local Geology
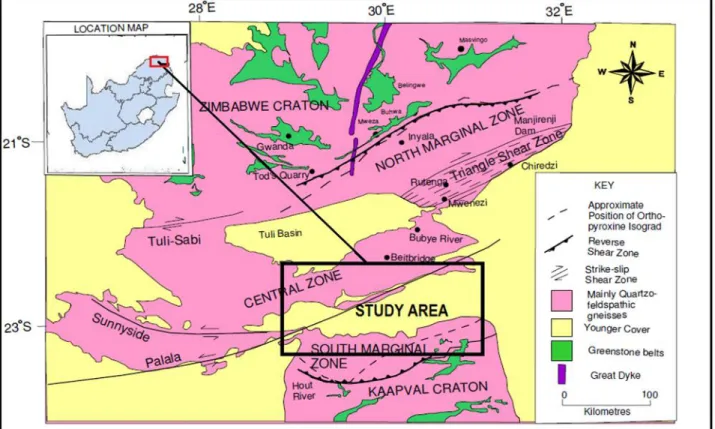
- Limpopo Mobile Belt
- Structural Geology of the Central zone
- Soutpansberg Group
- The structural Geology of the Soutpansberg Group
- The Karoo Supergroup
- Local Geological and hydrogeological settings
The southern margin of the study area consists of all lithologies of the Soutpansberg Group. On the other hand, the Jurassic period mainly consists of the Jonzini and Letaba formations (Malaza, 2013).
REMOTE SENSING
- History of remote sensing
- Principles of remote sensing
- Remote sensing imagery processing
- Pre-processing
- Image enhancement
- Image transformation
- Image classification
- Interpretation of Remote sensing images
- Hydrogeological applications of remote sensing data
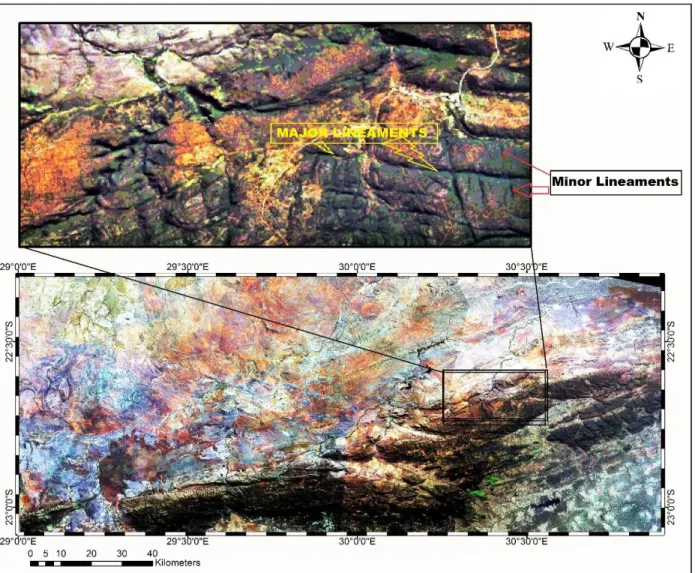
- Extraction of Lineaments from Satellite imageries
- Lineament analysis
Furthermore, non-directional filters are applied if the orientation of the features is not clearly visible (Meijerink et al., 2013). Data extraction for general and hydrogeological purposes is usually done from images recorded in the visible and near-infrared bands of the electromagnetic spectrum (Meijerink et al., 2007).
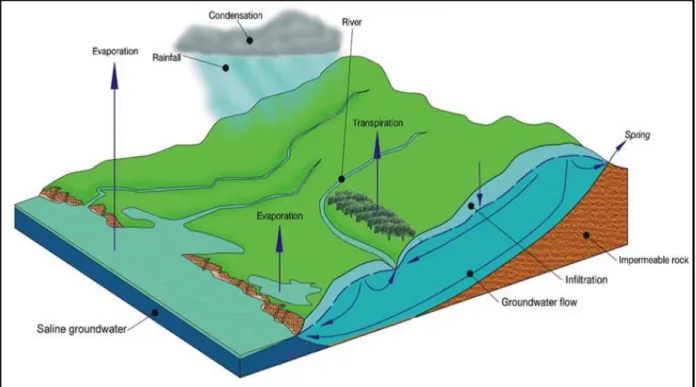
Concepts of Groundwater
- Aquifers
- Unconfined aquifer
- Confined aquifer
- Perched aquifer
Consequently, the position of the groundwater table varies depending on the rainy or dry season (Artinaid, 2013). This is similar to an unconfined aquifer, in that the water table is marked by the undulating surface of the water table.
Background of Geophysics
- The Magnetic method
- Historical Overview of the magnetic method
- Basic theory of the magnetic method
- Sources of the Earth’s magnetism
- The Magnetic properties of rocks and minerals
- Measurement procedures of the magnetic method
- Processing and Interpretation of Magnetic data
- Application of filters to enhance magnetic anomaly contrasts
- Presentation and Interpretation of Magnetic data
- Applications of the magnetic method
- Advantages and Disadvantages of the magnetic method
Interpretation of magnetic data for geological purposes requires a good understanding of the magnetic properties of rocks. In exploration, the magnetic method examines the subsurface by measuring the intensity, direction, and gradient of the Earth's magnetic field (Zohdy et al., 1990).
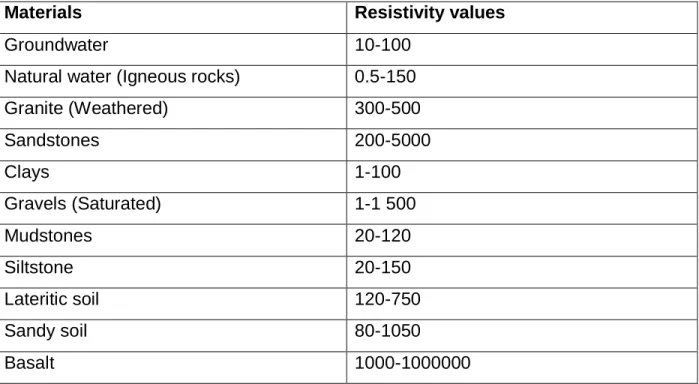
The Resistivity method: Historical overview
- Electrical resistivities of earth materials
- Basic resistivity theory
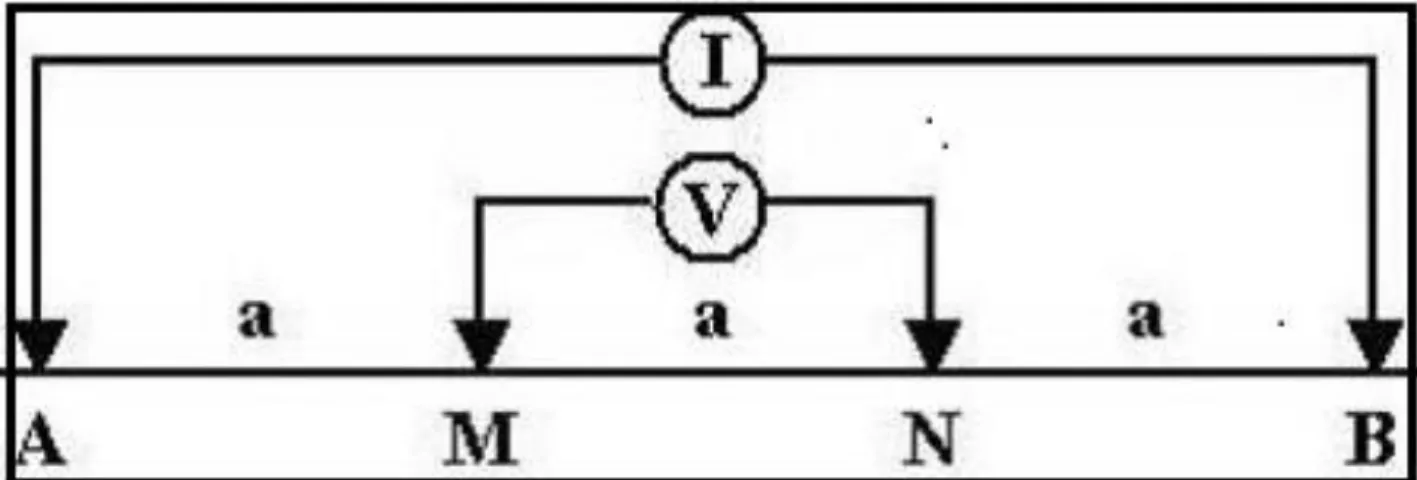
- Electrode arrays
- Measurement or field procedures in the electrical resistivity method
- Vertical electrical sounding
- Lateral Mapping or Profiling
- Presentation and interpretation of resistivity data
- Applications of the electrical resistivity methods
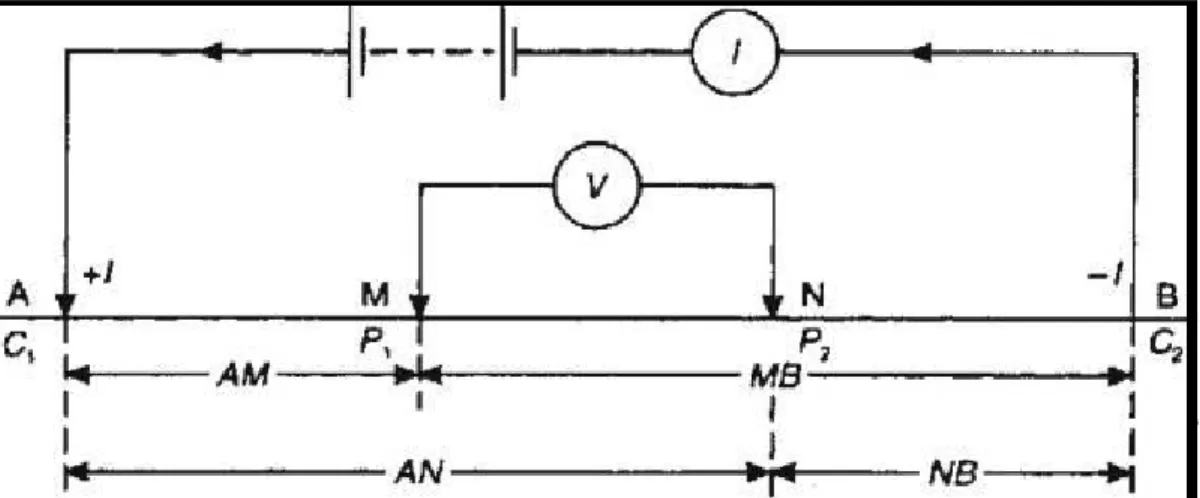
Various geophysical techniques have been developed for detecting and measuring the electrical properties of geological materials. Some of the most commonly measured electrical properties of earth materials include resistivity and conductivity. However, it has been conclusively shown that the resistance (𝑅) of a medium is controlled by parameters such as the length (𝐿), area (𝐴) and resistance (𝜌) of the material (figure 2.7).
𝐼 (2.8) Telford et al (1990) have shown that the potential at a point in the ground is equal to the sum of the potential of the two electrodes, see Figure 2.4. Furthermore, a larger distance between the potential electrodes makes the array more sensitive to telluric noise that can distort the quality of the resistance observations (Loke, 2015). A pseudosection has been shown to provide an approximate representation of the true subsurface resistivity distribution (Telford et al., 1990).
Introduction
Desktop studies
Reconnaissance survey
Groundwater Potential Mapping
- Lineament Mapping from Remotely-Sensed Imagery (Landsat 8 OLI)
- Layer stacking and Principal Component Pansharpening
- Mosaicking scenes of LANDSAT 8 OLI
- Creating a Subset image
- Image enhancement
- Extraction of Lineaments from Landsat 8 OLI Imagery
It was therefore considered necessary to resample the spatial resolution of the aforementioned bands to 15 m using the panchromatic band 8 to improve the overall spatial resolution. The pan-sharpening tool from ERDAS Imagine 2014 was used to resample the four bands to a 15m spatial resolution to improve the overall spatial resolution of the resulting composite image. The technique uses algorithms to inject the spatial detail of the panchromatic image into a multispectral image data ( Jelenek et al., 2016 ).
A query tool in ERDAS Imagine was used to define the four geographic (i.e., x, y) coordinates that make up the study area and crop the defined area out of the large mosaic-covered composite image. To meet the objectives of this study, only certain enhancement operations were applied to delineate the linear features. The lineaments were presented in a form of lineament map depicting their positions and azimuth of the geological lineaments.
AEROMAGNETIC DATA
- Reduction to the pole
- Application of filters to enhance the anomaly
- Manual digitizing of lineaments from Aeromagnetic data
Reduction to the pole uses mathematical algorithms to convert a magnetic anomaly measured at low latitudes into an anomaly that would be observed if the source were at the pole, where the slope of the Earth's magnetic field is equal is at 90°. In the present study, the reduction to the pole led to the production of maps that can be more easily related to the geology. A high-pass filter was applied to the reduced-to-pole grid data to improve the magnetic response of shallow magnetic features (i.e. less than 5 km below the Earth's surface).
A plotted profile was constructed from the table showing the anomalous distribution of the raster data. The resulting profile displayed different anomaly patterns depending on the magnetic signature of the causative bodies. These lines were digitized in Oasis Montaj software and later exported as a shapefile compatible for overlay in ArcMap.
Integration of Lineaments
Previous work has shown that magnetic lineaments often represent features such as dikes and lithological boundaries (Sakala et al., 2014).
Geological dataset
Topography
Land use and Land cover data
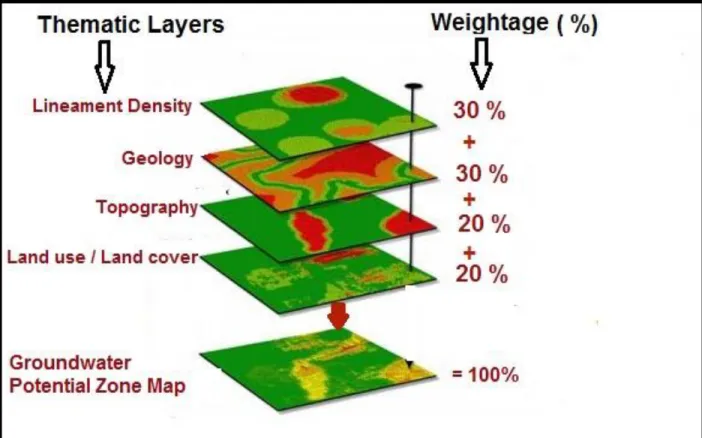
Integration of various thematic layers
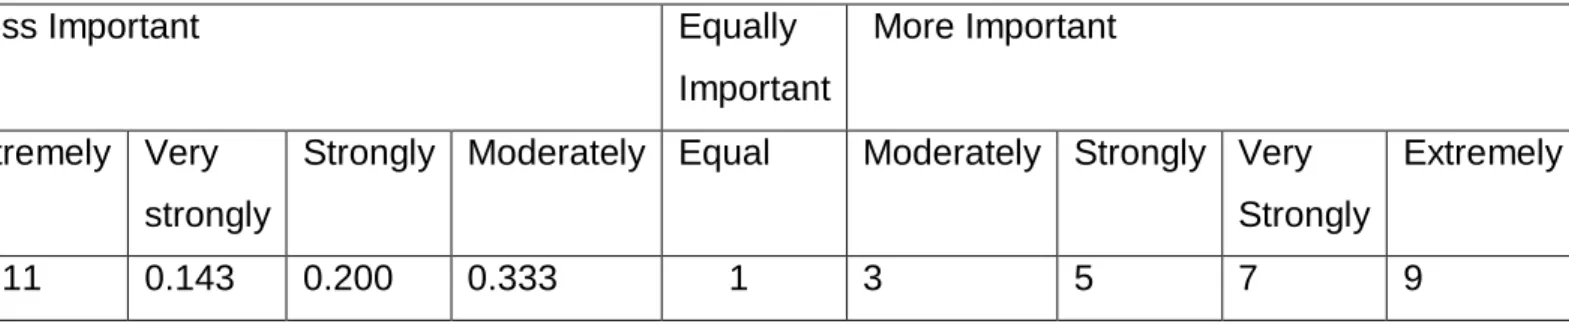
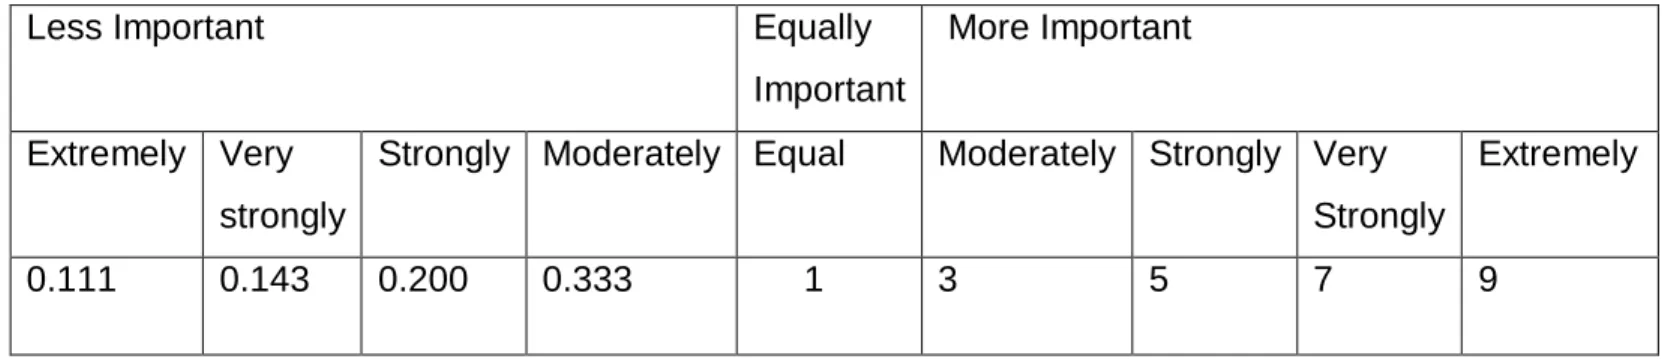
Pairwise comparisons are followed by matrix normalization, which is performed to reduce the subjectivity associated with the assigned weights of the thematic layers and their accompanying features/classes. Normalization is done by dividing each element of the matrix by the sum of its column (Shamuyarari, 2017). As a result, a sum of the rows was determined, which was further used to derive average/normalized weights (Table 4.3).
The consistency of the pairwise comparison and the normalized weights of thematic features were checked as recommended by Saaty (1980). The value of the random consistency ratio is derived from Saaty's table of random index values. The consistency ratio must be equal to 0.1 (i.e., 10%) or less for all consistent weights, otherwise the corresponding weights must be reevaluated for inconsistency (Saaty, 1980).
Groundwater potential zone map
- GRIP Borehole dataset
- Follow-up Geophysical Surveys
- Electrical Resistivity survey
- Survey Instrumentation
- VES data acquisition
- Data processing and presentation
- VES data interpretation
Validation of the groundwater potential zone map was performed by comparing the resulting map with GRIP borehole information and the results of follow-up resilience studies. Electrical resistivity survey profiles were selected based on the interpretation of the integrated line map and the groundwater potential zone map. A 12-channel GPS receiver was used to determine the location in terms of coordinates and height of the survey points.
A hammer was used to implant the electrodes into the ground, and the lateral extent of the measurement and the distance between the electrodes were determined with a measuring tape. These recorded resistivity values were used to calculate the apparent soil resistivity using the geometric factor for the Schlumberger array used in this study. The interpretation of the obtained resistivity curves was based on the assumption that the subsoil consists of horizontal layers.
Introduction
In addition, prior to the presentation of the results, a brief summary of the preparation and processing of the datasets is provided; see Chapter Three for a detailed description of data preparation techniques. Vegter (2001) described the geology of the northern part of Limpopo as highly variable and complex. The complexity of the geology can lead to the development of diverse hydrogeological regions in an area.
Archean rocks in the area include the complexly deformed metamorphic rocks of the Limpopo mobile belt, while Karoo sedimentary rocks are found in the Tshipise and Tuli sedimentary basins (Chinoda et al., 2009; Malaza, 2013). An integration of several data sets will provide a better understanding of the hydrogeological framework as well as the surface controls on the groundwater. Thematic layers were produced from these datasets for data integration in a GIS environment to produce a groundwater potential map of the study area.
PREPARATION OF THEMATIC LAYERS
- Lineament Extraction
- Lineaments from Satellite Imagery (Landsat 8 OLI)
- Aeromagnetic Data
- Lineaments from structural geological map
- Integration of Lineaments
- Lineament density and orientations
- Geological Formations
- Topography
- Land use and Land cover data
This range of values is a reflection of the average sensitivity of the various geological materials in the study area. High magnetic signatures extend in the form of elongated bodies from the northeastern edge to the central part of the studied area. An elongated ENE-WSW magnetic low can be observed in the extreme northeastern part of the studied area (Figure 4.5).
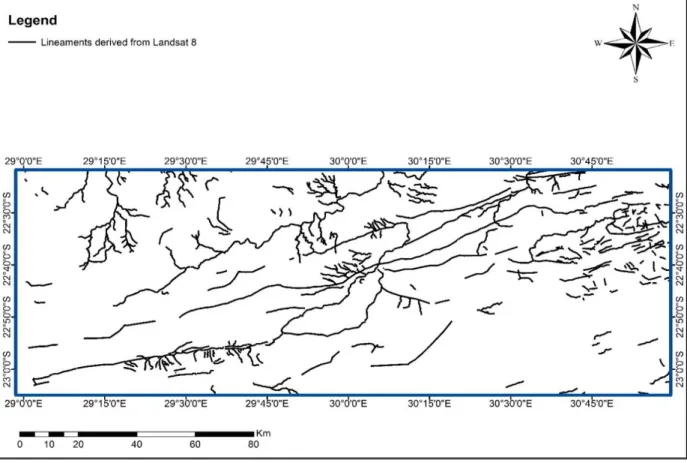
On the other hand, the fires seem to be more widespread towards the northeastern parts of the study area. The map (figure 4.12) shows a higher concentration of lineaments in the northeastern and central part of the study area. These lithologies are also responsible for the low elevations in the southeastern section of the study area.
Integration of various thematic layers for groundwater potential zones
- Deriving the weights using Analytical Hierarchy Process (AHP)
- Overlaying of thematic layers
In table 4.2, the matrix values of the elements of different weights for the four topics are presented. It should be noted that the value of the Random Index depends on the number (n) of the thematic layers being compared. The total area of the study was calculated as 16 889 square kilometers (Km2) and therefore the percentage of each potential groundwater area was calculated as a ratio to this total area (of the study area).
However, these favorable zones are more prominent in the Middle East towards the northern edge of the study area. Zones of very high or excellent groundwater potential are visible as small clusters in the upper middle portion of the map, covering an area of approximately 104.71 km2. A significant part of the study area is characterized by moderate groundwater potential, with a total area of approximately 9523 km2.
VALIDATION OF THE GROUNDWATER POTENTIAL ZONE MAP
- GRIP Borehole dataset
- VERTICAL ELECTRICAL SOUNDING SURVEYS
- VES results for station AB
- VES results for site BC
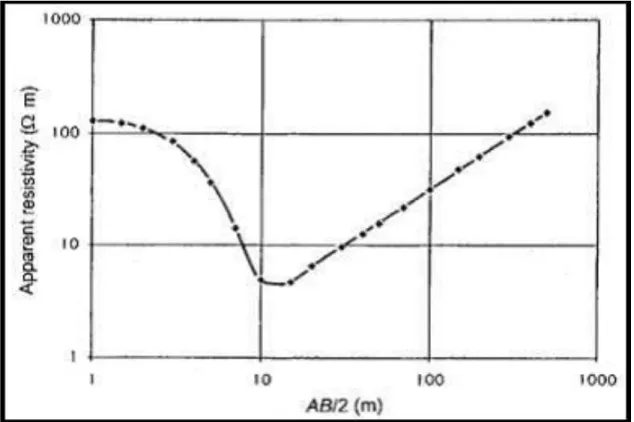
From figure 4.18 it can be observed that most of the drilled wells have a yield of less than 1.3 l/s. The positive correlation between low-yielding wells and areas of low groundwater potential is much more pronounced near the southeastern boundary of the study area. Consequently, the results obtained from the two parallel E-W profiles located 60 m apart were further used to construct a resistivity cross-section for an integrated bend analysis (figure 4.22).
The study site is characterized by steep slopes with few distinct geological structures. The variation in the thickness of the first layer from the two profiles is indicative of the variations in the top soil thickness in the steep and gently sloping areas. The apparent resistivity value and thickness of the second layer were interpreted as a weathered dry clay-rich overburden material derived from chemical cooling of the basalt (Telford et al., 1990).
Introduction
Summary of the key findings
In contrast to lithology, the influence of lineament density is much more pronounced in the western part of the study area, which consists predominantly of hard rocks such as Archean granites and gneisses. Previous work by Holland (2011) in the immediate southern part of the study area has found that boreholes drilled along and within 25 m of lineaments have higher mean transmissivities than those drilled further than 150 m from lineaments. In this study, a detailed lineament map from combined interpretation of satellite imagery, aeromagnetic data, published geological maps and borehole datasets allowed the establishment of the relationship between lineament density and groundwater availability.
The influence of topography on the occurrence of groundwater is much more pronounced at the northern and southern boundaries of the study area, both of which are characterized by flat to gentle slopes. In contrast, the highly elevated middle section of the study area is characterized by low-yielding wells, especially in areas that fall into the Soutpansberg mountain range. The effect of land cover/land use is barely visible due to the large size of the study area and the small number of wells in non-residential areas.
Conclusions
Recommendations and suggestions for future investigations
Precambrian geology of the area around the Sand River near Messina, central area, Limpopo mobile belt. Factors controlling sustainable yields in Achaean basement rock aquifers of Limpopo Province. eds.). Geological structural controls on groundwater flow and occurrence in the basement lithologies of Limpopo Province, South Africa.
Groundwater development in South Africa and an introduction to the hydrogeology of groundwater regions. The geology of the Republic of South Africa, Transkei, Bophutatswana, Venda, Ciskei and the kingdoms of Lesotho and Swaziland. Application of Surface Geophysics to Groundwater Exploration: United States Geological Survey Water Resources Survey Techniques.