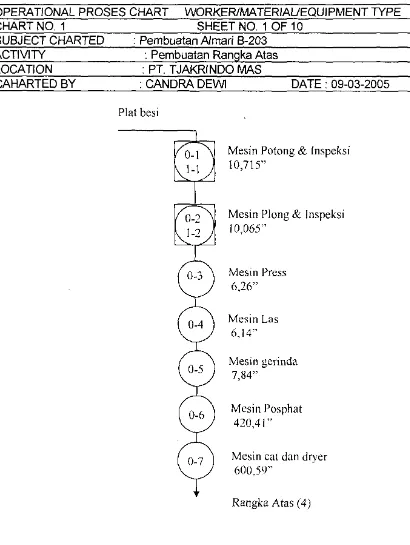
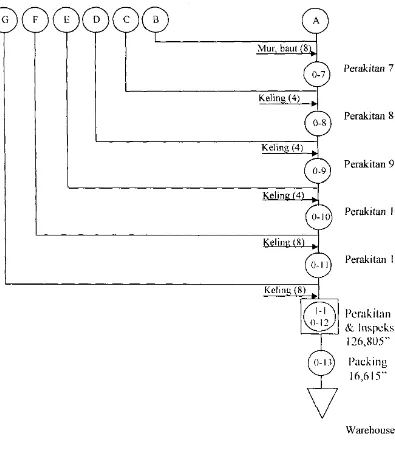
Operational Process Chart pembuatan rangka at as almari 8-203 39
Bebas
58
0
0
Teks penuh
Gambar
+6
Dokumen terkait
Descriptive statistics can give information about the minimum value, maximum value, average value and standard deviation of the values of the variable Current
Deviation Minimum Maximum Range Interquartile Range Skewness Kurtosis J2 Mean 95% Confidence Interval for Mean Lower Bound Upper Bound 5% Trimmed Mean Median Variance Std..
Based on the results study, the experimental group show the mean is 2.35, the median value is 2.00, the mode value is 2 with deviation standart of 0.487 and minimum and maximum value
