DIABETES RISK PREDICTION
This Report Presented in Partial Fulfillment of the Requirements for the Degree of Bachelor of Science in Computer Science and Engineering
Daffodil International University
Daffodil International University
DAFFODIL INTERNATION
DIABETES RISK PREDICTION
BY
Asif Ahmed Sajal
ID: 142-15-3710 AND
Irin Afroze
ID: 142-15-3746
This Report Presented in Partial Fulfillment of the Requirements for the Degree of Bachelor of Science in Computer Science and Engineering
Supervised By Nusrat Jahan
Lecturer Department of CSE
Daffodil International University Co-Supervised By
Mohshi Masnad Lecturer
Department of CSE Daffodil International University
DAFFODIL INTERNATIONAL UNIVERSITY
DHAKA, BANGLADESH MAY 2018
This Report Presented in Partial Fulfillment of the Requirements for the Degree of
Bachelor of Science in Computer Science and Engineering
APPROVAL
This Project titled “Diabetes Risk Prediction”, submitted by Asif Ahmed Sajal and Irin Afroze to the Department of Computer Science and Engineering, Daffodil International University, has been accepted as satisfactory for the partial fulfillment of the requirements for the degree of B.Sc. in Computer Science and Engineering (BSc) and approved as to its style and contents. The presentation has been held on May 2018.
BOARD OF EXAMINERS
Prof. Dr. Syed Akhter Hossain Chairman
Head of Department Department of CSE
Faculty of Science & Information Technology Daffodil International University
Dr. Sheak Rashed Haider Noori Internal Examiner
Associate Professor Department of CSE
Faculty of Science & Information Technology Daffodil International University
Md. Zahid Hasan Internal Examiner
Associate Professor Department of CSE
Faculty of Science & Information Technology Daffodil International University
Dr. Mohammad Shorif Uddin External Examiner
Professor and Chairman Department of CSE Jahangirnagar University
DECLARATION
We hereby declare that, this project has been done by us under the supervision of Nusrat Jahan, Lecturer, Department of CSE Daffodil International University. We also declare that neither this project nor any part of this project has been submitted elsewhere for award of any degree or diploma.
Supervised by:
Nusrat Jahan Lecturer
Department of CSE
Daffodil International University Co-Supervised by:
Mohshi Masnad Lecturer
Department of CSE
Daffodil International University
Submitted by:
Asif Ahmed Sajal ID: 142-15-3710 Department of CSE
Daffodil International University
Irin Afroze ID: 142-15-3746 Department of CSE
Daffodil International University
ACKNOWLEDGEMENT
First we express our heartiest thanks and gratefulness to almighty God for His divine blessing makes us possible to complete the final year project successfully.
We really grateful and wish our profound our indebtedness to Nusrat Jahan, Lecturer, Department of CSE Daffodil International University, Dhaka. Deep Knowledge and keen interest of our supervisor in the field of “Android Applications” to carry out this project. Her endless patience, scholarly guidance, continual encouragement, constant and energetic supervision, constructive criticism, valuable advice, reading many inferior draft and correcting them at all stage have made it possible to complete this project.
We would like to express our heartiest gratitude to Dr. Syed Akhter Hossain, Professor and Head, Department of CSE, for his kind help to finish our project and also to other faculty member and the staff of CSE department of Daffodil International University.
We would like to thank our entire course mate in Daffodil International University, who took part in this discuss while completing the course work.
Finally, we must acknowledge with due respect the constant support and patients of our parents.
Abstract
Diabetes is a disease, when our blood glucose or blood sugar levels are cross a limit. Glucose comes from different foods what we actually eat every day. Glucose is the main source of energy for our body cells. But having much glucose in our blood can create serious difficulties. High level of glucose can create high risk of heart disease and stroke, kidney disease, vision problems, and nerve problems with diabetes. Diabetes is a disease that also can damage eyes, kidneys, nerves and also can create heart trouble, stroke etc. In pregnancy period women can get gestational diabetes. In this paper our goal is to identify whether a person will be risk in diabetic, medium risk and low risk with diabetic. Here we worked with type-2 diabetes.
We identified this result based on nine attributes after that classified the dataset by using weka 3.8.0 for machine learning tool and set threshold value to train our machine to find out the diabetes risk in 3 levels- low, medium, and high. Finally, we proposed an Android application to predict the diabetes risk level easily to make people aware about diabetes.
TABLE OF CONTENTS
CONTENTS PAGE NO
Acknowledgements iii
Abstract iv
List of Tables vii
List of Figures viii
CHAPTER
Chapter 1: Introduction 1-3
1.1 Introduction 1
1.2 Purpose 2
1.3 Project Scope 3
Chapter 2: Background 4-6
2.1 Introduction 4
2.2 Related Work 4
Chapter 3: Requirement Specification 7-10
3.1 Project Perspective 7
3.2 Project Functions 7
3.3 User Classes and Characteristics 8
3.4 Machine Learning Algorithms 8
3.5 Operating Environment 9
3.6 Design and Implementation Constraints 9
3.7 Project Schedule 10
Chapter 4: System Design Specification 11-16
4.1
Introduction 11
4.2 General System Requirements 11
4.3 Use Case Model 11
4.4 Use Case Description 12
4.5 Data Attribute 15
4.6 Flowchart 15
4.7 Data Flow Diagrams 16
Chapter 5: Implementation Requirements 17-22
5.1 Algorithms 17
5.2 Confusion Matrix 20
5.3 Sensitivity 20
5.4 Specificity 21
5.5 Accuracy 22
Chapter 6: System Implementation 23-26
Chapter 7 : Conclusion And Future Scope 27
7.1 Conclusion 27
7.2 Future Scope 27
APPENDIX 28-31
REFERENCES 32-33
LIST OF TABLES
TABLES PAGE NO
Table 3.2.1: Diabetes Risk Prediction services 7
Table 4.4.1: Use case description of Register 13
Table 4.4.2: Use case description of Manage User 13
Table 4.4.3: Use case description of Draw Chart 14
Table 4.4.4: Use case description of User Activity 14
Table 4.5.1: Considered attributes 15
Table 5.1: Risk score considered for each attributes 18
Table 5.2: Machine Learning Accuracy for classification algorithms 20
LIST OF FIGURES
FIGURES PAGE NO
Figure 3.4.1: Supervised Learning 8
Figure 3.4.2: Unsupervised Learning 9
Figure 3.7.1: Project schedule Gantt chart 10
Figure 4.3.1: Use Case Model for Diabetes Risk Prediction 12
Figure 4.6.1: Flowchart of Diabetes Risk Prediction 16
Figure 4.7.1: Data Flow Diagram 16
Figure 6.1: First interface of Diabetes Risk Prediction 23 Figure 6.2: Sample question of Diabetes Risk Prediction 24 Figure 6.3: Sample question of Diabetes Risk Prediction 25 Figure 6.4: Prediction result of Diabetes Risk Prediction 26
CHAPTER 1 Introduction
1.1 Introduction
Diabetes is the disease which causes is increasing level of body glucose. Now-a-days it is very common disease in our country. Hormone insulin is involved with this disease. There are many symptoms of diabetes. Increasing level of thirst, hunger, frequently urination are the main symptoms of the diabetes.
There are two principle forms of diabetes:
Type 1 Diabetes: Type 1 Diabetes is also named insulin-dependent Diabetes. Children and teenager is the victim of these types of Diabetes.
Type 2 Diabetes: Type 2 Diabetes is named non-insulin dependent Diabetes. This form of Diabetes is very common. Worldwide people are familiar this form of Diabetes. Adults are the main victim of this form of Diabetes.
Diabetes in pregnancy is named Gestational Diabetes. In the time of pregnancy some women contain this Diabetes. But it is temporary Diabetes. Only that time period of pregnancy they carry this.
In Diabetes someone can contain visual disability. Visual disability during diabetes is known as Diabetic retinopathy. This Diabetic retinopathy cans loss of the vision.
Kidney Failure is the most common things during diabetes. But it depends on the duration of the diabetes.
During diabetes another common form is Heart disease. There are 42% people are carry the heart disease during the diabetes.
Foot disease also occurs in diabetes. The patient of diabetes is obtained many rules and regulation. The cost of diabetes treatment is very high.
1.2 Purpose
Knowledge discovery for predictive purposes is done through data mining, which is an analysis technique that helps in proposing inferences. The overall goal of the data mining technique is to extract the useful information from the large data set and to transform it into an understandable format so that it can be used for the future use.
Blood glucose levels that deviate from the normal range can lead to serious short-term and long- term complications. Today people are busy with their life, they have not many time to monitor their health regularly but the patients with diabetes increases day
by day in remarkable levels. The disease has been named the fifth deadliest disease in the United States with no imminent cure in sight. With the rise of information technology and its continued advent into the medical and healthcare sector, the cases of diabetes as well as their symptoms are well documented. This unexpected rises we can minimize if you take proper care about our health regularly. This process will be easy if people receive a smart way in their surrounded. The research hopes to propose a quicker and more efficient technique of diagnosing the disease, leading to timely treatment of the patients. For this reason all over the world researchers worked with smart diagnosis system.
Diabetes can be controlled by using different measures like insulin and diet. For this it should be identified as early as possible and subsequently provide appropriate treatment. Most of the classifying, identifying and diagnosing treatments are based on chemical and physical tests.
Based on the inference obtained from these results, a particular disease can be predicted.
Prediction may have errors. This is due to different uncertainty of various parameters used for testing. Such uncertainties make the predictions wrong and prevent the chances of curing the disease. The computing facility has been progressed with great advancements. These advancements provided by information technology, helps to classify the data, predict the
outcomes and diagnosis of many diseases more accurately. The main advantage of information technology is that a huge data storage of past patient’s records are maintained and monitored by hospitals continuously for various references. These medical data helps the doctors to examine different patterns in the data set. The patterns found in data sets may be used for classification, prediction and diagnosis of the diseases [4].
1.3 Project Scope
In Bangladesh, people are not conscious about their health. There are 7.1 million case of Diabetes in Bangladesh. The increasing level of Diabetes is up bound. People do not know about diabetes properly, they only afraid of this disease. So, if any mobile application can predict Diabetes level, it will be very effective for people who are in risk of Diabetes. And we select android mobile application because android mobile is available in everywhere.
CHAPTER 2 Background
2.1 Introduction
In this section we are going to discussed some related work that was motivated us to work with diabetes risk prediction. We noted some other work where machine learning approaches applied to predict the diabetes risk level or using different machine learning approach for classifying diabetes dataset by using machine learning tools.
2.2 Related Work
WHO projects that diabetes will be the seventh leading cause of death in 2030 [5].Adults with diabetes has a two- to three-fold increased risk of heart attacks and strokes [6]. Md. Aminul Islam and Nusrat Jahan worked with prima Indian dataset for predicting diabetes risk level. They discussed different machine learning algorithms to classify the dataset and compared those outcomes. Their observation was to predict diabetes in early stage plays an important role for a patient’s appropriate treatment strategy [7]. Mukeshkumari, Dr. Rajan Vohra, and Anshul Arora worked with Diabetes mellitus which is a chronic disease and a major public health challenge worldwide. In this paper Bayesian Network classifier was proposed to predict the persons whether diabetic or not. The dataset used is collected from a hospital, which collects the information of persons with and without diabetes [8]. Women tend to be hardest hit by diabetes with 9.6 million women having diabetes. This represents 8.8% of the adult population of women 18 years of age and older in 2003 and a two fold increase from 1995 (4.7%).By 2050, the projected number of all persons with diabetes will have increased from 17 million to 29 million [9]. VeenaVijayan V. and Aswathy Ravi kumar used Pima Indian Diabetic Set from University of California, Irvine (UCI) Repository of Machine Learning databases for prediction and diagnosis of diabetes. The main data mining algorithms they discussed in this paper are EM algorithm, KNN algorithm, K-means algorithm, amalgam KNN algorithm and ANFIS algorithm [10].
Vinaytosh Mishra, Dr. Cherian Samuel, and Prof. S.K.Sharma they used logistic regression classification techniques to predict the disease in early stages [11]. MerajNabi, Abdul Wahid, and Pradeep Kumar also worked with Pima Indian Diabetes data from UCI Repository.
In this paper they explored evolutionary performance of Naive Bayes, Logistic Regression and Decision tree, Random forest using Pima Indian Diabetes data [12]. AiswaryaIyer, S. Jeyalatha and RonakSumbalydiagnosed the disease by analyzing the patterns found in thePima Indians Diabetes data through Decision Tree and Naive Bayes algorithms [13].
Instance based knowledge (IBK) approach uses the instances themselves to present what is it learned, rather than inferring a rule set or decision tree and storing it instead. Once a set of training instances has been memorized, on encountering a new instance the memory is searched for the training instance [14].
Multilayer Perceptron (MLP) is an algorithm that worked based on neural networks.
Here, the input data is transformed with non-linearity, or activation functions to output one or more linearly separable classes. These intermediate layers are alluded to as hidden layers. A single hidden layer is sufficient to turn an MLP into a universal approximator. However, as it is learned from more hidden layers to making the MLP more adaptive for the dataset [15].
Decision trees are those types of trees algorithms which groups attributes by sorting them based on their values. Decision tree is used mainly for classification purpose in machine learning. Each tree consists of nodes and branches. Each node represents attributes in a group that is to be classified and each branch represents a value that the node can take. Finally, we find the result from leaves node [16].
For analyzing and classification of the dataset, we applied the machine learning algorithms in three categories: Lazy, Function, and Trees to classify our dataset based on factor scoring of nine attributes which is presented in Table 2 and 3. Multilayer-perceptron (MLP) network is the most widely used neural network classifier. J48 algorithm is an implementation of the Decision tree learning algorithm and IBK is one of the classifier. We found that IBK approach generated better result in our dataset.
In this paper we collected data from our country, and our proposed model is worked better for our country. Here we analyzed the data to predict the diabetes in early stage. Machine learning techniques increase medical diagnosis accuracy and reduce medical cost [17]. In this paper we used machine learning techniques to find out our outcomes and we set threshold to measure the diabetes risk level. This paper highlights the effectiveness to predict the diabetes in early stage that is more advantageous to reduce the long term complications.
CHAPTER 3 Requirement Specification
This section contains different perspective of project with its available functions, user classes and characteristics, operating environment, assumption and dependencies, design and implementation constraints. Here we also include our project schedule.
3.1 Project Perspective
This project is a visualization tool for different types of datasets with complete charts drawing comparison solution. It will provide the practical requirements to test all kind of datasets in physical environment. And it will be great way to analyze and compare custom datasets and their performance and differentiation on android based platform.
3.2 Project Functions
The Diabetes Risk Prediction project is an android based data visualization tool for all types of datasets, which aims to be simple to implement and compare any data, massively scalable and feature rich. Diabetes Risk Prediction provides services to its user by storing their data in a fixed database and helping them to visualize the data comparisons.
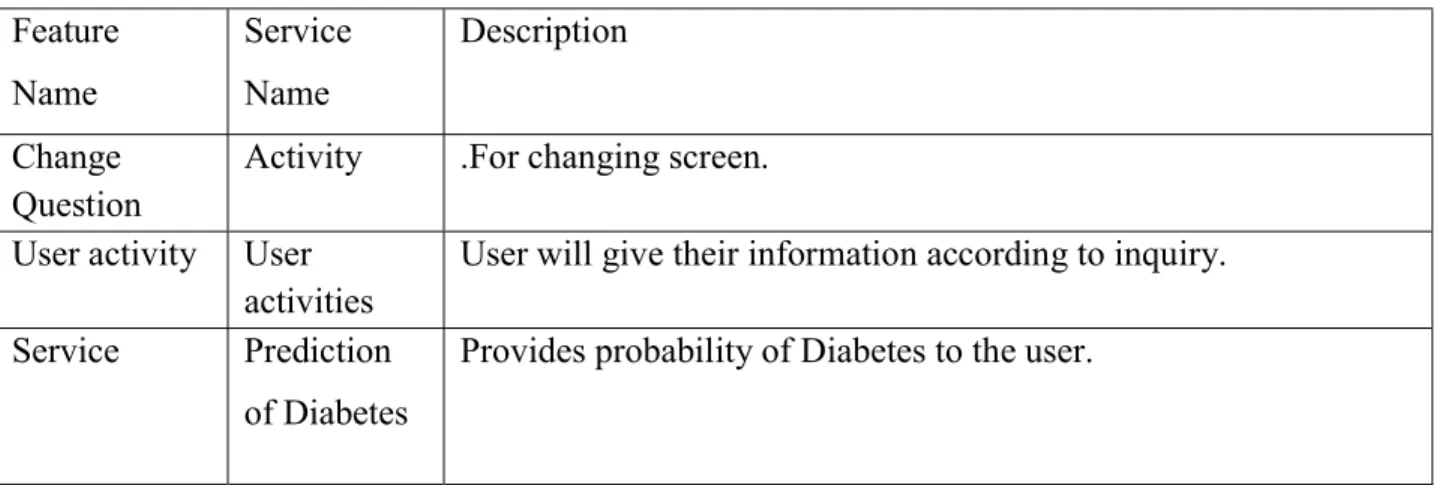
The following table describes the Diabetes Risk Prediction services that I have configured to make up the Diabetes Risk Prediction architecture in my project:
Table 3.2.1: Diabetes Risk Prediction services Feature
Name
Service Name
Description
Change Question
Activity .For changing screen.
User activity User activities
User will give their information according to inquiry.
Service Prediction of Diabetes
Provides probability of Diabetes to the user.
Upload Data User will upload their information.
Major feature of that implemented systems are given below:
1) It has an extremely flexible configuration 2) It is easy to customize
3) It is easy to integrate with other data sets.
3.3 User Classes and Characteristics
The user classes will be user and admin. A user can input new data sets and get result and a message. All this will need login of the user.
3.5 Operating Environment
Requirements for Diabetes Risk Prediction
Software: Software required for ‘Diabetes Risk Prediction’ to make working of product is
Operating System: Android.
Development platform: Android Studio
Hardware: For ‘Diabetes Risk Prediction’ hardware requirements are follows:
RAM: 1GB or above.
HD: 1GB or above.
.
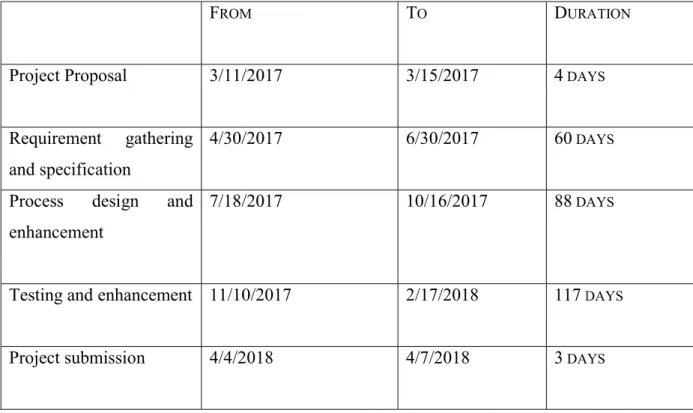
3.7 Project Schedule
Figure 3.7.1:
FROM
Project Proposal 3/11/2017
Requirement gathering and specification
4/30/2017
Process design and enhancement
7/18/2017
Testing and enhancement 11/10
Project submission 4/4/2018
Figure 3.7.1: Project schedule Gantt chart.
ROM TO DURATION
3/11/2017 3/15/2017 4 DAYS
4/30/2017 6/30/2017 60 DAYS
/2017 10/16/2017 88 DAYS
11/10/2017 2/17/2018 117 DAYS
/2018 4/7/2018 3 DAYS
URATION
DAYS
DAYS
DAYS
DAYS
DAYS
CHAPTER 4
System Design Specification
4.1 Introduction
Every application needs some Hardware components and certain Software resources to be present on the system to run efficiently. These prerequisites are known as Requirement Specification and are often used as a guideline as opposed to an absolute rule.
4.2 General System Requirements
General system requirement deals with both minimum amounts of software and hardware that is needed to run the optimal functioning of an application. To run “Diabetes Risk Prediction”
application on an android one should need the following:
1. Android kitkat or higher
2. JAVA
3. 512MB RAM
4. 50MB ROM
5. Color Monitor
With above software and hardware one should be able to work with “Diabetes Risk Prediction”.
4.3 Use Case Model
The following figure shows the use case model for the project. Here two kinds of user are available. An admin user can perform all the processes and when the apps will update, the user will get a notification for update. On the other hand a normal user can see the chart .He also needs to be installing in the system for services that I am providing.
Figure 4.3.1:
4.4 Use Case Description
It contains information about all the use case of the Use case Model shown in the above picture.
We have described every use case through a
kinds of detail information about a use case. They are Use case name, Actor, Pre
Primary Path and Exceptional Path. Use case name means the name of the process. Actor defines who will be the user. Pre-condition tells whether or not another process is needed to enter or use this process. Primary Path defines how the process works step by step. And last but not the least Exceptional Path shows us what will the process do if any exception occurs in
Use Case Model for Diabetes Risk Prediction
It contains information about all the use case of the Use case Model shown in the above picture.
We have described every use case through a table in the below section. Each table shows five kinds of detail information about a use case. They are Use case name, Actor, Pre
Primary Path and Exceptional Path. Use case name means the name of the process. Actor defines condition tells whether or not another process is needed to enter or use this process. Primary Path defines how the process works step by step. And last but not the least Exceptional Path shows us what will the process do if any exception occurs in a primary path.
It contains information about all the use case of the Use case Model shown in the above picture.
table in the below section. Each table shows five kinds of detail information about a use case. They are Use case name, Actor, Pre-condition, Primary Path and Exceptional Path. Use case name means the name of the process. Actor defines condition tells whether or not another process is needed to enter or use this process. Primary Path defines how the process works step by step. And last but not the least
a primary path.
We have some tables which are given below for the better understanding of processes of our project.
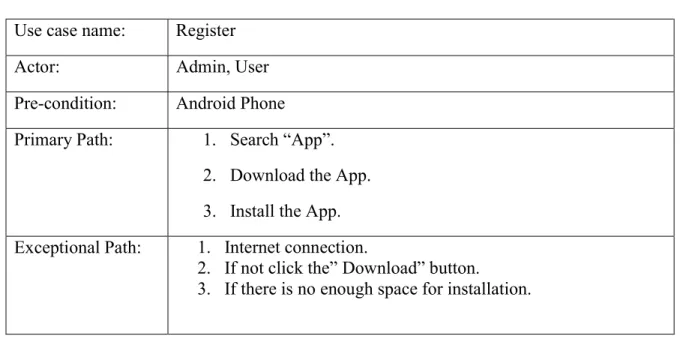
Table 4.4.1 describes about “Register” process of our project and it gives us an understanding how the process works in project. Register process has primary paths.
Table 4.4.1: Use case description of Register Use case name: Register
Actor: Admin, User
Pre-condition: Android Phone Primary Path: 1. Search “App”.
2. Download the App.
3. Install the App.
Exceptional Path: 1. Internet connection.
2. If not click the” Download” button.
3. If there is no enough space for installation.
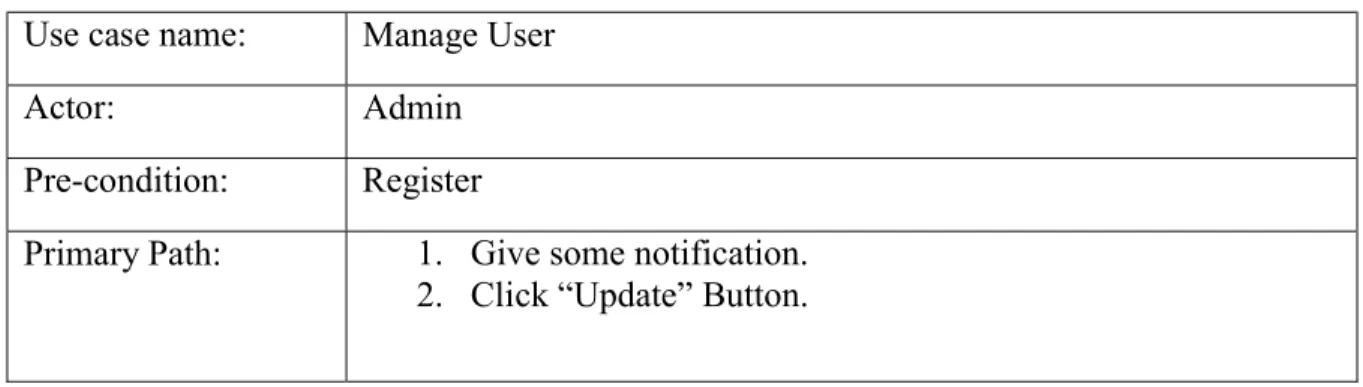
Table 4.4.2 describes about “Manage User” process of our project and it gives us an understanding how the process works in project. Manage User process has two primary paths they are give notification and click update button. In this two primary path have no exceptional paths.
Table 4.4.2: Use case description of Manage User Use case name: Manage User
Actor: Admin
Pre-condition: Register
Primary Path: 1. Give some notification.
2. Click “Update” Button.
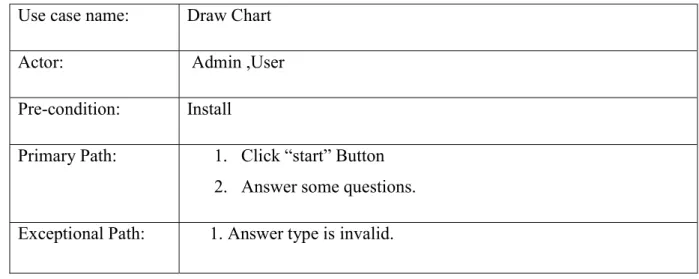
Table 4.4.3 describes about “Draw Chart” process of our project and it gives us an understanding how the process works in project. Draw Chart process has two primary paths they are click start button, select answer some questions. In this two primary paths have one exceptional path.
Table 4.4.3: Use case description of Draw Chart Use case name: Draw Chart
Actor: Admin ,User
Pre-condition: Install
Primary Path: 1. Click “start” Button 2. Answer some questions.
Exceptional Path: 1. Answer type is invalid.
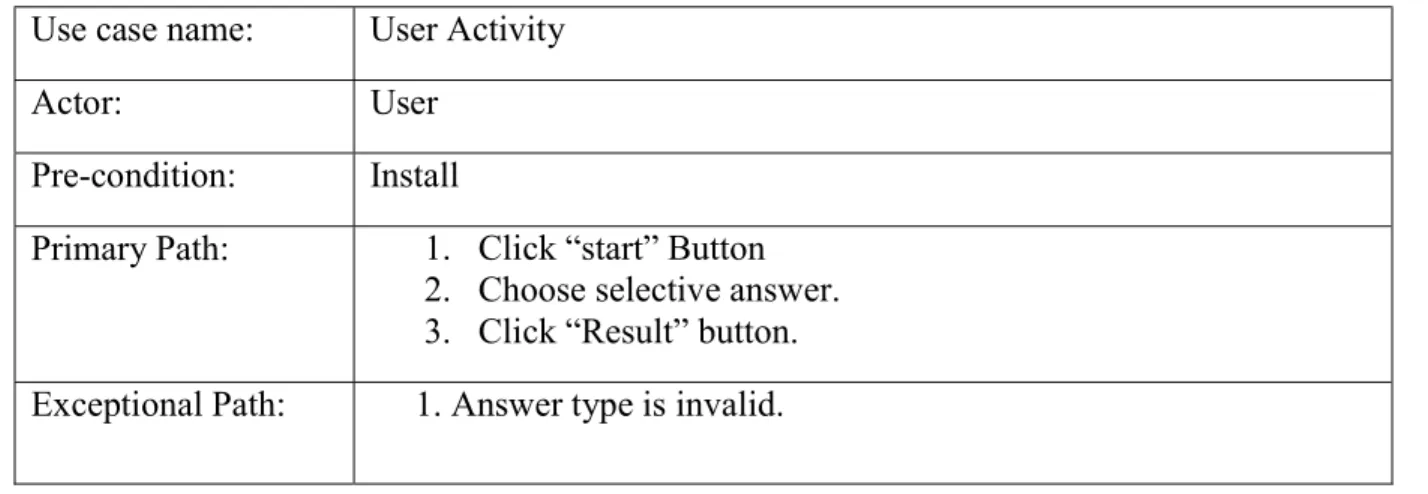
Table 4.4.4 describes about “User Activity” process of our project and it gives us an understanding how the process works in project. User Activity process has three primary paths they are click start button, select answer and click Result button. In this three primary paths have one exceptional path.
Table 4.4.4: Use case description of User Activity Use case name: User Activity
Actor: User
Pre-condition: Install
Primary Path: 1. Click “start” Button 2. Choose selective answer.
3. Click “Result” button.
Exceptional Path: 1. Answer type is invalid.
Now, in this section we are going to discuss about our proposed method for predicting diabetes risk levels. Here we explored the data collection way, data processing, worked flow procedure, factor scoring procedure and accuracy comparison of different algorithms.
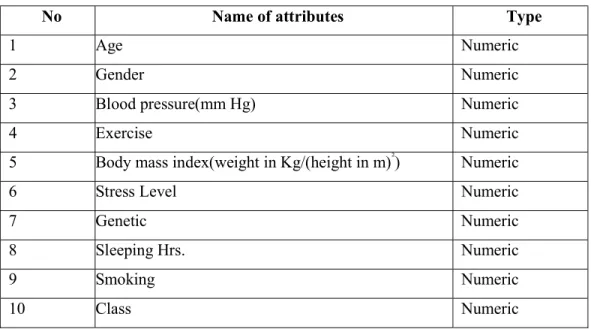
4.5 Data Attribute
For this project we collected data from different people by providing a survey form, Table 4.5.1 represents the attributes which was we considered for diabetes prediction process and in our survey form.
Table 4.5.1: Considered attributes
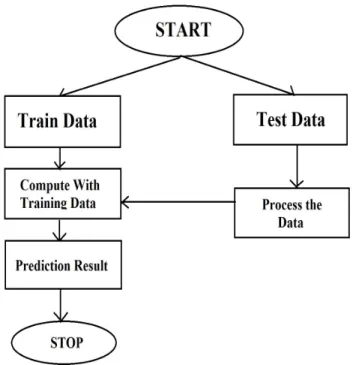
Figure 4.5.1 prepared for presenting a flow chart that was described our proposed model and we followed this flow chat to implement our model. At first we trained our machine with dataset and our data set classified into two categories.
4.6 Flowchart
No Name of attributes Type
1 Age Numeric
2 Gender Numeric
3 Blood pressure(mm Hg) Numeric
4 Exercise Numeric
5 Body mass index(weight in Kg/(height in m)²) Numeric
6 Stress Level Numeric
7 Genetic Numeric
8 Sleeping Hrs. Numeric
9 Smoking Numeric
10 Class Numeric
Figure 4.6.1: Flowchart of Diabetes Risk Prediction.
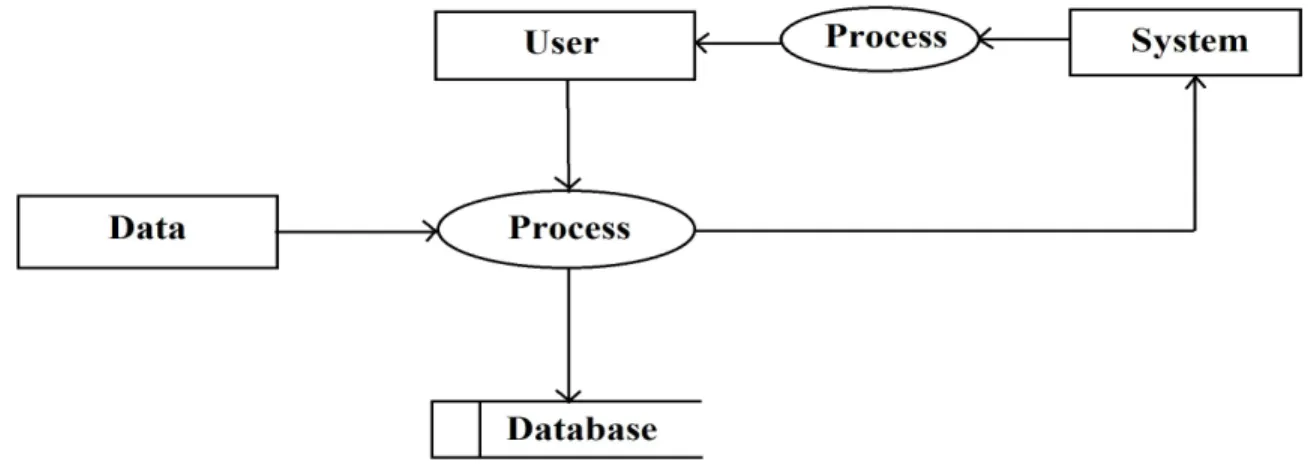
4. 7 Data Flow Diagrams
Data Flow Diagrams (DFD) is a way to represent system requirements in a graphicalform which lead to modular design. A DFD describes what data flow (logical) ratherthan how they are processed, so it does not depend on hardware, software, data structureor file organization.
Figure 4.7.1: Data Flow Diagram
CHAPTER 5
Implementation Requirements
We classified the dataset using weka 3.8.0 by applying different machine learning algorithms.
Weka is a collection of machine learning algorithms for solving real world data mining problems. It is written in Java and runs on almost any platform. The algorithms can either be applied directly to a dataset or called from our own Java code [18]. After that, compared the actual result with prediction result and we used the final result to developed a prediction application in Android platform. Here we have chosen Android because it is available mobile platform in recent world. We presented Table 6.2 to show the percentage of accuracy for classifying our dataset into three different levels: low, mwdium, and high risk with diabetes where we used five machine learning approaches. Finally, we find out the best result 98.72%
generated by IBK classifier approach.
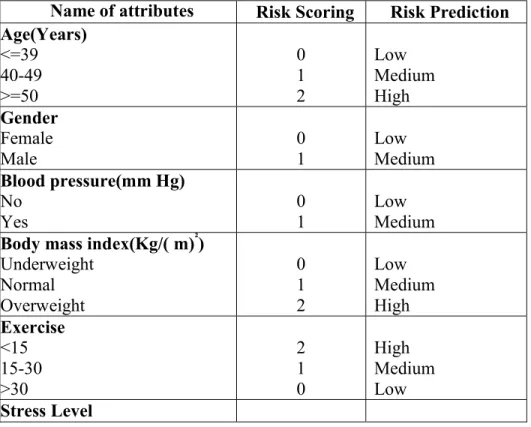
Table 5.1: Risk score considered for each attributes
Name of attributes Risk Scoring Risk Prediction Age(Years)
<=39 40-49
>=50
0 1 2
Low Medium High Gender
Female Male
0 1
Low Medium Blood pressure(mm Hg)
No Yes
0 1
Low Medium Body mass index(Kg/( m)²)
Underweight Normal Overweight
0 1 2
Low Medium High Exercise
<15 15-30
>30
2 1 0
High Medium Low Stress Level
Table 5.1 indicates the analysis process as a sample where we considered each attributes as a factor and set a risk score to measure the risk level of diabetes in three levels. Total risk score ranging from 0-14. If the total risks score are less than or equal six then the suggestion is: It isrisk free level or low level, if greater than six but less than ten, then the suggestion is: To take necessary steps to control blood glucose and start proper exercise for medium level risk finally, if greater than ten then predict level is in high risk with diabetes. At the time of implement to developed an Android application we considered these thereshold values to predict the diabetes risk level of a user.
Normal Medium High
0 1 2
Low Medium High Genetic
No Yes
0 1
Low High Sleeping Hrs.
<=5 5-7
>7
2 1 0
High Medium Low Smoking
No Yes
0 1
Low High Risk Level (0 -14) <=6
6-10
>10
Low Medium High
Table 5.2: Machine Learning Accuracy for classification algorithms
CHAPTER 6
Category Classifier Name Sensitivity
% Specificity
%
Accuracy %
Lazy IBK 100 100 100
Function MultilayerPerceptron 94.44 100 97.15
SMO 94.44 100 97.15
Trees J48 88.8 94.14 91.42
RandomForest 83.3 100 91.42
System Implementation
Analyzing the collected data we implemented an Android application that is easy to use, available mobile platform and user can predict the diabetes risk level in anyplace. In this section we discussed about our implementation work. Figure 6.1 shows the first user interface for this application. After this interface, user has to provide answers of some required questions. Finally user can know about the prediction result. Here prepared some user interfaces as a sample.
Figure 6.1: First Interface of Diabetes Risk Prediction
Figure 6.2: Sample question of Diabetes Risk Prediction
Here user will select age. There are three categories of ages. We counted ‘0’ scoring for the range “0-39” and counted ‘1’ scoring for “40-49”. The range “50-100” is counted ‘2’ scoring.
Figure 6.3: Sample question of Diabetes Risk Prediction
In this interface, there are three types of stress level-normal, medium and high. For the ‘normal’
level, risk scoring is counted ‘0’. Scoring ‘1’ is used for the ‘medium’. And scoring ‘2’ is for
‘high’ level.
Figure 6.4: Prediction result of Diabetes Risk Prediction
This interface shows the predicted result of the application. If the scoring is less than 6 then it provides ‘low probability’. When scoring range is ‘6-10’ it shows ‘medium probability’ and it will provide ‘high probability’ when the scoring will be greater than 10.
CHAPTER 7
Conclusion and Future Scope
7.1 Conclusion
Early prediction is a better approach rather than cure any diseases. Diabetes is one of the diseases which have no cure. In our country people are so much busy with their daily life activities but they have no more time to care about their health but healthy life is one of our daily needs. This paper is for increasing awareness about diabetes because in our country percentage of diabetic patient increases terrifically. So we should take necessary steps as soon as possible to stop this phenomenon. Here we provided an Android application that helps us to predict the diabetes risk level and suggested to take necessary steps.
In future this paper study can helps us to design more helpful application and to increase awareness about diabetes. We have also a future plan to develop more application for predicting other diseases which is more dangerous in our generation.
7.2 Future Scope
There are many important factors for diabetes prediction. There might be other risk factors that we did not consider. According to other important factors include gestational diabetes, insulin, glucose, skin etc. The proper prediction model would need more data gathering to make it more accurate.
In future, we will try to add push notification. This will send notification to user every day. This can engage user to our application. We will try to add monthly graph that can predict the risk &
probabilities of Diabetes. We will add daily logbook so that users can track their daily glucose, nutrition etc. Besides, we will try to make online version.
APPENDIX
Age Gender BMI Exercise Smoking Stress
Level Sleeping
Hour BP Genetic Class
1 0 1 1 0 2 2 0 0 No
1 0 0 1 0 1 1 0 0 yes
2 1 1 0 1 1 1 0 0 yes
1 1 1 2 1 1 1 0 0 No
2 1 1 1 0 2 1 0 0 yes
2 1 2 1 0 2 1 0 0 yes
1 0 2 1 0 2 1 0 0 yes
2 0 2 0 0 2 1 0 0 yes
1 0 1 2 0 2 1 0 0 No
1 1 0 2 0 0 1 0 0 No
1 1 1 2 0 0 1 0 0 No
2 1 2 1 0 1 1 0 0 yes
1 0 2 1 0 1 1 0 0 yes
2 1 1 0 0 1 1 0 0 yes
1 0 2 1 0 1 1 0 0 yes
2 1 1 1 0 1 1 0 0 yes
1 1 1 2 0 1 1 0 0 No
1 1 2 1 1 1 1 0 0 yes
1 1 1 2 0 1 1 0 0 No
1 1 1 2 1 1 1 0 0 No
1 1 1 1 0 2 1 0 0 No
1 1 2 0 0 0 1 0 0 No
1 1 1 2 0 0 1 0 0 No
1 1 1 1 0 0 1 0 0 No
1 1 1 2 1 0 1 0 0 No
2 0 1 1 0 1 1 0 0 yes
2 1 1 1 0 1 1 0 0 yes
1 0 2 0 0 1 1 0 0 yes
1 0 2 2 0 1 1 0 0 No
1 1 1 1 0 1 1 0 0 No
1 1 1 2 0 1 1 0 0 No
1 1 1 0 1 1 1 0 0 yes
1 1 1 1 1 1 1 0 0 No
1 1 1 2 1 1 1 0 0 No
1 1 1 2 1 1 1 0 0 No
1 1 1 2 1 1 1 0 0 No
1 1 2 0 0 1 0 0 0 No
1 1 1 2 0 1 0 0 0 No
2 0 1 1 0 2 0 0 0 yes
1 1 2 1 0 2 0 0 0 yes
2 0 2 2 0 2 0 0 0 yes
2 1 1 2 1 2 0 0 0 No
1 1 1 2 0 0 0 0 0 No
1 1 1 2 1 0 0 0 0 No
1 1 1 2 0 1 0 0 0 No
1 1 1 2 0 1 0 0 0 No
2 1 1 0 1 1 0 0 0 yes
1 1 1 2 1 1 0 0 0 No
1 0 1 1 0 1 2 1 0 yes
2 1 1 0 0 2 1 1 0 yes
2 1 2 1 0 2 1 1 0 yes
2 0 2 1 0 1 1 1 0 yes
1 1 2 2 0 1 1 1 0 No
1 1 2 1 1 1 1 1 0 yes
1 0 2 1 0 2 1 1 0 yes
1 1 2 2 1 2 1 1 0 No
2 1 2 0 0 1 1 1 0 yes
2 1 2 0 1 1 1 1 0 yes
1 1 1 0 1 1 1 1 0 yes
1 1 2 0 1 1 1 1 0 No
1 0 2 1 0 0 1 1 0 No
1 0 2 2 0 1 1 1 0 yes
1 1 1 2 0 1 1 1 0 No
1 1 2 0 0 1 1 1 0 No
1 1 2 2 1 1 1 1 0 No
2 0 1 1 0 2 0 1 0 yes
2 0 0 2 0 2 0 1 0 yes
2 0 2 1 0 2 2 0 1 yes
2 0 1 2 0 0 2 0 1 yes
1 1 1 1 0 1 2 0 1 yes
2 1 1 0 1 1 2 0 1 yes
2 1 1 0 0 1 1 0 1 yes
2 0 1 0 0 2 1 0 1 yes
1 0 1 0 0 2 1 0 1 yes
1 0 1 0 0 2 1 0 1 yes
2 0 2 1 0 2 1 0 1 yes
1 1 1 1 1 2 1 0 1 yes
1 1 1 1 1 2 1 0 1 yes
1 1 2 2 1 0 1 0 1 No
1 1 2 2 0 1 1 0 1 No
1 1 1 2 0 1 1 0 1 No
2 1 2 1 1 1 1 0 1 yes
1 1 2 2 1 1 1 0 1 yes
1 1 1 2 1 1 1 0 1 No
1 1 1 2 1 1 1 0 1 yes
2 1 2 0 0 1 1 0 1 yes
1 0 2 1 0 2 1 0 1 yes
1 1 1 0 0 2 1 0 1 yes
2 0 2 1 0 2 1 0 1 yes
1 1 2 0 0 2 1 0 1 No
1 1 1 1 1 2 1 0 1 yes
2 1 2 2 1 2 1 0 1 yes
2 1 1 1 1 2 1 0 1 yes
2 0 1 1 0 0 1 0 1 yes
1 1 2 2 0 0 1 0 1 No
2 1 0 1 1 0 1 0 1 yes
1 0 1 0 0 1 1 0 1 yes
1 0 1 1 0 1 1 0 1 yes
1 0 1 1 0 1 1 0 1 yes
1 0 1 1 0 1 1 0 1 yes
1 1 1 1 1 1 1 0 1 yes
2 1 1 0 1 1 1 0 1 yes
1 1 1 2 1 1 1 0 1 No
1 1 1 2 1 1 1 0 1 No
1 1 2 1 1 1 1 0 1 No
2 1 1 2 1 1 1 0 1 No
2 0 1 0 0 2 0 0 1 yes
1 1 2 2 0 0 0 0 1 No
1 0 2 0 0 1 0 0 1 yes
2 1 1 0 0 2 0 0 1 yes
2 1 1 0 0 2 0 0 1 yes
1 0 0 2 0 2 0 0 1 yes
1 0 1 1 0 2 0 0 1 yes
2 1 2 0 1 2 0 0 1 yes
1 1 1 0 0 0 0 0 1 No
1 1 1 2 0 0 0 0 1 No
2 1 1 1 1 1 0 0 1 yes
1 1 2 2 1 1 0 0 1 No
1 0 1 0 0 1 0 0 1 yes
1 1 1 0 1 1 0 0 1 yes
1 0 2 1 0 2 2 1 1 yes
1 1 2 0 1 1 2 1 1 yes
1 1 1 2 1 1 2 1 1 yes
1 0 2 0 0 2 1 1 1 yes
1 0 1 1 0 2 1 1 1 yes
1 0 2 1 0 2 1 1 1 yes
1 0 2 2 0 2 1 1 1 yes
2 1 1 0 1 2 1 1 1 yes
2 1 2 1 1 2 1 1 1 yes
1 1 2 2 1 2 1 1 1 yes
2 0 1 0 0 1 1 1 1 yes
1 0 1 1 0 1 1 1 1 yes
2 1 2 1 0 1 1 1 1 yes
1 0 1 1 0 1 1 1 1 yes
1 0 2 2 0 1 1 1 1 No
2 1 2 1 1 1 1 1 1 yes
1 1 2 2 1 1 1 1 1 yes
1 1 1 2 1 1 1 1 1 No
2 0 2 0 0 1 1 1 1 yes
2 1 1 0 0 2 1 1 1 yes
1 0 2 1 0 2 1 1 1 yes
1 0 2 2 0 2 1 1 1 No
2 0 2 0 0 1 1 1 1 yes
2 1 1 0 0 1 1 1 1 yes
1 1 2 1 0 1 1 1 1 yes
1 0 2 2 0 1 1 1 1 No
2 1 1 0 1 1 1 1 1 yes
2 1 2 2 1 1 1 1 1 yes
2 1 1 2 1 1 1 1 1 yes
1 0 2 0 0 2 0 1 1 yes
1 0 1 0 0 2 0 1 1 yes
2 0 1 1 0 2 0 1 1 yes
2 1 2 0 0 1 0 1 1 yes
2 1 1 0 0 1 0 1 1 yes
1 1 2 0 1 0 0 1 1 yes
2 1 1 0 1 0 0 1 1 yes
2 1 2 0 0 1 0 1 1 yes
References
[1] "Diabetes Fact sheet N°312". WHO. October 2013. Archived from 25 March 2014.
[2] Kitabchi, AE; Umpierrez, GE; Miles, JM; Fisher, JN (Jul 2009).
diabetes". Diabetes Care. 32 (7): 1335
[3] "About diabetes". World Health Organization. Archived from April 2014.
[4] Velu C.M, K.R.Kashwan,2013.”Visual Data Mining Techniques International Advance Computing Conference (IACC),pp [5] Projections of global mortality and
2006, 3(11):e442.
[6] Diabetes mellitus, fasting blood glucose analysis of 102 prospective
Sarwar N, Gao P, Seshasai SR, Gobin R, Kaptoge S, Di Angelantonio et al. Lancet. 2010; 26;375:2215
[7] Md. Aminul Islam and Nusrat Jahan,“Prediction of Onset Diabetes using Machine Learning Techniques”. International Journal of Computer Applications
[8] Mukeshkumari, Dr. RajanVohra, and Anshularora,
International Journal of Computer Science and Information Technologies (IJCSIT), 5178.
[9] Beckles GLA, Thompson-Reid PE, editors. Diabetes and Women’s Health Across the Life Stages: A Public Health Perspective. Atlanta: U.S. Department of Health and Human Services, Centers for Disease Control and Prevention, National Center for Chronic Disease Prevention and Health Promotion.
[10] VeenaVijayan V., and AswathyRavikumar, “
Diabetes Mellitus”.International Journal of Computer Applications (0975 2014.
[11] Vinaytosh Mishra, Dr. Cherian Samuel, and Prof. S.K.Sharma, “USE OF MACHINE LEARNING TO
PREDICTTHE ONSET OF DIABETES”. International Journal of Recent advances in Mechanical Engineering (IJMECH) Vol.4, No.2, May 2015.
[12] MerajNabi, A bdul Wahid, and Pradeep Kumar, “Performance Analysis of Classification Algorithms in Predicting Diabetes”. International Journal of Advanced Research in Computer Science, Volume 8, No. 3, March – April 2017, ISSN No. 0976
[13] AiswaryaIyer, S. Jeyalatha and Ron
MINING TECHNIQUES”. International Journal of Data Mining & Knowledge Management Process (IJDKP) Vol.5, No.1, January 2015.
[14] G. MeeraGandhi, “Machine Learning Approach for Attack Prediction and Classific
Learning Algorithms”. International Journal of Computer Science & CommunicationVol. 1, No. 2, July December 2010, pp. 247-250.
. WHO. October 2013. Archived from the original on 26 August 2013
Kitabchi, AE; Umpierrez, GE; Miles, JM; Fisher, JN (Jul 2009). "Hyperglycemic crises in adult patients with . Diabetes Care. 32 (7): 1335–43. doi:10.2337/dc09-9032. PMC 2699725 . PMID
. World Health Organization. Archived from the original on 31 March 2014
Velu C.M, K.R.Kashwan,2013.”Visual Data Mining Techniques forClassification of Diabetic Patients”, IEEE International Advance Computing Conference (IACC),pp-1070-1075.
and burden of disease from 2002 to 2030.Mathers CD, Loncar D. PLoS Med,
glucose concentration, and risk of vascular disease: a spective studies. Emerging Risk Factors
Sarwar N, Gao P, Seshasai SR, Gobin R, Kaptoge S, Di Angelantonio et al. Lancet. 2010; 26;375:2215
Md. Aminul Islam and Nusrat Jahan,“Prediction of Onset Diabetes using Machine Learning International Journal of Computer Applications 180(5):7-11, December 2017.
Mukeshkumari, Dr. RajanVohra, and Anshularora, “Prediction of Diabetes Using Bayesian Network”.
International Journal of Computer Science and Information Technologies (IJCSIT), Vol. 5 (4), 2014, 5174
Reid PE, editors. Diabetes and Women’s Health Across the Life Stages: A Public Health Perspective. Atlanta: U.S. Department of Health and Human Services, Centers for Disease Control and
l Center for Chronic Disease Prevention and Health Promotion.
VeenaVijayan V., and AswathyRavikumar, “Study of Data Mining Algorithms for Prediction and Diagnosis of International Journal of Computer Applications (0975 – 8887) Volume 95
Vinaytosh Mishra, Dr. Cherian Samuel, and Prof. S.K.Sharma, “USE OF MACHINE LEARNING TO PREDICTTHE ONSET OF DIABETES”. International Journal of Recent advances in Mechanical Engineering (IJMECH) Vol.4, No.2, May 2015.
ahid, and Pradeep Kumar, “Performance Analysis of Classification Algorithms in International Journal of Advanced Research in Computer Science, Volume 8, No. 3, April 2017, ISSN No. 0976-5697.
AiswaryaIyer, S. Jeyalatha and RonakSumbaly, “DIAGNOSIS OF DIABETES USING CLASSIFICATION MINING TECHNIQUES”. International Journal of Data Mining & Knowledge Management Process (IJDKP)
G. MeeraGandhi, “Machine Learning Approach for Attack Prediction and Classification using Supervised Learning Algorithms”. International Journal of Computer Science & CommunicationVol. 1, No. 2, July
on 26 August 2013. Retrieved
"Hyperglycemic crises in adult patients with PMID 19564476.
on 31 March 2014. Retrieved 4
forClassification of Diabetic Patients”, IEEE
.Mathers CD, Loncar D. PLoS Med,
collaborative meta- Factors Collaboration.
Sarwar N, Gao P, Seshasai SR, Gobin R, Kaptoge S, Di Angelantonio et al. Lancet. 2010; 26;375:2215-2222.
Md. Aminul Islam and Nusrat Jahan,“Prediction of Onset Diabetes using Machine Learning
Prediction of Diabetes Using Bayesian Network”.
Vol. 5 (4), 2014, 5174-
Reid PE, editors. Diabetes and Women’s Health Across the Life Stages: A Public Health Perspective. Atlanta: U.S. Department of Health and Human Services, Centers for Disease Control and
Study of Data Mining Algorithms for Prediction and Diagnosis of 8887) Volume 95– No.17, June
Vinaytosh Mishra, Dr. Cherian Samuel, and Prof. S.K.Sharma, “USE OF MACHINE LEARNING TO PREDICTTHE ONSET OF DIABETES”. International Journal of Recent advances in Mechanical Engineering
ahid, and Pradeep Kumar, “Performance Analysis of Classification Algorithms in International Journal of Advanced Research in Computer Science, Volume 8, No. 3,
akSumbaly, “DIAGNOSIS OF DIABETES USING CLASSIFICATION MINING TECHNIQUES”. International Journal of Data Mining & Knowledge Management Process (IJDKP)
ation using Supervised Learning Algorithms”. International Journal of Computer Science & CommunicationVol. 1, No. 2, July-
[15] Kayaer, K. and Yıldırım, T.: Medical Diagnosis on Pima Indian Diabetes Using General Regression Neural Networks. In: Proceedings of the International Conference on Artificial Neural Networks and Neural Information Processing, pp. 181–184 (2003).
[16] S.B. Kotsiantis, “Supervised Machine Learning: A Review of Classification Techniques”, Informatica 31 (2007) 249-268.
[17] A comparative study on diabetes disease diagnosis using neural networks. Volume 36, Issue 4, May 2009, Pages 8610–8615.ELSEVIER.
[18] Sapna Jain 2.M Afshar Aalam3. M. N Doja,”K-MEANS CLUSTERING USING WEKA INTERFACE”,
Proceedings of the 4th National Conference; INDIACom-2010 Computing For Nation Development, February 25 – 26, 2010.