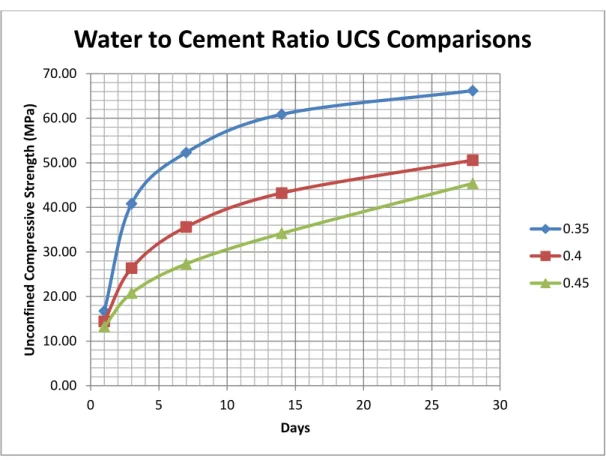
The objective is to optimize the ratio of waste to cement and admixture (fly ash) based on unconfined compressive strength as the main criterion. S/S performance is measured by leaching analysis to determine the leaching of metal in the leachate, the porosity and permeability properties of the unconfined compressive strength stabilized waste, and its leaching behavior. The lowest water-cement ratio of 0.35 was found to give a maximum unconfined compressive strength of 66.17 MPa.
INTRODUCTION
- Background of Study
- Problem Statement
- Objectives
- Scope of Study
One of the criteria involved is the presence of additives in the cement-based matrix. However, with the combination of hydrocarbon waste in the cement mix, the properties of the fly ash can be changed, which can result in better or worse S/S cement matrix. To study the effects of absence and presence of fly ash on porosity, permeability, leachability and unconfined compressive strength of the immobilized HC waste.
LITERATURE REVIEW
Stabilization and Solidification Technology
Hydrocarbon Waste
For a process plant, waste streams are often mixed and stored with other forms of waste. However, most of the information obtained is either specified for their respective process waste or a mere simple assumption model about the specific type of waste (Bojes and Pope, 2007). Currently, different refinery operations that produce different forms of waste streams have yet to be systematically grouped or characterized for further understanding.
Admixtures
METHODOLOGY
Characterization
- Specific Gravity
- Moisture Content
- Total, Volatile and Fixed Solid
- Metal Content (AAS)
- Total Oil and Grease (TOG) Analysis
- Loss on Ignition (LOI)
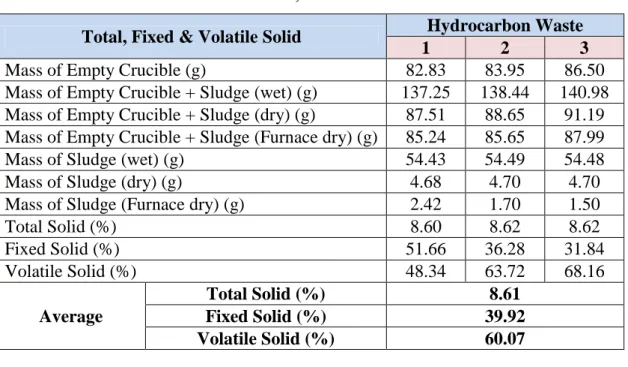
For the determination of the properties of the hydrocarbon waste, the total, solid and volatile solids will assist in the calculation of cement and binder. Standard calibration curves were established before determining the concentration of the metals in the leachate. Cool the crucible to ambient temperature in the desiccator and weigh the crucible to the nearest 1 mg.
S/S Evaluation Procedures
- Unconfined Compressive Strength (UCS) Test
- Leaching Test
- Porosity & Permeability Test
This test method covers the determination of pore volume and pore volume distributions of soil and rock using the mercury intrusion porosimeter method. The range of apparent pore diameters for which this test method is applicable is determined by the operating pressure range of the test instrument. In the oil and gas industry, this property is defined as the ability of porous material to allow fluid to pass through it.
Although encapsulated with cement, the presence of pores and their interconnection with other pores can increase the permeability of the matrix, allowing the leaching medium to easily drain the improperly immobilized hydrocarbon waste. The lower the permeability of the matrix, the better its quality to act as a waste management method.
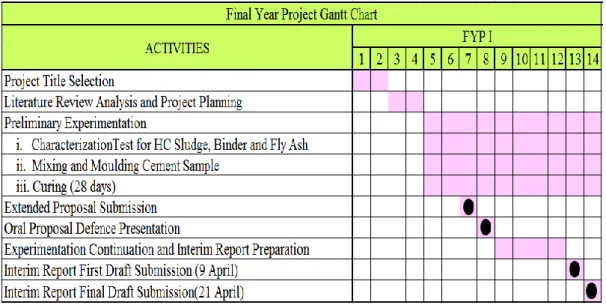
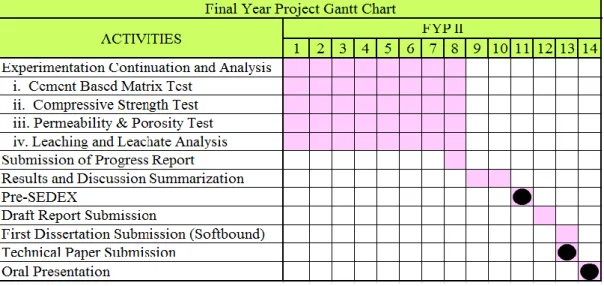
Gantt Chart and Key Milestones
RESULTS AND DISCUSSION
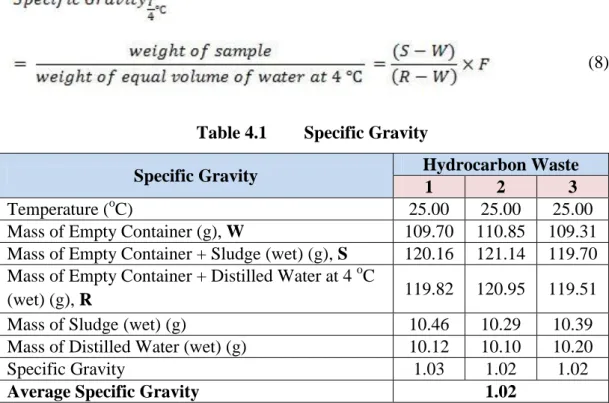
Specific Gravity
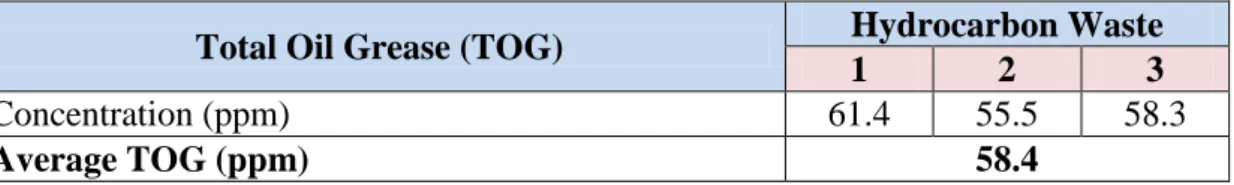
Total Oil and Grease (TOG)
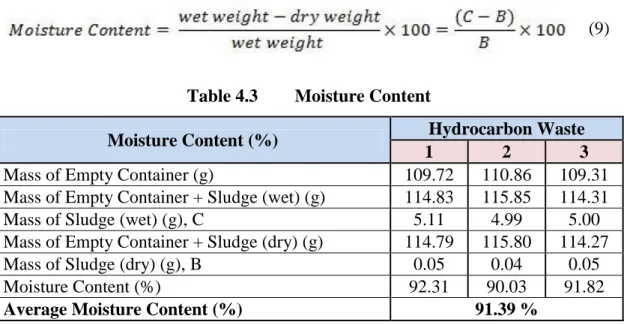
Moisture Content
Total, Fixed And Volatile Solid
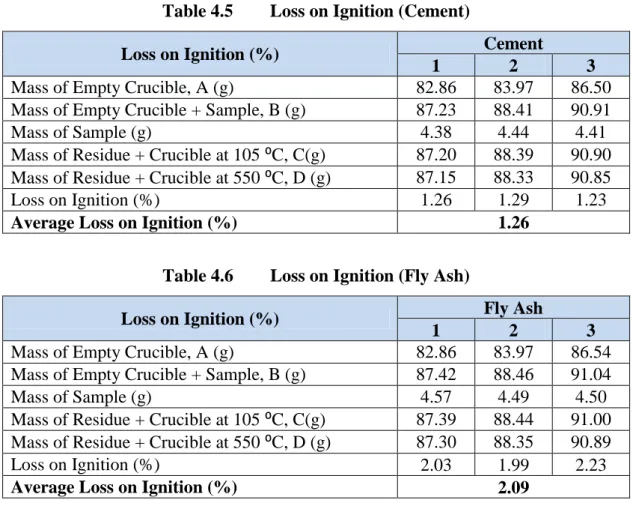
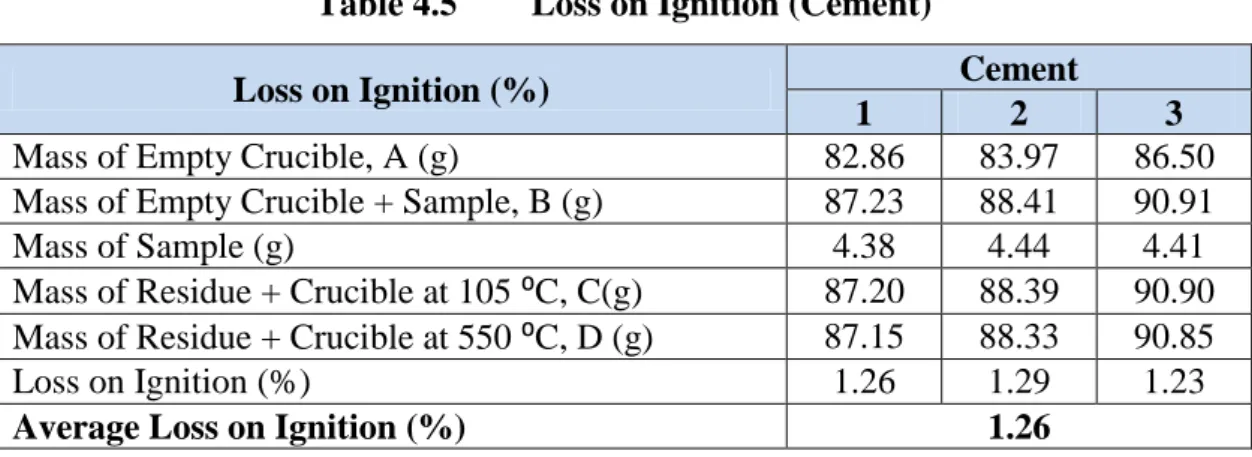
Loss on Ignition
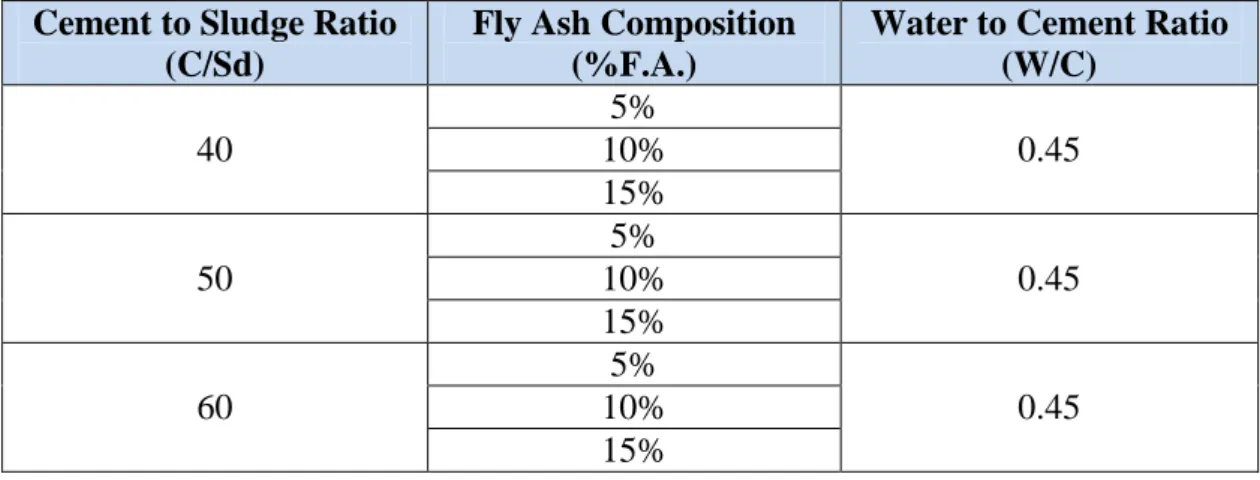
Mixing Calculation
In the presence of a cement replacement material that is fly ash, the mass of cement decreases with the percentage of fly ash added. Based on a water/cement (W/C) ratio of 0.45, the calculated amount of water is based on the amount of cement. However, the water present in the mud must be taken into account to avoid over-hydrating the mixture.
Therefore, the actual amount of water required is calculated by subtracting the amount of water present in the mud from the amount of water calculated on the basis of the mass of cement. The experiment will cover a wider range of cement-to-mud ratio and cement-to-water ratio. Once the mixing calculation is done, the next thing to look at is the process of mixing the mixture.
Mixing
Based on the unconfined compressive strength test for the entire sample, the optimized ratio will be taken from the data and further tested for other properties such as TCLP, metal content, porosity and permeability. Based on these properties, the research will be able to derive the effect of adding fly ash to the S/S cement matrix for waste management purposes. If it proves successful, this technique can be certified as one of the promising waste management methods rather than burning the hydrocarbon waste, which results in the consumption of energy and natural resources.
Unconfined Compressive Strength
- Water to Cement
- Cement to Sludge
- Cement to Binder
The lowest water-cement ratio increased significantly in other series of specimens with a strong increase in unconfined compressive strength. The specimens matured on day 28 with the lowest water-cement ratio dominate, with the highest unconfined compressive strength of 66.17 MPa. From the obtained data, graphs were drawn showing the relationship between the unlimited development of compressive strength and the composition of mud and fly ash.
The unconfined compressive strength increases steadily for C/Sd = 60 until the end for all fly ash composition with 15% fly ash ratio showing the highest strength achieved. For C/Sd = 60, the unconfined compressive strength increases as the fly ash composition increases. Based on the graph above, as the ratio of cement to slurries (C/Sd) increases, the unconfined compressive strength took the opposite behavior of the increasing strength while the increase in the amount of fly ash is observed.
At the lowest C/Sd ratio, the graph showed a decrease in unconfined compressive strength as the amount of fly ash in the sample increased. The increase in cement to sludge ratio, C/Sd = 50, observed a rapid decrease in unconfined compressive strength as the increase in the amount of fly ash in the samples. To further see the connection between the sludge, fly ash and unrestricted compressive strength development, a 3D surface plot was made using Microsoft Excel.
The higher sludge and fly ash content increases the unconfined compressive strength of the samples.
Porosity And Permeability
- Without Compressibility Correction
- With Compressibility Correction
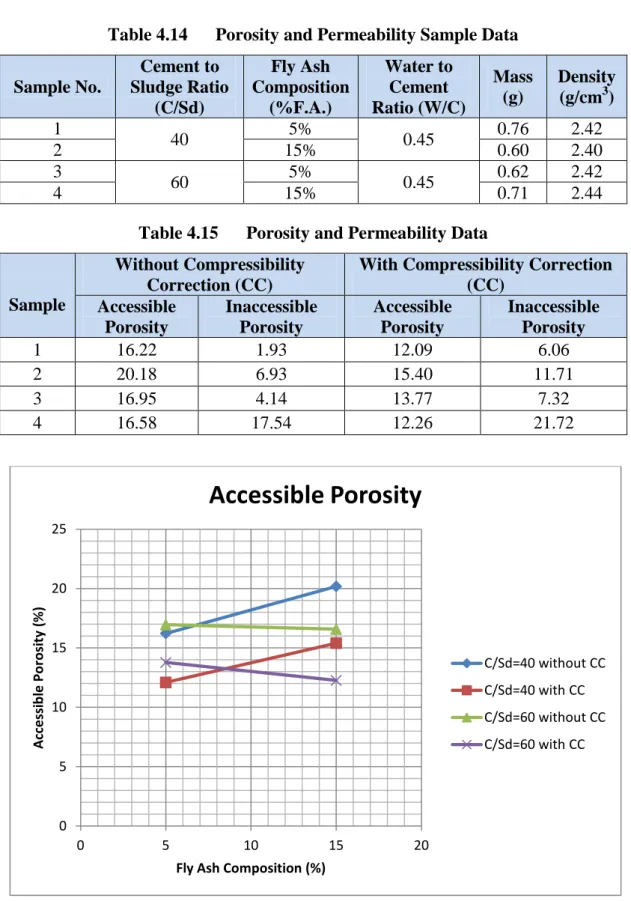
As depicted in Figure 4.10, for C/Sd = 40 without compressibility correction, the available porosity decreases with increasing fly ash composition. The sample showed a 24% increase in available porosity as the fly ash composition increases from 5% to 15%. For C/Sd = 60 samples, the available porosity decreases by 2% as the fly ash composition increases from 5% to 15%.
The higher ratio of sludge with high fly ash composition showed a better increase in inaccessible porosity with increasing C/Sd ratio. The low C/Sd ratio showed a rapid decrease in accessible porosity compared to the high C/Sd ratio as the fly ash composition increases. In the case of similar fly ash ratio, the result showed an increase in the achievable porosity as the C/Sd ratio increases for 5% fly ash composition.
However, a decrease in accessible porosity was observed as the high fly ash formulation was tested for porosity with increasing C/Sd ratio. For accessible porosity with compressibility correction, it can be concluded that at low C/Sd ratio, the accessible ratio increases greatly with increasing fly ash composition, but decreases slightly at higher C/Sd ratio. According to C/Sd = 40 points in the diagram, as the fly ash composition increases, the unconfined compressive strength decreases with higher available porosity.
However, referring to C/Sd = 60 points in the diagram, the increase in fly ash composition increases the unconfined compressive strength with decreasing available porosity.
Toxicity Characteristic Leaching Procedure
From Figure 4.12, a comparison is made between similar C/B ratio for an increase in C/Sd ratio. Referring to the 5% fly ash ratio line, as the C/Sd ratio increases, the unconfined compressive strength decreases but shows an increase in the achievable porosity as can be seen in the graph. As for the 15% fly ash ratio line, as the C/Sd ratio increases, its unconfined compressive strength also increases, but a decrease was observed in its achievable porosity.
Before determining the concentration of metals in the leachate, a standard calibration curve is prepared by preliminary preparation of standard solutions. Readings were obtained against a standard curve obtained from standard solutions ranging from 1, 2 and 4 ppm. Sewage discharged upstream of the water supply must meet standard A, while sewage discharged downstream must meet standard B.
The content of all metals in the sludge exceeded the regulatory limit in the standard B set by EQA 1974, as can be seen in Table 4.19. However, after stabilization and solidification with OPC and fly ash, almost all metals showed untraceable hydrocarbon waste metals. Based on the readings obtained in Table 4.19, it can be concluded that the leaching of dissolved metal in the hydrocarbon waste is negligibly low and below the EQA 1974 Industrial Wastewater Prescribed Metals.
Oil and Grease in Leachate
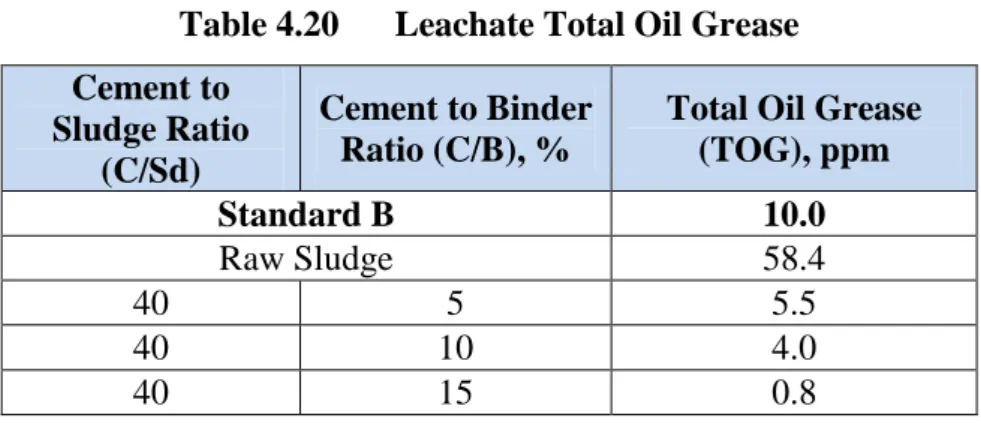
Referring to Table 4.20, compared to the original total oil and grease (TOG) in the raw sludge sample, the leachate showed a low TOG content after being solidified and stabilized with cement and fly ash. As described in Standard B, EQA 1974, TOG is limited to 10 ppm in which the raw sludge must be treated before being released into the environment due to the high oil and grease content of the waste itself. However, the leachate from S/S showed a significantly low amount of oil and grease, which makes it possible to discharge it safely into the environment.
S/S hydrocarbon wastes using fly ash as an additive have been proven to help reduce the level of oil and grease discharge, allowing for safe disposal into the environment without the harmful effects of waste hydrocarbon sludge.
CONCLUSION AND RECOMMENDATION
Review of the scientific literature on the use of stabilization/solidification for the treatment of contaminated soil, solid waste and sludge. Evaluation of Solidification and Stabilization for Treatment of Soils Contaminated by Hard Chromium Boundary Sites, Department of the Army: 279. Development of New Methods for Solid Waste Characterization.” In: International Seminar on Solidification and Stabilization of Hazardous Wastes.
Comparison of five solidification/stabilization processes for the treatment of municipal waste incineration residues - physical testing. 34;Cement-Based Petroleum Refinery Sludge Stabilization/Solidification: Leaching Behavior of Alkanes and PAHs." Journal of Hazardous Materials. 34;An Integrated Framework for Evaluating Leaching in Waste Management and Use of Secondary Materials." Environmental Engineering 19(3): 46.
PhD thesis, Faculty of Engineering and Technology - Department of Civil and Transport Engineering, Norwegian University of Science and Technology, Trondheim. 34; Stabilization/solidification of a residue from the incineration of municipal solid waste using fly ash-based geopolymers. " Journal of Hazardous Materials. Stabilization/solidification of palm oil mill effluent sludge and a pure model study using cementitious technique.
34; Environmental behavior of cement-based stabilized foundry sludge products incorporating additives." Journal of Hazardous Materials. 34; Stabilization/solidification of hazardous and radioactive wastes with alkali-activated cements." Hazardous Materials Journal. 34; Environmental effects of industrial sludge stabilization/coagulation products: chemical or ecotoxicological hazard assessment?" Journal of Hazardous Materials.