©Daffodil International University 1 HEART DISEASE PREDICTION SYSTEM BY USING MACHINE LEARNING
METHODOLOGIES
BY
Mahmudul Hasan 213-25-085
This report represents partial fulfillment of the requirements for a Master of Science degree in computer science and engineering courses
Supervised By Dr. S. M. Aminul Haque
Associate Professor Department of CSE Daffodil International University
DAFFODIL INTERNATIONAL UNIVERSITY DHAKA, BANGLADESH
SEPTEMBER 2022
©Daffodil International University 2 APPROVAL
This Study titled “HEART DISEASE PREDICTION SYSTEM BY USING MACHINE LEARNING METHODOLOGIES”, submitted by Mahmudul Hasan ID:213-25-085 to the Computer Science and Engineering Department, Daffodil International University has been accepted as satisfactory for the partial completion of the requirements for the degree of M.Sc. in Computer Science and Engineering (MSc) and approved as to it’s style and contents. The presentation has been held on 21-09-2022.
BOARD OF EXAMINERS
________________________
Dr. S M Aminul Haque, PhD
Associate Professor & Associate Head
Department of Computer Science and Engineering Faculty of Science & Information Technology Daffodil International University
Chairman
________________________
Ms. Most. Hasna Hena Assistant Professor
Department of Computer Science and Engineering Faculty of Science & Information Technology Daffodil International University
Internal Examiner
_____________________
Mr. Md. Abbas Ali Khan Assistant Professor
Department of Computer Science and Engineering Faculty of Science & Information Technology Daffodil International University
Internal Examiner
________________________
Dr. Mohammad Shorif Uddin, PhD Professor
Department of Computer Science and Engineering Jahangirnagar University
External Examiner
ii
©Daffodil International University 3 DECLARATION
I hereby declare that this project was carried out by us under the supervision of Dr. S.M. Aminul Haque Associate professor at CSE Narcissus International University. I also declare that this project, or any part of this project, has not been submitted for the award of a degree or diploma.
Supervised by:
Dr. S. M. Aminul Haque
Associate Professor Department of CSE
Daffodil International University
Submitted by:
Mahmudul Hasan ID:213-25-085
Department of CSE
Daffodil International University
iii
©Daffodil International University 4 ACKNOWLEDGMENT
First of all, I would like to express my heartfelt thanks and gratitude to Almighty God for successfully completing my thesis.
Thank you very much. Special thanks to Associate Professor S. M. Aminul Haque, Daffodil International University, CSE Faculty, Dhaka. Deep knowledge and great interest of the supervisor in the field of "machine learning" to carry out this project. His constant patience, his scientific guidance, his constant encouragement, his constant energetic supervision, his constructive criticism, his valuable advice, his reading of many poor quality drafts and correcting them every step of the way, made this work possible. I was able to complete the thesis.
I would like to sincerely thank Mr. Touhid Bhuiyan for his kind assistance in completing the project and other faculty members and staff of his CSE department at Daffodil International University.
increase.
I would like to thank all my classmates from Daffodil International University for contributing to this discussion while completing their coursework.
Finally, i must acknowledge respectfully the constant support and patience of my parents.
iv
©Daffodil International University 5 ABSTRACT
There is a saying that “Health is wealth”. In the modern civilized world, being healthy is indeed a blessing. Our lives get easier as we evolve each day, but it also makes us lethargic and more susceptible to bad habits. Heart disease is a serious problem facing the world today. It caused death, and anyone can deal with it. Modern heart failure is also a disease that affects young people because of their unhealthy lifestyles. They are more susceptible to the disease because of high sugar intake, long screening times, and early morning awakenings. Most people are unable to recognize symptoms in the early stages, and by the time the patient reaches the hospital it is too late. Therefore, developing systems that can detect the early signs of disease is essential to stem the problem. The primary objective of this study is to provide physicians with mechanisms that accurately aid early diagnosis of heart disease using six machine learning (ML) models on performance parameter confusion metrics, accuracy, precision, f1 measure, and retrieval. to provide.
v
©Daffodil International University 6
TABLE OF CONTENTS
CONTENTS PAGE
Board of examiners ii
Declaration iii
Acknowledgements iv
Abstract v
CHAPTER
CHAPTER 1: Introduction
1-21.1 Introduction 1
1.2 Motivation 1
1.3 Rationale Of Study 2
1.4 Research Question 2
1.5 Expected output 2
1.6 Layout of Report 2
CHAPTER 2: Background Study
3-72.1 Introduction 3
2.2 Related Works 3-4
2.3 Research Summary 4-7
2.4 Scope of the Problem 7
2.5 Challenges 7
CHAPTER 3: Research Methodology
8-223.1 Introduction 8
3.2 Research Subject and instrumentation 8
3.3 Dataset Description 8-16
3.4 Co-relation map 16-17
3.5 Data Preprocessing 18
3.6 Proposed Methodology 18-19
3.7 Machine Learning Algorithm 20-22
3.8 Implementation Requirements 22
vi
©Daffodil International University 7
CHAPTER : 4 Research Methodology
23-254.1 Introduction 23
4.2 Experimental Result 23-24
4.3 Confusion Matrix 24
4.4 Comparison 25
CHAPTER 5 :CONCLUSION AND FUTURE SCOPE 26
5.1 Conclusion 26
5.2 Future Scope 26
REFERENCES
27-28vii
©Daffodil International University 8
LIST OF FIGURES
FIGURES PAGE NO
Figure 3.1 Resting Electrocardiographic Distribution 10
Figure 3.2 Thal Distribution 11
Figure 3.3 Number of Major Vessels Distribution pie chart 12
Figure 3.4 Chest Pain Type Distribution 13
Figure 3.5 Slope of the peak Exercise Distribution 14
Figure 3.6 Heart rate 14
Figure 3.7 serum cholestoral column distribution 15
Figure 3.8 gender based heart diseases distribution 16
Figure 3.9: Correlation Map 17
Figure 3.10: Work methodology of this paper (Merging the datasets, preprocessing, splitting the dataset, training the dataset with ml applied models and result in analysis)
19
Figure 4.1: Confusion Matrix of KNN model on our dataset 24
Figure 4.2:Comparison of ML Models 25
viii
©Daffodil International University 9
LIST OF TABLES
TABLES PAGE NO
Table 2.1: Summary of previous researches 4-7
Table 3.1: Data statistics 9
Table 4.1: Experimental Result 23
ix
©Daffodil International University 1
CHAPTER 1
INTRODUCTION
1.1 Introduction
More than 30% of all deaths are due to cardiovascular disease, is a type of heart disease that remains one of the leading causes of death worldwide. By 2030, an estimated 22 million people will die in the world if nothing is done. A heart attack or stroke can occur because of plaque on the artery walls that block the flow of blood. Risk factors for heart disease include a sedentary lifestyle, a poor diet, and heavy drinking of alcohol and tobacco consumes. The chances of heart disease can be decreased by adopting a healthy lifestyle, including decreasing salt from the diet, having more fruits and vegetables, engaging in regular physical activity, and giving up alcohol and tobacco. Approximately 5% of outpatients in the United States are misdiagnosed with major medical conditions [2]. In Bangladesh, people are also suffering from heart disease alarmingly, especially women. Many studies aim to identify heart disease. ML is pervasive in the healthcare system, it's much easier for doctors and the general population who already have it. Therefore, prevention of heart disease is necessary these days; Our paper proposed ML models to detect heart disease in a patient.
1.2 Motivation
People today easily carry out their duties and consume unhealthy diets that cause death. This problem is escalating faster in Bangladesh. Young people under the age of 40 are affected by heart disease.
Although the fact that university students also face this problem, so prevention is extremely necessary. This work presents a more efficient ML technique to avoid this dilemma. An accurate result is needed because an incorrect prediction can endanger someone's life.
©Daffodil International University 2 1.3 Rationale of Study
In the group of 20 years and older, Bangladeshis have a high prevalence of fasting dysglycemia (IFG:
4-12%) and type 2 diabetes (T2DM: 4-11%). As a result, Bangladeshis are more likely to have heart disease for two obvious reasons: first, because they are exposed to social adversity; and second, because diabetes is very common there. Community awareness is very important in this regard.
1.4 Research Query
● Can we use mostly used machine learning methods to identify the heart disease prediction system (HDPS)?
● What will be the best algorithm for HDPS?
1.5 Expected result
● Heart disease prediction for people by machine learning method
● Differentiate machine learning algorithm for the best results.
● Publish a study based on the results.
● Heart disease caused death and we don't want any deaths. It is not enough just to stop this problem with medicine, we need to raise awareness. By using HDPS, everyone can check their health instantly and take action from the start.
1.6 Layout of the Report
• Chapter 1 introduces the motivation for the project, the rationale for the research, the research questions, and the expected results.
• Chapter 2 describes related work, research outlines, problem areas and challenges.
• Chapter 3 includes research topics and equipment, data gathering procedures, and statistical research.
• Chapter 4 presents experimental decisions and related discussions.
• Chapter 5 draws conclusions and discusses limitations of our study and upcoming work.
©Daffodil International University 3
CHAPTER 2
BACKGROUND STUDY
2.1 Introduction
Early detection of high-risk patients using improved diagnostics and predictive models is usually recommended to reduce mortality. This will improve subsequent treatment and prevention decision- making. Bangladesh wanted to do more research on this alarming topic. ML models are used in many articles, and many authors describe the models. Works deemed similar are described in Section 2.2, and related works are outlined in Section 2.3. The Challenges section describes the challenges during our study we have faced and the way we could improve our accuracy.
2.2 Related works
There is some works related to this topic. The recommended methodological processes are described in this work as record collection, user registration and login, taxonomy creator using Navies Bayesian, prediction and secure data transmission using AES . The result of this work is 89% [1].
Senthil Kumar proposed a hybrid model of HRFLM for heart disease detection. They combined two of his RF models and a linear model on the UCI dataset of 76 features. We also implemented NB, LR, DT, RF and linear models. The highest accuracy achieved by a hybrid model was he at 88.4%
[2].
Garate proposed how the authors achieved an accuracy of 98.7 on public datasets by applying ChiSqSelector, PCA, and RF. Various machine learning algorithms were used in this work. They used his six ML classifiers on the Cleveland, Hungarian, and Cleveland-Hungarian (CH) datasets.
They applied chi-square and principal component analysis (CHI-PCA) to random forests (RF) and showed the highest accuracy (98.7%, 99.0% and 99.4%, respectively) [3].
©Daffodil International University 4 A magazine was published by H.K. Heart disease prediction system using advanced machine learning technology. The authors reported that on the Cleveland heart disease dataset he used a 5 mL model and using LR he achieved an accuracy of 92.0 [4].
Dr. M. Kavitha proposed a hybrid model combining two ml-model RF-DTs and achieved an accuracy of 88° [5].
Another recent publication in which Nagaveli used various ML models to examine the diagnosis of heart disease was presented in this research paper. First, in a weighted fashion he uses NB to predict heart disease. The second is automated to analyze the localization and identification of ischemic heart disease according to frequency domain, time domain and information theory properties. The best accuracy was 95% when using XG Boost [6].
A similar journal by Javed was recently published. This study focuses on a comprehensive evaluation of automated diagnostics for predicting cardiac disease based on multiple method, including imaging, ECG and clinical feature-based data procedure. In addition, this study critically evaluates previous techniques and reviews their shortcomings [7].
2.3 Research Summary
Table 2.1 Summary of related previous studies
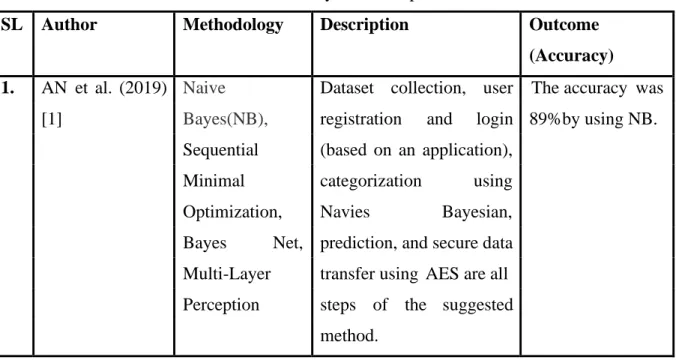
SL Author Methodology Description Outcome (Accuracy) 1. AN et al. (2019) Naive Dataset collection, user The accuracy was
[1] Bayes(NB), registration and login 89%by using NB.
Sequential (based on an application), Minimal categorization using Optimization, Navies Bayesian, Bayes Net, prediction, and secure data Multi-Layer transfer using AES are all Perception steps of the suggested
method.
©Daffodil International University 5 2. Senthil Kumar et
al. (2019) [2]
Hybrid RF with a linear model (HRFLM), NB, LR, DT, RF, Linear model.
They proposed a hybrid approach for detecting heart disease using UCI dataset
Best accuracy of 88.4% using HRFLM
3. Garate et (2020) [3]
al. DT, GBT, LR, NB, RF
They used six ML For
ChiSqSelector + PCA and RF, XGBOOST-98.7%
classifiers to validate. For the Cleveland, Hungarian, and Cleveland-Hungarian (CH) datasets, chi-square and principal component analysis (CHI-PCA) with random forest (RF) had the greatest accuracy (98.7%, 99.0%, and 99.4%, respectively).
4. HK et al. (2020) [4]
LR, SVM,
KNN, NB, RF
Authors used five ml By using LR the output was 92%
models in Cleaveland Heart Disease Dataset.
They parameter-tuned the model to experiment with results
5. Dr. M. Kavitha et.( 2021) [5]
RF DT Hybrid
Model(RF-DT)
They employed data mining techniques including regression and classification in their planned study, which made use of the Cleveland heart disease dataset.
Random Forest and Decision Tree ml
with The best accuracy of 88%
by an employed hybrid model
©Daffodil International University 6 algorithms are used. In
this study, a hybrid model a decision tree, and a random forest model were applied.
6. Nagavelli et al. NB weighted For heart disease XGBoost 95%
(2022)[6] approach prediction used NB with a 2SVM’s and weighted method. The XGBoost second one is automated SVM and DO and analyzes the
XGBoost localization and
identification of ischemic heart disease in accordance with the characteristics of the frequency domain, temporal domain, and information theory.
7. Javeed et al. SVM, NB, LR, Therefore, this work - (2022) [7] RF, Deep Neural focuses on a
Network, of comprehensive evaluation Artificial Neural of automated diagnosis for Network, GA, heart disease prediction
DT based on several
modalities, including pictures, ECGs, and clinical feature-based data modalities. Additionally, this work critically assesses earlier techniques
©Daffodil International University 7 and outlines their
shortcomings.
2.4 Scope of the problem
All the previous work in this area have done on public datasets. After analyzing previous study and research, I took decision to fulfill my research by combining four different datasets to create a new dataset. Then try the results with different models.
2.5 Challenges
This study had several challenges. The first problem was that there was a problem with data collection. Therefore, dummy data were used in this study. For this reason, our model was overfitted to use dummy data, making it very difficult for the model to imply.
I need to use many machine learning algorithms and find out which one performs better. I'm not familiar with all these algorithms, but they should be used for best results. However, after experimenting with different algorithms, the most recent one worked quite well and gave pretty good output.
©Daffodil International University 8
CHAPTER 3
RESEARCH METHODOLOGY
3.1 Introduction
Our proposed methodology is useful for predicting heart disease in humans. HDPS used several machine learning algorithms. Among them, we selected six algorithm for comparing because other models were either overfitting or had problems determining the output. Comparing support vector machines (SVM), Gaussian Naive Bayes (GNB), k-nearest neighbors (KNN), decision trees (DT), logistic regression (LR) and random forest (RF) algorithms to compare algorithms, the results is displayed. Among them, the best results were obtained for each individual research area.
3.2 Research Subject and Instrumentation
The topic we've been working on is related to machine learning. As previously mentioned, we have shown a comparison using multiple machine learning techniques including SVM, DT, GNB, RF, KNN, and RF. We used the dataset and applied these algorithms to HDPS.
3.3 Dataset Description
In this paper, we utilized four publicly available datasets and merged them. After merging the four datasets, we created our new dataset. Our dataset has 14 columns and 1901 rows.
©Daffodil International University 9 Data Statistics
Our dataset statistics are shown below in Table 3.1 with the number of Data and the parameter number that the dataset have,
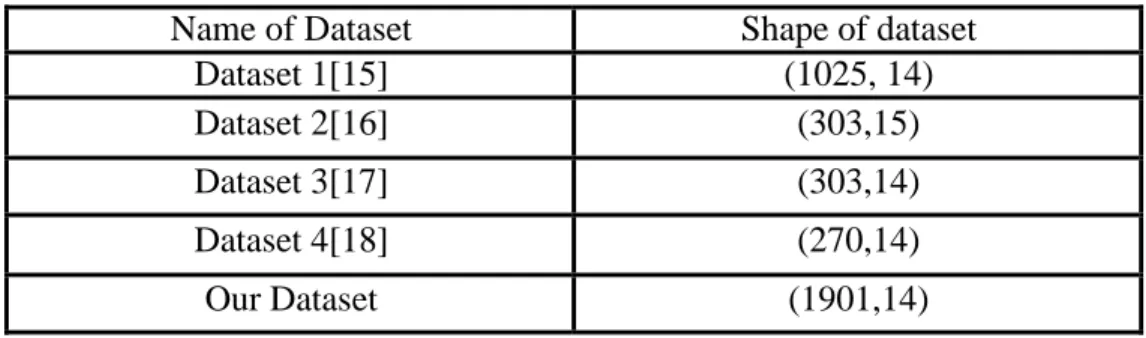
Table 3.1 Data Statistics
Name of Dataset Shape of dataset
Dataset 1[15] (1025, 14)
Dataset 2[16] (303,15)
Dataset 3[17] (303,14)
Dataset 4[18] (270,14)
Our Dataset (1901,14)
Statistical Analysis
In our new dataset we visualize each feature and try to find the relation between them. In figure given below illustrate the statistical analysis of our dataset
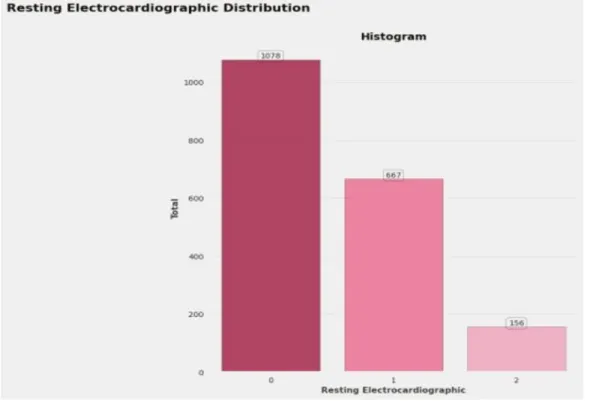
©Daffodil International University 10 Fig 3.1 Resting Electrocardiographic Distribution
Fig 3.1 shows the resting electrocardiographic distribution where the maximum and minimum value are shown in the histogram. Resting echocardiography is a noninvasive test that can assess ventricular function, heart valve anatomy and function, and regional wall motion abnormalities.
©Daffodil International University 11 Fig 3.2 Thal Distribution
In fig 3.2 the visualization of thal distribution are shown as histogram where the value of disease affection possibility are counted from maximum to minimum. Thalassemia is an inherited blood disorder caused when the body does not make enough of a protein called hemoglobin, an important part of red blood cells. Without enough hemoglobin, the body's red blood cells become dysfunctional, have a shorter lifespan, and have fewer healthy red blood cells circulating in the bloodstream.
©Daffodil International University 12 Fig 3.3 Number of Major Vessels Distribution pie chart
In fig 3.3 number of major vessels Distribution shown as pie chart from where we can get the idea of number of vessels as percentage. Here the maximum number of vessels percentage are shown is 57.23% and the lowest is 1.47%. From maximum to minimum the percentage are followed by 21.78%,12.78%,6.73%.
©Daffodil International University 13 Fig 3.4 Chest Pain Type Distribution
In fig 3.4 the distribution of chest pain type are shown by yes or no as pie chart and followed by histogram the most regular causes of chest pain are: Gastrointestinal disorders (42%), coronary artery disease (31%), musculoskeletal disorders (28%), pericarditis (4%), pulmonary embolism (2%). Other irregular common causes are exists.
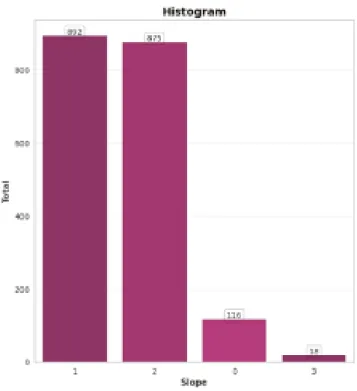
©Daffodil International University 14 Fig 3.5 Slope of the peak Exercise Distribution
In fig 3.5 the slope of peak exercise Distribution are shown which help us to get the proper idea of the heart situation for this we need to get ECG report of a patient.
Fig 3.6 Heart rate
©Daffodil International University 15 In fig 3.6 the heart rate distribution are shown based on scatter plot. the patient with heart diseases tend to have high heart rate.
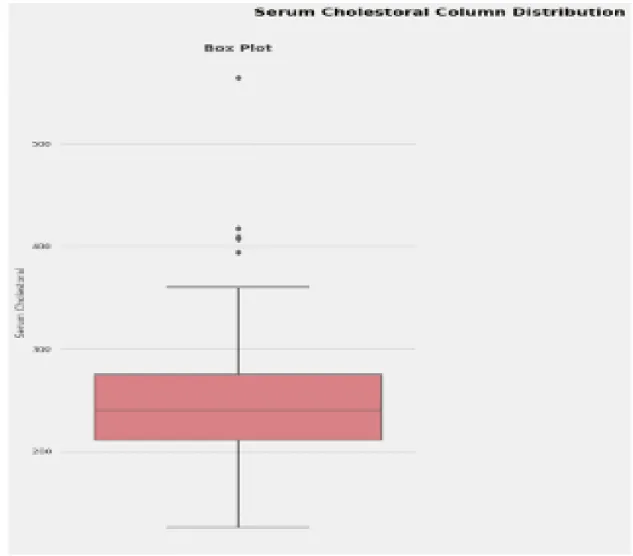
Fig 3.7 serum cholestoral column distribution
In fig 3.7 Serum Cholestoral column distribution are shown.Cholesterol is a type of body fat. A person's serum cholesterol level represents the amount of total cholesterol in the blood.
©Daffodil International University 16 Fig 3.8 gender-based heart diseases distribution
In fig 3.8 gender base heart diseases distribution are shown where we can see the number of affected person between male and female. Here the number of affected female are more than the number male are shown.
3.4 Co-relation Map:
Correlation Maps allow users to compare the similarity (or difference) between samples and glycan binding. Figure 3.9 depicts the correlation
©Daffodil International University 17 Figure 3.9 Correlation Map
Type of Correlation:
From our correlation map we can describe the correlation as below,
Strong Correlation: When the r value of two variables is more than 0.7, it is typically regarded as a strong correlation. The strength of the linear connection among two of the quantitative variables is indicated by the correlation coefficient which is presented by r.
Weak Correlation: If the relative magnitude of r is between 0.25 and 0.5, the correlation among two variables is deemed to be weak.
Positive Correlation: When the correlation coefficient is larger than 0, the correlation between two variables is positive correlation.
Negative Correlation: When the correlation coefficient is less than 0, the correlation between two variables is Negative correlation.
Correlation Map Finding: From figure 3.9 the correlation map of our dataset, we get that our
©Daffodil International University 18 correlation map is Strong positive correlation map because r value is greater 0.7 and it’s larger than 1.
3.5 Data preprocessing
Since we have used prototype data, we need to preprocess the data so that the model can identify well-functioning outputs. To preprocess the data, you need to:
First, I had to do some hot coding. Here, I have coded the features of category into a one-digit array.
This encoded is necessary to pass the categorical data to many sci-kit learning estimators and apply the data sets in linear or other machine learning models.
Then I used the pandas library to remove all unnecessary data. After removing them, split the input and output variable in different column to further train the machine learning algorithm.
Finally, we have to split the dataset into 80% training data and 20% validation data.
3.6 Proposed Methodology
Choosing the best appropriate algorithm to implement can be very tedious. I got pretty bad results when applying the algorithm to the dataset without preprocessing the dataset. For this reason, the dataset must first be preprocessed so that machine learning algorithms can be applied. However, after experimenting with different algorithm and models, we turned to two machine learning algorithm for final comparison. After comparing them, we chose the k nearest neighbors with most accuracy. The steps of the proposed methodology are shown in the figure 3.10 below.
©Daffodil International University 19 Figure 3.10 Work methodology of this paper (Merging the datasets, preprocessing, splitting the dataset, training the dataset with ml applied models and result in analysis)
©Daffodil International University 20 3.7 Machine Learning Algorithms
Logistic Regression (LR)
Logistic regression is statistical technique which we used when the dependent is binary variable. Data and relationships between one or more independent variables and the dependent variable are described as logistic regression. Any nominal, ordinal, or interval type can be used for the independent variable. The results of this study showed good results using LR because whether a patient has heart disease implies a binary result [8].
K-NN Algorithm
The k-nearest neighbor (KNN) classification technique is simple but efficient. Since this is a delayed learning approach, it is not used in many applications.
𝑑(𝑝, 𝑞) = 𝑑(𝑞, 𝑝) = ---( I )
Here we get the n dimensions that are used in machine learning to extract features from datasets. Data points within the small distance are considered as the same class. The given formula works in n dimensions and can be implemented with n features [10]. I have to figure out the length between each point from the test data points. Because there can be many distances. So we testify the closest distance and assume it related to the same class as the closest distance. If the green point is nearest to the test data, then we can predict that the green point most closely resembles the output class.
(𝑞 𝑝 ) + (𝑞 𝑝 ) +... + (𝑞 𝑝 )
1− 1 2− 2 𝑛− 𝑛
©Daffodil International University 21 Support Vector Machine (SVM)
Support vector machines, one of the most popular supervised learning methods, are used to solve classification and regression problems. The goal of the SVM algorithm is to establish optimal lines or decision boundaries that can divide an n-dimensional space into classes. This will allow us to classify new data points in the future as soon as possible. Hyperplane is the name of this optimal decision of boundary. Support vector machines chooses extreme vectors and points to help create hyperplanes. The support vectors used to represent these extreme cases form the basis of the SVM method [11].
Gaussian Naive Bayes (GNB)
Bayes' theorem is the basis of naive Bayesian classifiers, one of which is the strong assumption of independence between features. A simple Bayesian classifier requires a modest amount of training data to estimate the classification parameters. Naive Bayes classifiers are easy to create and use, and can be used in a wide variety of real-world scenarios. Gaussian Naive Bayes is a variant of Naive Bayes that handles continuous data and follows a Gaussian distribution. When we were working with continuous data, it is often assumed that the continuous values are attached with each class are distributed according to a normal or Gaussian distribution. Gaussian Naive Bayes is a variant of Naive Bayes that follows a Gaussian distribution and works with continuous data. When working with continuous data, it is common to assume that the continuous values in each class are distributed according to a normal (or Gaussian) distribution. Simple Bayesian classifiers are based on Bayes' theorem and are supported by a number of strong feature-independent assumptions [12].
Decision Tree (DT)
Classification and regression problems can be resolved using the supervised learning technique known as a decision tree, however this approach is frequently preferred. It is a tree-structured classifier, where each leaf node represents the classification outcome and internal codes represent the attributes of a dataset, decision-making branches and decision making process[13]. The two nodes in a decision tree are the decision node and leaf node. Decision Nodes are used to make decisions and have many branches, whereas leaf nodes are the outcomes of decisions and do not have any more branches.
©Daffodil International University 22 Random Forest (RF)
A machine learning method that uses multiple decision trees to make decisions is called a random forest. The class with the most votes becomes the model's prediction. Every tree in the random forest spits out class predictions. Best results are obtained when a large number of highly uncorrelated models (trees) work together as a committee [14].
In many research contexts, random forest classification machine learning techniques are used to build predictive models. Reducing the number of variables required to generate predictions is a common goal of predictive modeling to decrease the cost of data collection and increase its effectiveness.
3.8 Implementation Requirements
After studying and analyzing all the nrequired statistical or theoretical concepts and methods, we have created a list of hardware, software, and development tools required for HDPS.
Hardware and Software Requirements
● Operating System ( Windows 7 or above)
● Ram ( more than 4 GB prefered )
● Web Browser (preferably chrome)
Developing Tools
● python 3.7
● Google COLAB
● NLTK
● Pandas
● Sklearn
©Daffodil International University 23
CHAPTER 4
EXPERIMENTAL RESULTS AND DISCUSSION
4.1 Introduction
In this chapter, we describe our research and finally present our experimental results. Finish the chapter with a summary of the results.
4.2 Experimental Result
Four different parameters are used to evaluate the performance of the ML method: Recall, F1- Measure, Precision and Accuracy. The confusion matrix of the model is used to measure the likelihood of four parameters: Fn (false negative), Tn (true negative), Fp (false positive), and Tp (true positive). The set of subjects correctly defined as "positive" (presence or absence of heart disease) is denoted by Tp, and the set of subjects correctly classified as "negative" (absence of heart disease/healthy) is denoted by Tn. Similarly, the set of subjects falsely classified as 'negative' (if they have heart disease) is presented as Fn, and the set of subjects falsely classified as 'positive' when they do not have heart disease is denoted by Fn is presented as as Fp.
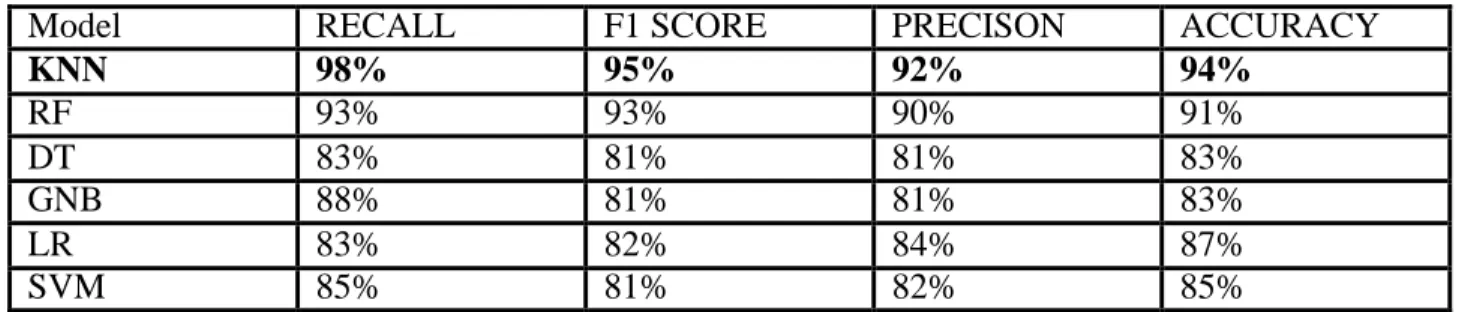
On our dataset, we applied six different models (ANN, RF, DT, GNB, LR, and SVM) to evaluate model performance. Among them, KNN gives the highest accuracy on the data set, GNB, DT model gives 83° accuracy. The second lowest accuracy is given by the SVM model. The RF model works well with an accuracy of 91.0 and LR shows an accuracy of 87.0.
Table 4.1 Experimental Result
Model RECALL F1 SCORE PRECISON ACCURACY
KNN 98% 95% 92% 94%
RF 93% 93% 90% 91%
DT 83% 81% 81% 83%
GNB 88% 81% 81% 83%
LR 83% 82% 84% 87%
SVM 85% 81% 82% 85%
©Daffodil International University 24 Table 4.1 illustrate that KNN gives the best performance. The confusion matrix of this model is given below figure-4.1 .
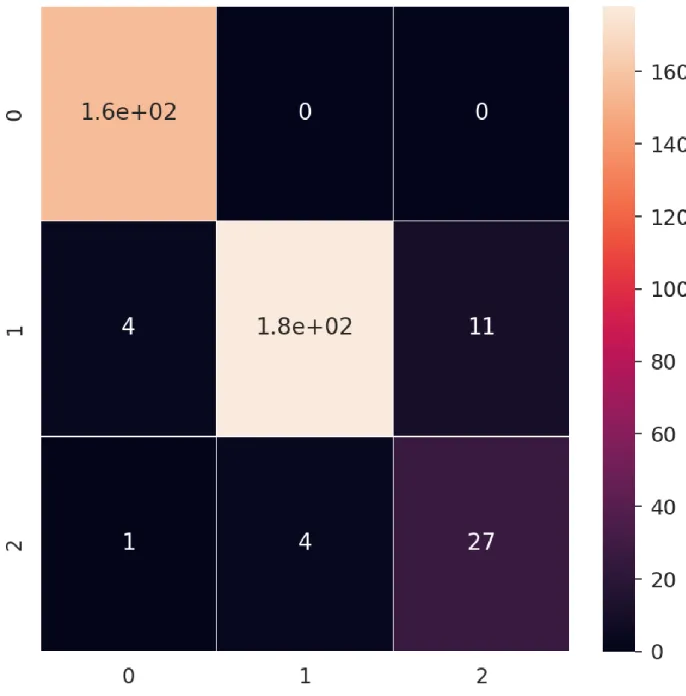
4.3 Confusion Matrix
A table called a confusion matrix which is used to describe how well a classification system performs. The output of a classification algorithm is shown and summarized in a confusion matrix.
Figure 4.1 displays a confusion matrix where the patient is referred to be healthy and the heart disease patients.
Figure 4.1 Confusion Matrix of KNN model on our dataset
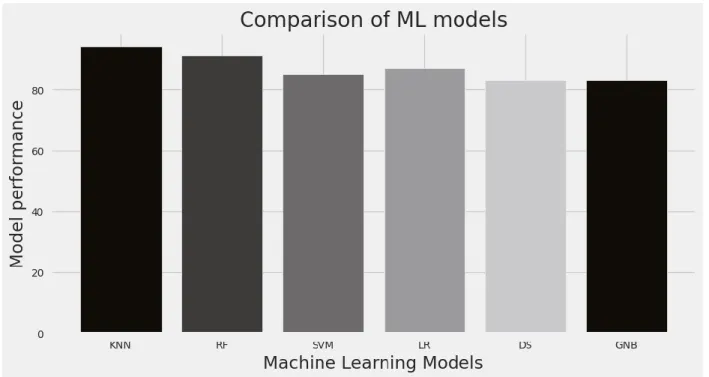
©Daffodil International University 25 4.4 Comparison
We employed six different models KNN, RF, DT, GNB, LR, and SVM. Among them, KNN gives the best accuracy for our dataset. The recall, F1 score, precision, and accuracy of the KNN model performance are higher than the rest of the model’s performance.
Figure 4.2:Comparison of ML Models
From the comparison of ML models in fig 4.2 we can see the best accuracy is given by the algorithm k-nearest neighbour followed by random forest algorithm and SVM in third position.
©Daffodil International University 26
CHAPTER 5
CONCLUSION AND FUTURE SCOPE 5.1 Conclusion
In this paper, we merged the four datasets and applied ml models to evaluate their performance.
Preprocess the data before fitting the model and achieved a good outcome. Heart disease is an alarming topic in Bangladesh. Not only in Bangladesh it has a huge impact all over the world and day by day it is increasing. To stop and prevent this issue an early stage prediction is very useful and affected person can take precautionary step to get cured from the diseases. HDPS system can help people in the initial stage. People can be aware of the disease and take proper steps. Our paper would be the first step to fighting this disease and stopping deaths. we are hoping that from our study we can give some valuable effort to the prediction of heart disease so that the patient can take necessary precaution to get treatment and proper guideline to get healthy back again. In conclusion, our research study will help medical science and patient through getting some early stage measurement and it will help patient to get early consultation from an expert doctor.
5.2 Future Scope
We have used available data from virtual dataset in this study and got the result according the virtually available data from dataset that we have collected from Kaggle dataset. we also used the dataset from UCI repository. In future, we will collect real life data from different aspect and we will implement some more algorithm in our study to get more effective and accurate result. Real life data will be helpful to get more effective result in our study as real life data is taken from a persons body test.so real life data collection and more algorithm apply will help us to get best effective data possible which is why we will work on real life data ahead and apply on some more algorithm available out there.
©Daffodil International University 27 REFERENCES
[1] Repaka AN, Ravikanti SD, Franklin RG. Design and implementing heart disease prediction using naives Bayesian. In2019 3rd International conference on trend in electronics and informatics (ICOEI) 2019 Apr 23 (pp. 292-297). IEEE.
[2] Rajdhan A, Agarwal A, Sai M, Ravi D, Ghuli P. Heart disease prediction using machine learning. International Journal of Research and Technology. 2020 Apr;9(04):659-62.
[3] Gárate-Escamila AK, El Hassani AH, Andrès E. Classification models for heart disease prediction using feature selection and PCA. Informatics in Medicine Unlocked. 2020 Jan 1;19:100330.
[4] Thakkar HK, Shukla H, Patil S. A comparative analysis of machine learning classifiers for robust heart disease prediction. In2020 IEEE 17th India Council International Conference (INDICON) 2020 Dec 10 (pp. 1-6). IEEE.
[5] M. Kavitha, G. Gnaneswar, R. Dinesh, Y. R. Sai and R. S. Suraj, "Heart Disease Prediction using Hybrid machine Learning Model," 2021 6th International Conference on Inventive Computation Technologies (ICICT), 2021, pp. 1329-1333, doi:
10.1109/ICICT50816.2021.9358597.
[6] Nagavelli U, Samanta D, Chakraborty P. Machine Learning Technology-Based Heart Disease Detection Models. Journal of Healthcare Engineering. 2022 Feb 27;2022.
[7] Javeed A, Khan SU, Ali L, Ali S, Imrana Y, Rahman A. Machine learning-based automated diagnostic systems developed for heart failure prediction using different types of data modalities: a systematic review and future directions. Computational and Mathematical Methods in Medicine. 2022 Feb 3;2022.
[8] Aljanabi M, Qutqut MH, Hijjawi M. Machine learning classification techniques for heart disease prediction: a review. International Journal of Engineering & Technology.
2018;7(4):5373-9.
[9] Nick TG, Campbell KM. Logistic regression. Topics in biostatistics. 2007:273-301.
[10] Guo G, Wang H, Bell D, Bi Y, Greer K. KNN model-based approach in classification. InOTM Confederated International Conferences" On the Move to Meaningful Internet Systems" 2003 Nov 3 (pp. 986-996). Springer, Berlin, Heidelberg.
[11] Huang S, Cai N, Pacheco PP, Narrandes S, Wang Y, Xu W. Applications of support vector machine (SVM) learning in cancer genomics. Cancer genomics & proteomics. 2018 Jan 1;15(1):41-51.
[12] A. H. Jahromi and M. Taheri, "A non-parametric mixture of Gaussian naive Bayes classifiers based on local independent features," 2017 Artificial Intelligence and Signal
©Daffodil International University 28 Processing Conference (AISP), 2017, pp. 209-212, doi: 10.1109/AISP.2017.8324083.
[13] Myles AJ, Feudale RN, Liu Y, Woody NA, Brown SD. An introduction to decision tree modeling. Journal of Chemometrics: A Journal of the Chemometrics Society. 2004 Jun;18(6):275-85.
[14] Speiser JL, Miller ME, Tooze J, Ip E. A comparison of random forest variable selection methods for classification prediction modeling. Expert systems with applications. 2019 Nov 15;134:93-101.
[15] https://www.kaggle.com/datasets/johnsmith88/heart-disease-dataset
[16] https://www.kaggle.com/datasets/sumaiyatasmeem/heart-disease-classification-dataset
[17] https://www.kaggle.com/datasets/yasserh/heart-disease-dataset/discussion/313597?select=heart.csv [18] https://www.kaggle.com/datasets/shivarajmishra/heart-data
©Daffodil International University 29