A DATA MINING APPROACH FOR GENETIC DIABETES PREDICTION BY
SUSHANTA SEN ID: 161-15-7585 PRIYANJALI DAS
ID: 161-15-7493 AND BIJAY DEBNATH
ID: 161-15-7555
This Report Presented in Partial Fulfillment of the Requirements for the Degree of Bachelor of Science in Computer Science and Engineering.
Supervised By
Professor Dr. Md. Ismail Jabiullah Professor
Department of CSE
Daffodil International University
DAFFODIL INTERNATIONAL UNIVERSITY
DHAKA, BANGLADESH DECEMBER 2019
i
©Daffodil International University
ii
©Daffodil International University
DECLARATION
We hereby declare that, this project has been done by us under the supervision of Professor Dr. Md. Ismail Jabiullah, Professor, Department of CSE, Daffodil International University. We also declare that neither this project nor any part of this project has been submitted elsewhere for award of any degree or diploma.
iii
©Daffodil International University
ACKNOWLEDGEMENT
First we express our heartiest thanks and gratefulness to almighty God for His divine blessing makes us possible to complete the final year research project successfully.
We really grateful and wish our profound our indebtedness to Professor Dr. Md. Ismail Jabiullah, Professor, Department of CSE Daffodil International University, Dhaka.
Deep Knowledge & keen interest of our supervisor in the field of “Data mining” to carry out this project. His endless patience ,scholarly guidance ,continual encouragement , constant and energetic supervision, constructive criticism , valuable advice ,reading many inferior draft and correcting them at all stage have made it possible to complete this project.
We would like to thank our entire course mate in Daffodil International University, who took part in this discuss while completing the course work.
Finally, we must acknowledge with due respect the constant support and patience of our parents.
iv
©Daffodil International University
ABSTRACT
Diabetes is one of the major cause of death in recent decades which occur at any age.
Diabetes is a disease that occurs when your blood glucose, also called blood sugar, is out of range. There are many reasons for occurring diabetes like lifestyle problem, other diseases, medicine, pregnancy, genetic problem etc. We have worked here with genetic diabetes and done a data mining approach for predicting diabetes. Data mining tools proves successful result in case of diseases diagnosis. There are different data mining techniques available like Tracking patterns, Classification, Association, Outlier detection, Clustering, Regression, Prediction. We work here with prediction technique to make a data mining approach for the diabetes patient which occurred genetically. This prediction is done across different ranges of age men and women who have diabetes. In the dataset if his/her parents or grandparents have diabetes, he/she has treated as genetic diabetes patient. We also do the prediction of gender wise diabetes patients who take insulin. Then also predict the insulin taking diabetes patients for different ranges of age man and woman. This research will open a new platform to research. The limitation of the research is where diabetes create for other disease or other unusual activities, there the proposed system can’t be applicable. But the research can be used for giving more awareness on genetic diabetes and giving a new prediction which can be used in medical field.
v
©Daffodil International University
TABLE OF CONTENTS
CONTENTS PAGE
Board of examiners i
Declaration ii
Acknowledgements iii
Abstract iv
CHAPTER
CHAPTER 1: INTRODUCTION 1-7
1.1 Introduction 1
1.2 Motivation
1.3 Rationale of the Study 1.4 Research Questions
1.5 Expected Output 1.6 Report Layout
CHAPTER 2: BACKGROUND
2.1 Introduction 2.2 Related Works 2.3 Research Summary 2.4 Scope of the Problem 2.5 Challenges
3 3 5 5 6
8-11
8 9 10 11 11
vi
©Daffodil International University
CHAPTER 3: RESEARCH METHODOLOGY
3.1 Introduction
3.2 Research Subject and Instruments 3.3 Data Collection Process
3.4 Implementation Requirements
CHAPTER 4: EXPERIMENTAL RESULTS AND DISCUSSION
4.1 Introduction
4.2 Experimental Results 4.3 Descriptive Analysis 4.4 Summary
CHAPTER 5: SUMMARY, CONCLUSION,
RECOMMENDATION AND IMPLICATION FOR FUTURE RESEARCH
5.1 Summary of the Study 5.2 Conclusions
5.3 Recommendations
5.4 Implication for Further Study
12-14
12 12 12 13
15-30
15 15 30 30
31-32
31 31 31 32
REFERENCES 33
APPENDIX 34-39
vii
©Daffodil International University
LIST OF FIGURES
FIGURES PAGE NO
Figure 4.1: Clustering the Training Data Set for 3 Attributes for Getting the Final Decision
16
Figure 4.2: Decision Tree for the Final Decision 17
Figure 4.3: Genetic Diabetes Prediction for Different Gender 18 Figure 4.4: Genetic Diabetes Prediction for Different Ranges of Age Male 20 Figure 4.5: Genetic Diabetes Prediction for Different Ranges of Age
Female
22
Figure 4.6: Take Insulin Prediction for Different Gender 24 Figure 4.7: Take Insulin Prediction for Different Ranges of Age Male 26 Figure 4.8: Take Insulin Prediction for Different Ranges of Age Female 28
viii
©Daffodil International University
LIST OF TABLES
TABLES PAGE NO
Table 4.1: Prediction Result of Genetic Diabetes for Different Gender with the Inputs
19
Table 4.2: Prediction Result of Genetic Diabetes for Different Ranges of Age Male with the Inputs
21
Table 4.3: Prediction Result of Genetic Diabetes for Different Ranges of Age Female with the Inputs
23
Table 4.4: Prediction Result of Take Insulin Patient for Different Gender with the Inputs
25
Table 4.5: Prediction Result of Take Insulin Patient for Different Ranges of Age Male with the Inputs
27
Table 4.6: Prediction Result of Take Insulin Patient for Different Ranges of Age Female with the Inputs
29
1
©Daffodil International University
INTRODUCTION 1.1 Introduction:
Diabetes is a chronic disease that occurs when the pancreas is no longer able to make insulin, or when the body cannot make good use of the insulin it produces. Diabetes is one of the major cause of death in Bangladesh. Because every year a lot of people affected by diabetes and die because of it. Diabetes occurs either when the pancreas does not produce enough insulin (a hormone that regulates blood sugar, or glucose) or when the body cannot effectively use the insulin it produces. Unhealthy food habits, obesity, physical inactivity, genetic and environmental factors are responsible for diabetes, Diabetes also damages heart and blood vessels, eyes, kidneys, nerves, Gastrointestinal tract and Gums and teeth also.
From a document we can know that, Some 80 lakh people in Bangladesh suffer from diabetes. It causes 6.4 percent of total deaths in the country. A survey by the Bangabandhu Sheikh Mujib Medical University (BSMMU) on 2,000 adults in Dhaka slums in 2016 found 19 percent adults (15.6 percent men and 22.5 percent women) had diabetes.
There are many causes for diabetes. Underweight babies have a high risk of diabetes, which is very relevant to Bangladesh At least 22.6 percent babies in Bangladesh are born with low birth weight (below 2.5kg), according to the National Low Birth Weight Survey Bangladesh 2015. Unplanned urbanisation in the cities is another major factor in Bangladesh where people have very limited scope for physical activities. In addition, people are eating fast food such as burgers and pizzas and consuming soft drinks that have high levels of sugar and fat.
2
©Daffodil International University The three main types of diabetes are:
type 1 diabetes
type 2 diabetes
gestational diabetes.
In this research, we are working with diabetes which is caused genetically. Among 3 types of diabetes, in most cases type 2 diabetes is occurs by gene mutation. Numerous mutations have been shown to affect type 2 diabetes risk. The contribution of each gene is generally small. However, each additional mutation you have seems to increase your risk. In general, mutations in any gene involved in controlling glucose levels can increase your risk of type 2 diabetes. (If you’ve been diagnosed with type 2 diabetes, there’s a good chance that you’re not the first person with diabetes in your family. You’re more likely to develop the condition if a parent or sibling has it. Several gene mutations have been linked to the development of type 2 diabetes. These gene mutations can interact with the environment and each other to further increase your risk.)
Scientists have linked several gene mutations to a higher diabetes risk. Not everyone who carries a mutation will get diabetes. However, many people with diabetes do have one or more of these mutations. It can be difficult to separate genetic risk from environmental risk. The latter is often influenced by your family members. For example, parents with healthy eating habits are likely to pass them on to the next generation. On the other hand, genetics plays a big part in determining weight. Sometimes behaviors can’t take all the blame.
Data Mining is the process of discovering interesting knowledge, such as patterns, associations, changes, anomalies and significant structures, from large amounts of data stored in databases, data warehouses, or other information repositories. Due to the wide availability of huge amounts of data in electronic forms, and the imminent need for turning such data into useful information and knowledge for broad applications including
3
©Daffodil International University
Market analysis, business management, and decision support, data mining has attracted a great deal of attention in information industry in recent years.
Data mining is useful for predicting diseases. Affected person’s history, Hospitals, clinical devices and electronic facts offer a lot of records concerning a selected disease.
Those datasets are used for extracting useful information by which we are able to take choices and generate rules.
1.2 Motivation:
As our research work is about diabetes which caused genetically so we think it will be a remarkable work in research field. From this research paper, we can know that if anybody is affected with diabetes, what is the form of his/her diabetes? , Is it genetic or it is caused by anyone lifestyle, eating habit, fattiness, smoking or for any other reason? From this research paper we can aware people that if they have diabetes in his/her family members they should be careful. Because in many cases diabetes is happened genetically. So everybody should be careful and should check-up diabetes test regularly. And also they should avoid junk food, smoking and should exercise regularly which helps them to be free from the risk of diabetes.
1.3 Rationale of the Study:
Diabetes of all types can lead to complications in many parts of the body and increase the risk of dying prematurely. In 2012 diabetes was the direct cause of 1.5 million deaths globally. In April 2016, WHO published the Global report on diabetes, which calls for action to reduce exposure to the known risk factors for type 2 diabetes and to improve access to and quality of care for people with all forms of diabetes. About 422 million people worldwide have diabetes.
1. The prevalence of diabetes has been steadily increasing for the past 3 decades, mirroring an increasing in the prevalence of obesity and overweight people. The prevalence of diabetes is growing most rapidly in low and middle-income countries.
4
©Daffodil International University
2. Diabetes is one of the leading causes of death in the world.
In 2012 diabetes was the direct cause of 1.5 million deaths. An additional 2.2 million deaths were caused in the same year by higher than optimal levels of blood glucose, through an increased risk of diabetes.
3. People with diabetes can live long and healthy lives when their diabetes is detected and well managed.
4. Early diagnosis and intervention is the starting point for living well with diabetes.
The longer a person lives with undiagnosed and untreated diabetes, the worse their health outcomes are likely to be. Basic technologies such as blood glucose measurement should be readily available in primary health-care settings.
5. Diabetes is an important cause of blindness, amputation and kidney failure.
Diabetes of all types can lead to complications in many parts of the body and increase the overall risk of dying prematurely. Possible complications include heart-attack, stroke, kidney failure, leg amputation (because of infected, non-healing foot ulcers) vision loss and nerve damage.
6. Family history also plays a role in diabetes risk.
If a parent or sibling has type 2 diabetes, we should predisposed to developing pre- diabetes and type 2 diabetes. Lifestyle habits explain some of these incidences, since family members may share similar diets and exercise habits. Genetics also plays a role, but just because one close relative has diabetes does not mean you are destined to.
Research conducted on identical twins, which share identical genes, showed that the pairs have discordant risk. Among twins, which one has type 1 diabetes, the other has only a 50 percent chance of developing it; for type 2, the risk for the second twin is 75 percent at most.
5
©Daffodil International University
1.4 Research Questions:
Some research questions which was on our mind help us to develop our research. Those research questions are:
1. Does the research has any practical value?
2. Can we make people aware about genetic diabetes?
3. How to collect data from patients?
4. How to analysis the data?
5. Do the analyses are appropriate or not?
1.5 Expected Output:
In this research project we expect many output result. Those expected output results are:
1. First we expect the output result of clustering for our final decision genetic diabetes.
Where we will find the group of subset for occurring genetic diabetes for some different inputs of different attribute.
2. Secondly we will try to find the decision tree for occur genetic diabetes. Where we can see the flow diagram of genetic diabetes occurring process. This will give the basic idea of the research project.
3. In the third step our expected output is to predict the genetic diabetes of different gender. Where we give the total number of diabetes patient for different gender and from those patients we will give the total number of genetic diabetes patients. Then we will run an algorithm to find the prediction of genetic diabetes from different gender diabetes patients.
4. In the fourth step our expected output is to predict the genetic diabetes of different range of age male diabetes patients. Where we will give the total number of diabetes
6
©Daffodil International University
patients for different range of age male diabetes patients and from those patients we will give the total number of genetic diabetes patients. Then we will run an algorithm to find the prediction of genetic diabetes from different range of age male diabetes patients.
5. In the fifth step our expected output is to predict the genetic diabetes of different range of age female diabetes patients. Where we will give the total number of diabetes patients for different range of age female diabetes patients and from those patients we will give the total number of genetic diabetes patients. Then we will run an algorithm to find the prediction of genetic diabetes from different range of age female diabetes patients.
6. In the sixth and the last step our expected output is to predict the take insulin patients from different gender diabetes patients. Where we give the total number of diabetes patients for different gender and from those patients we will give the total number of take insulin diabetes patients. Then we will run an algorithm to find the prediction of take insulin diabetes patients from different gender diabetes patients.
1.6 Report Layout:
In our report firstly we give a cover page with our title, supervisor name, and our group member name. Then we give the acknowledgement, abstract, list of contents, list of figures, list of table. Finally we started to write 5 different chapter.
In chapter 1(Introduction) we write the introduction, motivation, rationale of the study, research questions, expected output and expected layout of this research project.
In chapter 2(Background) we write the introduction, related works, research summary, scope of the problem and challenges of this research project.
In chapter 3(Research Methodology) we write the introduction, research subject and instrumentation, data collection process and implementation requirements of this research project.
7
©Daffodil International University
In chapter 4(Experimental Results and Discussion) we write the introduction, experimental results, descriptive analysis and summary of this research project.
In chapter 5(Summary, Conclusion, Recommendation and Implication for Further Research) we write the summary of the study, conclusions, recommendations and implication for further study of this research project.
Then after completing write the chapters we give the appendices and references for getting help to write the report.
8
©Daffodil International University
CHAPTER 2 BACKGROUND 2.1 Introduction:
Diabetes is a complex condition with several types and no clear cause. If there is a history of a type of diabetes in a person's family, they may have a higher risk of developing the same condition. Genetic factors can make some people more vulnerable to some types of diabetes. However, a person may not inherit the condition, and there may be ways to reduce the risk.
Type 1 diabetes is an autoimmune disease. In the past, doctors believed that type 1 diabetes was wholly genetic. However, not everyone with type 1 diabetes has a family history of it.
As with type 1 diabetes, people with type 2 often have a close family member with the condition. However, while genetic factors may play a role, experts believe that lifestyle factors, including diet and exercise, have the most significant impact.
There is still no cure for diabetes, but newer drugs and an awareness of possible causes have further improved the outlook for people with this condition.
Type 2 diabetes is a disorder characterized by abnormally high blood sugar levels. In this form of diabetes, the body stops using and making insulin properly. Insulin is a hormone produced in the pancreas that helps regulate blood sugar levels. Specifically, insulin controls how much glucose (a type of sugar) is passed from the blood into cells, where it is used as an energy source. When blood sugar levels are high (such as after a meal), the pancreas releases insulin to move the excess glucose into cells, which reduces the amount of glucose in the blood.
9
©Daffodil International University
Type 2 diabetes can occur at any age, but it most commonly begins in middle age or later.
Signs and symptoms develop slowly over years. They include frequent urination (polyuria), excessive thirst (polydipsia), fatigue, blurred vision, tingling or loss of feeling in the hands and feet (diabetic neuropathy), sores that do not heal well, and weight loss. If blood sugar levels are not controlled through medication or diet, type 2 diabetes can cause long-lasting (chronic) health problems including heart disease and stroke; nerve damage; and damage to the kidneys, eyes, and other parts of the body.
Type 2 diabetes does not have a clear pattern of inheritance, although many affected individuals have at least one close family member, such as a parent or sibling, with the disease. The risk of developing type 2 diabetes increases with the number of affected family members. The increased risk is likely due in part to shared genetic factors, but it is also related to lifestyle influences (such as eating and exercise habits) that are shared by members of a family.
2.2 Related Works:
The research paper which title is “Application of data mining: Diabetes health care in young and old patients”, published on the journal of King Suad University is related with our research in some ways. The research based on predictive analysis of diabetic
treatment using a regression-based data mining technique. The Oracle data miner was employed as a software mining tool for predicting modes of treating diabetes. The support vector machine algorithm was used for analysis of the experiment. The dataset was studied and analyzed to identify effectiveness of different treatment types for different age groups of data. [11]
Our research based on prediction analysis of genetic diabetes using simple linear regression for prediction. The Weka software in data mining helps us to generate the actual output prediction. We use simple k-mean algorithm for clustering the data set and
10
©Daffodil International University
use j48 algorithm for generating the decision tree. We use nine attribute in data set and from them we take three attribute for clustering. At last we get desired prediction about genetic diabetes.
The research paper which title is “Performance Analysis of Data Mining Classification Techniques to Predict Diabetes”, published on Procedia Computer Science 2016 is also related with our research in some ways. In this paper, they discussed about Diabetes Mellitus with the different group of ages which is somehow related with our research.
Their study follows the adaboost and bagging ensemble techniques using J48 decision tree as a base learner along with standalone data mining technique J48 to classify patients with diabetes mellitus using diabetes risk factors. They do the classification across three different ordinal adults groups in Canadian Primary Care Sentinel Surveillance network.
Experimental result shows that, overall performance of adaboost ensemble method is better than bagging as well as standalone J48 decision tree. [12]
2.3 Research Summary:
This research is based on diabetes which is caused genetically. This research is made by based on one hundred man and one hundred women. Here, at first we notice the age of the diabetes affected people and try to found if their parents and grandparents have diabetes or not. If any parents or grandparents are diabetes affected, we considered the victim as genetically diabetes affected. And we note the whole process in a data sheet. In this way, we make two hundred data sheet and take input from this data sheet and make a final data sheet where, there are nine column and two hundred rows. There are nine attribute such as no, name, age, gender, diabetes, take insulin, anyone from parents, anyone from grandparents, final decision are included in the dataset. There are two hundred rows because we take data from two hundred people.
After that, we use data mining software to preprocess the dataset and applied different algorithm like clustering, decision tree, and counted different types of prediction such as
11
©Daffodil International University
gender wise genetic diabetes prediction, Age wise diabetes prediction for male and female, Gender wise take insulin prediction.
2.4 Scope of the Problem:
There are some scope of the research. Those scopes are:
1. In this research we discuss about diabetes which is caused for gene mutation. We think it’s unique and so it will open a new platform to experiment.
2. This prediction will give a better knowledge in medical science.
3. As this research gives us a better prediction idea about genetics diabetes, people will aware about genetic diabetes after knowing about this research.
2.5 Challenges:
We have to face some challenges to develop our research. Those challenges are:
1. Nobody want to give their actual or official data without references.
2. Data collection process is very hard.
3. Everybody do not know that if his / her grandparents have diabetes or not. So it is difficult to collect data which are related to their grandparents.
4. Since many people do not know about their grandparent information, so we can’t take their data in our research. As a result, we have to find out the people who know the information about their grandparents. So it was very painful for us to find out this type of people.
12
©Daffodil International University
CHAPTER 3
RESEARCH METHODOLOGY 3.1 Introduction:
Diabetes is the most common endocrine diseases all over the year. It has become the leading cause of death in recent decade. In our research, we concentrate on genetic diabetes. Here in the research we are trying to find out that if a person are affected with diabetes, how many possibilities of it to be genetic or caused by another environmental factor. And to get the accurate result, we use data mining technology. Because data mining helps to extract useful data from larger amount of data by using different algorithms. Here we makes a prediction analysis which helps to understand the possibility of genetic or non-genetic diabetes among affected people. For getting actual prediction, at first we collect data from 200 diabetes affected people and by using clustering method, we make a set of group data. After that, we classify the data set and got prediction analysis. We also find the decision tree for genetic diabetes.
3.2 Research Subject and Instrumentation:
Research subject is Genetic Diabetes prediction with data mining.
There are some software and hardware instruments used to develop the research. Those instruments are:
Software: Weka Explorer, Microsoft Excel Worksheet.
Hardware: Laptop, mouse, key-board.
3.3 Data Collection Procedure:
The data collection procedures are given below:
13
©Daffodil International University
Data Collection Form: At first, we make a form to collect data from diabetes affected patients.
Field Work: Then we try to collect data by this form. We collect data in two ways from the patients.
1. From hospital: We visit different hospitals to collect data. Which data we collect from the hospitals is not well enough for our research. As a result, we take decision to collect data from our hometown.
2. From hometown: The data we collect from hometown was very useful for our research. Because from there we could collect the data which was required for us.
3.4 Implementation Requirements:
The implementation requirements for this research are given below:
1. Microsoft Excel Worksheet: In the Microsoft excel worksheet we do the data entry according to our collected data and make a data sheet. In the data sheet we give the data for different attributes in the columns. Then from this data sheet, we make some testing data sheets in Microsoft excel for testing different results. Then we convert all the data sheets in Microsoft Excel Comma Separated Values file (.csv) for implementing the result in Weka software.
2. Weka: Weka is a software which is used for different machine learning algorithms for the Data Mining works. In this software, there are many data mining tools for data preparation, classification, regression, clustering, association and visualization. Weka is powerful enough to provide us the facility for implementing more than one classification algorithm only for a single model. In that case we have to use weka for getting the expected results for the data sets. At first we preprocessed the .csv data sheets for getting the testing results. Also .arrf file can be used for this but here we use .csv file. Then we remove the attributes which are not required for testing the algorithms. Finally we use different algorithms for getting different results for the data sheets.
14
©Daffodil International University The advantages of using Weka:
1. More reliable.
2. More sophisticated. (Cross fold validation set or test set)
3. The classification problem have their own drawbacks but this are limited.
15
©Daffodil International University
CHAPTER 4
EXPERIMENTAL RESULTS AND DISCUSSION 4.1 Introduction
In this research project, our main goal is to find the prediction of genetic diabetes for men and women, different ranges of age men and women. But we have done some extra work too. We also find the prediction of take insulin diabetes patient for men and women, different ranges of age men and women. For more clearance of the project we also find out the decision tree. By which anyone can understand the decision parameter of genetic diabetes. Here a clustering also find out for taking decision, where group of data are separated for the final decision and can be easily find out the final decision occur for different input. The algorithms are used here are Simple K Means for clustering, J48 for the decision tree and the Simple Linear Regression algorithm to find out the predictions.
Here we used Microsoft excel worksheet and weka software to do the research project.
4.2 Experimental Results Step 1:
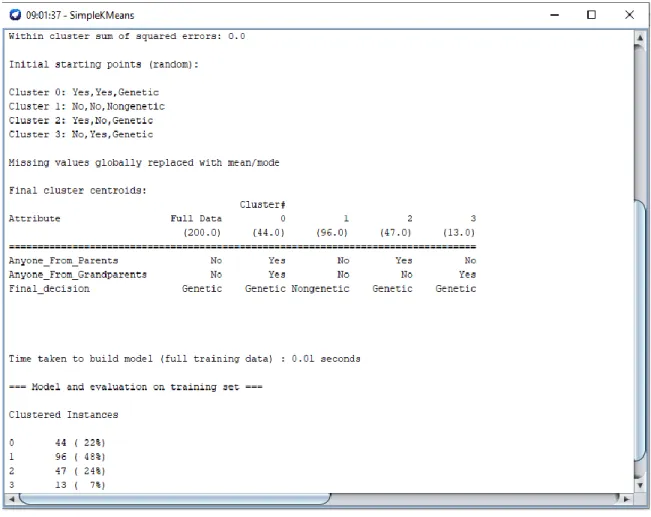
For doing the research project firstly we experiment the training data set by clustering using Simple K Means algorithm. Where three different types of attributes are used for clustering. By which the final decision presented for the combination of different attributes. Figure 4.1 shows the output screenshot of the clustering. Here we can see that in the 0 number clustering the final decision genetic diabetes occur 44 times for the input Yes and Yes. In the 1 number clustering the final decision non-genetic diabetes occur 96 times for the input No and No. In the 2 number clustering the final decision genetic diabetes occur 47 times for the input Yes and No. In the 3 number clustering the final decision genetic diabetes occur 13 times for the input No and Yes. Here the first input is for diabetes of parents and the second input is for diabetes of grandparents. If anyone
16
©Daffodil International University
from parents and grandparents have diabetes, we give input Yes and if don’t have diabetes we give input No.
Figure 4.1: Clustering the Training Data Set for 3 Attributes for Getting the Final Decision
Step 2:
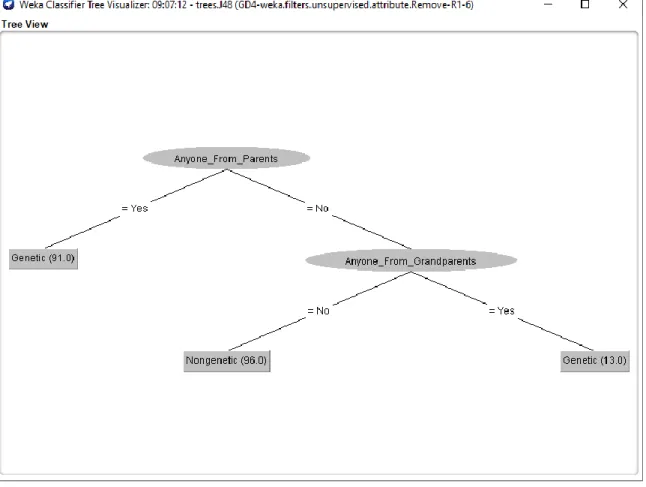
In the step 2 of the experimented result we use J48 algorithm to find out the decision tree.
In the tree we can find the decision of occurring genetic and non-genetic diabetes for different result. Figure 4.2 shows the output result screenshot of decision tree. The decision tree shows that if any one input is Yes then the final decision is genetic diabetes.
But if all inputs are No then the final decision is Non-genetic diabetes. This decision tree
17
©Daffodil International University
will give the basic knowledge of the research. So the tree is very important in this research.
Figure 4.2: Decision Tree for the Final Decision
Step 3:
In the step 3 our prediction is started. Firstly we predict the final decision genetic diabetes occur for different gender. Figure 4.3 shows the output result screenshot of the prediction.
The prediction is done by the Simple Linear Regression algorithm. This algorithm is basically used for predict something. Two numeric attributes diabetes and genetic diabetes are used for do the prediction. In diabetes attribute we give the total number of diabetes patients of different gender. In genetic diabetes attribute we give the total
18
©Daffodil International University
number of genetic diabetes patients. Then we run the algorithm selecting genetic diabetes as a class. Then the result is published by calculating between the two attributes with their numbers. Two errors also shows with the predicted result which give the differences between predicted result and actual value for male and female. First error is positive and the second error is negative. Positive error is for male and the negative error is for female.
Figure 4.3: Genetic Diabetes Prediction for Different Gender
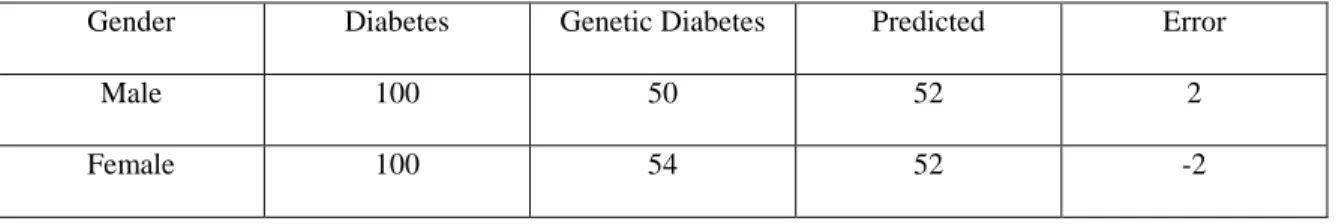
The following Table 4.1 shows the full description of the result. Here we can see all the inputs with the output. In the table the first column is for gender where present two instance male and female. The second column is for Diabetes. Here we give the total number of diabetes patents for male and female. As we work with 100 male and 100 female diabetes patients, so we give input 100 for male and 100 for female. The third
19
©Daffodil International University
column is for genetic diabetes patients. Here we give the total number of genetic diabetes patients of male and female from those 100 male and 100 female diabetes patients. The fourth and fifth column is for prediction and error. In prediction column it gives the predicted result of genetic diabetes for male and female by calculating the total number of diabetes and genetic diabetes patients. It is the main thing of this experiment. In error column it gives the difference between predicted result and actual value while measuring the prediction. This table will provide full knowledge of this experiment. Everyone can understand the result with the full input given in the table.
Table 4.1: Prediction Result of Genetic Diabetes for Different Gender with the Inputs
Gender Diabetes Genetic Diabetes Predicted Error
Male 100 50 52 2
Female 100 54 52 -2
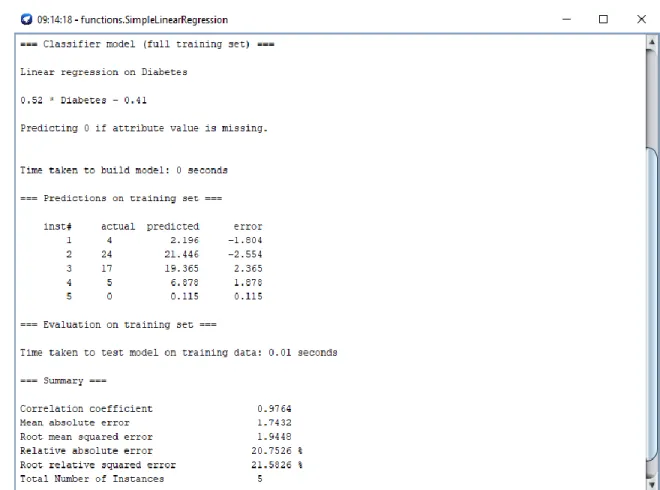
Step 4:
In the step 4 we do the second experimental prediction. Here we predict the final decision genetic diabetes only for male diabetes patients with different ranges of age of the patients. Figure 4.4 shows the output result screenshot of the prediction. The prediction is done by the Simple Linear Regression algorithm. This algorithm is basically used for predict something. Two numeric attributes diabetes and genetic diabetes are used for do the prediction. In diabetes attribute we give the total number of male diabetes patients for different ranges of age. In genetic diabetes attribute we give the total number of genetic diabetes patients from those diabetes patients of different ranges of age male. Then we run the algorithm selecting genetic diabetes as a class. Then the result is published by calculating between the two attributes with their numbers. Some errors also shows with the predicted result which give the differences between the predicted result and actual
20
©Daffodil International University
value for different ranges of male patient. Here three errors are positive and two errors are negative.
Figure 4.4: Genetic Diabetes Prediction for Different Ranges of Age Male
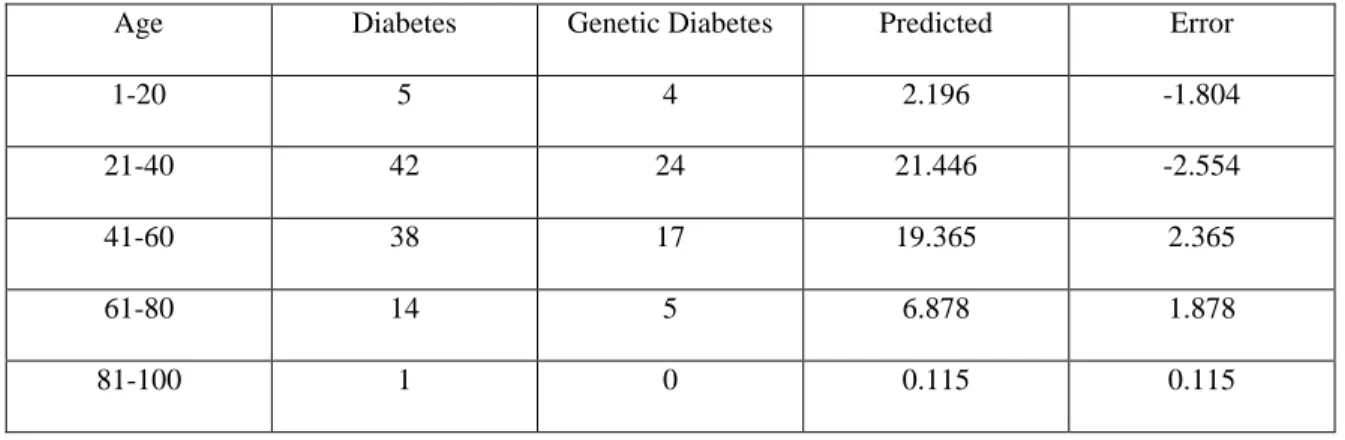
The following Table 4.2 shows the full description of the result. Here we can see all the inputs with the output. In the table the first column is for different ranges of age male patients where present five instance of ages range such as 1-20, 21-40, 41-60, 61-80 and 81-100. The second column is for Diabetes. Here we give the total number of diabetes patents for different ranges of age male patients. From 1-20 age there present 5 diabetes patients, 21-40 age there present 42 diabetes patients, 41-60 age there present 38 diabetes patients, 61-80 age there present 14 diabetes patients and 81-100 age there present 1 diabetes patients. The third column is for genetic diabetes patients. Here we give the total
21
©Daffodil International University
number of genetic diabetes patients from those diabetes patients of different ranges of age male. The fourth and fifth column is for prediction and error. In prediction column it gives the predicted result of genetic diabetes patients for different ranges of age male diabetes patients by calculating the total number of diabetes and genetic diabetes patients.
It is the main thing of this experiment. Here we get the higher prediction for the range of 21-40 age. In error column it gives the difference between predicted result and actual value while measuring the prediction. This table will provide full knowledge of this experiment. Everyone can understand the result with the full input given in the table.
Table 4.2: Prediction Result of Genetic Diabetes for Different Ranges of Age Male with the Inputs
Age Diabetes Genetic Diabetes Predicted Error
1-20 5 4 2.196 -1.804
21-40 42 24 21.446 -2.554
41-60 38 17 19.365 2.365
61-80 14 5 6.878 1.878
81-100 1 0 0.115 0.115
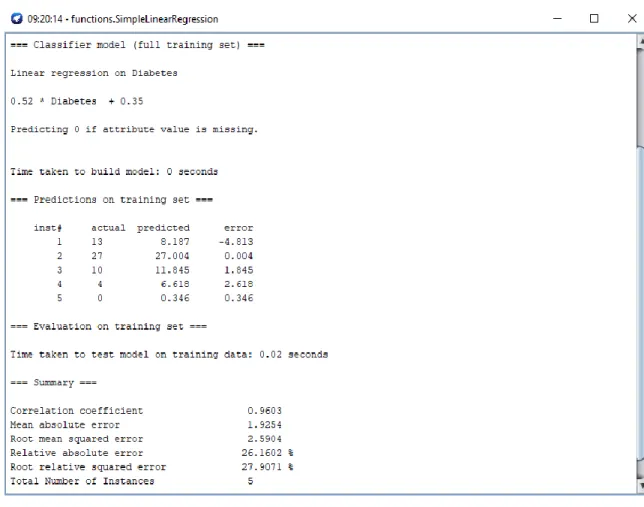
Step 5:
In the step 5 we do the third experimental prediction. Here we predict the final decision genetic diabetes only for female diabetes patients with different ranges of age of the patients. Figure 4.5 shows the output result screenshot of the prediction. The prediction is done by the Simple Linear Regression algorithm. This algorithm is basically used for predict something. Two numeric attributes diabetes and genetic diabetes are used for do the prediction. In diabetes attribute we give the total number of female diabetes patients for different ranges of age. In genetic diabetes attribute we give the total number of genetic diabetes patients from those diabetes patients of different ranges of age female.
22
©Daffodil International University
Then we run the algorithm selecting genetic diabetes as a class. Then the result is published by calculating between the two attributes with their numbers. Some errors also shows with the predicted result which give the differences between predicted result and actual value for different range of female patients. Here four errors are positive and one error is negative.
Figure 4.5: Genetic Diabetes Prediction for Different Ranges of Age Female
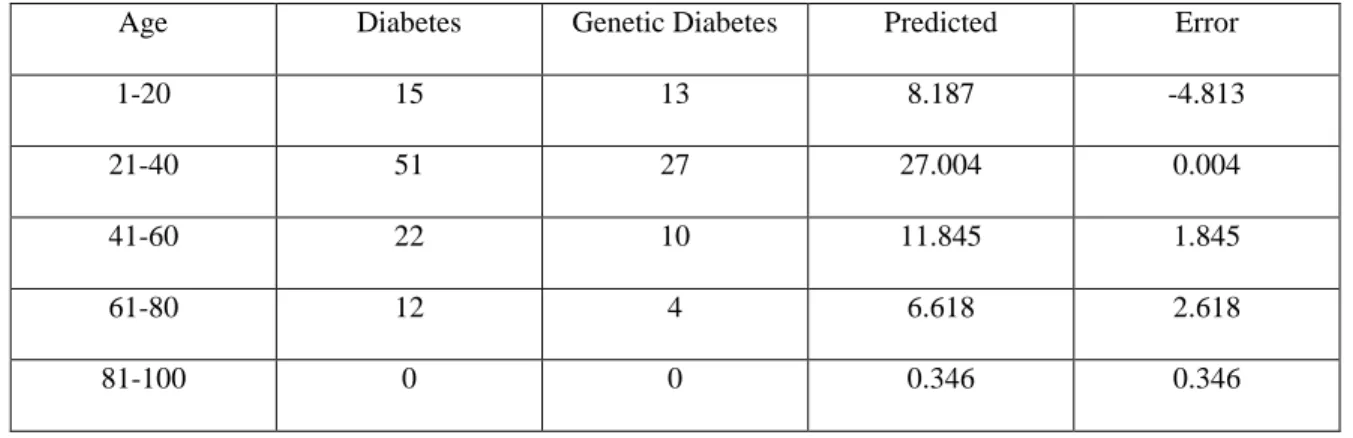
The following Table 4.3 shows the full description of the result. Here we can see all the inputs with the output. In the table the first column is for different ranges of age female patients where present five instance of ages range such as 1-20, 21-40, 41-60, 61-80 and 81-100. The second column is for Diabetes. Here we give the total number of diabetes patents for different ranges of age female patients. From 1-20 age there present 15
23
©Daffodil International University
diabetes patients, 21-40 age there present 51 diabetes patients, 41-60 age there present 22 diabetes patients, 61-80 age there present 12 diabetes patients and 81-100 age there present 0 diabetes patients. The third column is for genetic diabetes patients. Here we give the total number of genetic diabetes patients from those diabetes patients of different ranges of age female. The fourth and fifth column is for prediction and error. In prediction column it gives the predicted result of genetic diabetes patients for different ranges of age female diabetes patients by calculating the total number of diabetes and genetic diabetes patients. It is the main thing of this experiment. Here we get the higher prediction for the range of 21-40 age. In error column it gives the difference between predicted result and actual value while measuring the prediction. This table will provide full knowledge of this experiment. Everyone can understand the result with the full input given in the table.
Table 4.3: Prediction Result of Genetic Diabetes for Different Ranges of Age Female with the Inputs
Age Diabetes Genetic Diabetes Predicted Error
1-20 15 13 8.187 -4.813
21-40 51 27 27.004 0.004
41-60 22 10 11.845 1.845
61-80 12 4 6.618 2.618
81-100 0 0 0.346 0.346
Step 6:
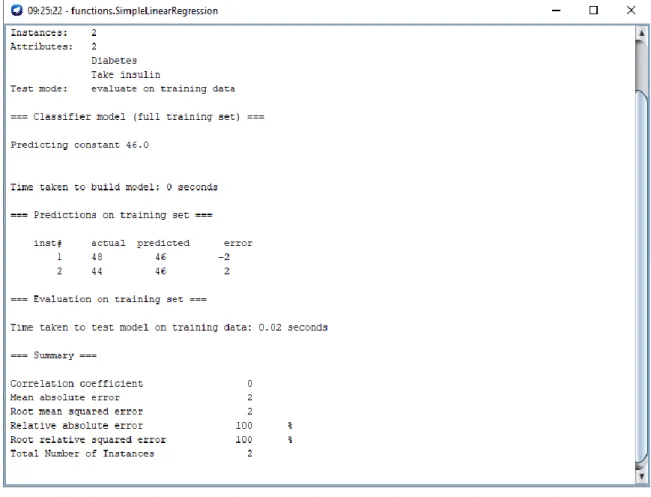
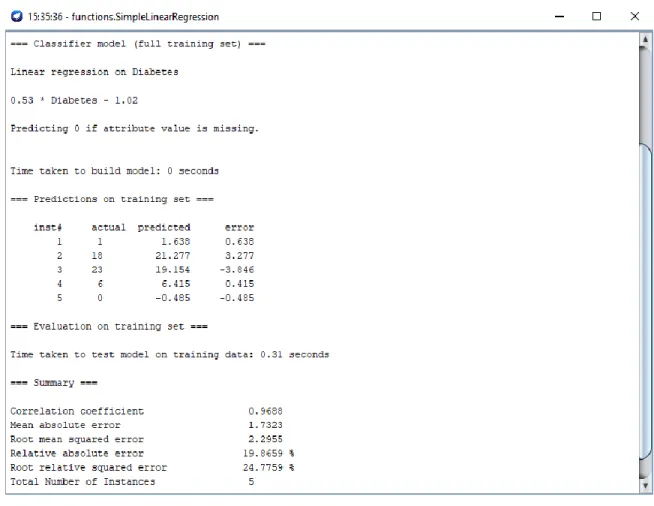
In the step 6 we do the fourth experimental prediction. Here we predict the take insulin patients of male and female from those diabetes patients of male and female. Figure 4.6 shows the output result screenshot of the prediction. The prediction is done by the Simple Linear Regression algorithm. This algorithm is basically used for predict something. Two
24
©Daffodil International University
numeric attributes diabetes and take insulin are used for do the prediction. In diabetes attribute we give the total number of diabetes patients of different gender. In take insulin attribute we give the total number of genetic diabetes patients. Then we run the algorithm selecting take insulin as a class. Then the result is published by calculating between the two attributes with their numbers. Two errors also shows with the predicted result which give the differences between predicted result and actual value for male and female. First error is negative and the second error is positive. Negative error is for male and the positive error is for female.
Figure 4.6: Take Insulin Prediction for Different Gender
25
©Daffodil International University
The following Table 4.4 shows the full description of the result. Here we can see all the inputs with the output. In the table the first column is for gender where present two instance male and female. The second column is for Diabetes. Here we give the total number of diabetes patents for male and female. As we work with 100 male and 100 female diabetes patients, so we give input 100 for male and 100 for female. The third column is for take insulin patients. Here we give the total number of take insulin patients of male and female from those 100 male and 100 female diabetes patients. The fourth and fifth column is for prediction and error. In prediction column it gives the predicted result of take insulin patients for male and female by calculating the total number of diabetes and take insulin patients. It is the main thing of this experiment. In error column it gives the difference between predicted result and actual value while measuring the prediction.
This table will provide full knowledge of this experiment. Everyone can understand the result with the full input given in the table.
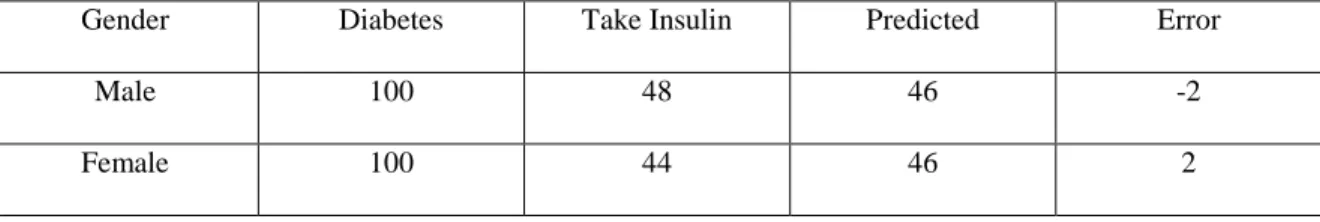
Table 4.4: Prediction Result of Take Insulin Patient for Different Gender with the Inputs
Gender Diabetes Take Insulin Predicted Error
Male 100 48 46 -2
Female 100 44 46 2
Step 7:
In the step 7 we do the fifth experimental prediction. Here we predict the final decision take insulin patients only for male diabetes patients with different ranges of age of the patients. Figure 4.7 shows the output result screenshot of the prediction. The prediction is done by the Simple Linear Regression algorithm. This algorithm is basically used for predict something. Two numeric attributes diabetes and take insulin are used for do the prediction. In diabetes attribute we give the total number of male diabetes patients for different ranges of age. In take insulin attribute we give the total number of take insulin
26
©Daffodil International University
diabetes patients from those diabetes patients of different ranges of age male. Then we run the algorithm selecting take insulin as a class. Then the result is published by calculating between the two attributes with their numbers. Some errors also shows with the predicted result which give the differences between predicted result and actual value for different range of age male patients. Here three errors are positive and two errors are negative.
Figure 4.7: Take Insulin Prediction for Different Ranges of Age Male
The following Table 4.5 shows the full description of the result. Here we can see all the inputs with the output. In the table the first column is for different ranges of age male patients where present five instance of ages range such as 1-20, 21-40, 41-60, 61-80 and 81-100. The second column is for Diabetes. Here we give the total number of diabetes
27
©Daffodil International University
patents for different ranges of age male patients. From 1-20 age there present 5 diabetes patients, 21-40 age there present 42 diabetes patients, 41-60 age there present 38 diabetes patients, 61-80 age there present 14 diabetes patients and 81-100 age there present 1 diabetes patients. The third column is for take insulin diabetes patients. Here we give the total number of take insulin diabetes patients from those diabetes patients of different ranges of age male. The fourth and fifth column is for prediction and error. In prediction column it gives the predicted result of take insulin diabetes patients for different ranges of age male diabetes patients by calculating the total number of diabetes and take insulin diabetes patients. It is the main thing of this experiment. Here we get the higher prediction for the range of 21-40 age. In error column it gives the difference between predicted result and actual value while measuring the prediction. This table will provide full knowledge of this experiment. Everyone can understand the result with the full input given in the table.
Table 4.5: Prediction Result of Take Insulin Patient for Different Ranges of Age Male with the Inputs
Age Diabetes Take Insulin Predicted Error
1-20 5 1 1.638 0.638
21-40 42 18 21.277 3.277
41-60 38 23 19.154 -3.846
61-80 14 6 6.415 0.415
81-100 1 0 -0.485 -0.485
Step 8:
In the step 8 we do the sixth and final experimental prediction. Here we predict the final decision take insulin patients only for female diabetes patients with different ranges of age of the patients. Figure 4.8 shows the output result screenshot of the prediction. The
28
©Daffodil International University
prediction is done by the Simple Linear Regression algorithm. This algorithm is basically used for predict something. Two numeric attributes diabetes and take insulin are used for do the prediction. In diabetes attribute we give the total number of female diabetes patients for different ranges of age. In take insulin attribute we give the total number of take insulin diabetes patients from those diabetes patients of different ranges of age female. Then we run the algorithm selecting take insulin as a class. Then the result is published by calculating between the two attributes with their numbers. Some errors also shows with the predicted result which give the differences between predicted result and actual value for different range of age female patients. Here four errors are positive and one error is negative.
Figure 4.8: Take Insulin Prediction for Different Ranges of Age Female
29
©Daffodil International University
The following Table 4.6 shows the full description of the result. Here we can see all the inputs with the output. In the table the first column is for different ranges of age female patients where present five instance of ages range such as 1-20, 21-40, 41-60, 61-80 and 81-100. The second column is for Diabetes. Here we give the total number of diabetes patents for different ranges of age female patients. From 1-20 age there present 15 diabetes patients, 21-40 age there present 51 diabetes patients, 41-60 age there present 22 diabetes patients, 61-80 age there present 12 diabetes patients and 81-100 age there present 0 diabetes patients. The third column is for take insulin diabetes patients. Here we give the total number of take insulin diabetes patients from those diabetes patients of different ranges of age female. The fourth and fifth column is for prediction and error. In prediction column it gives the predicted result of take insulin diabetes patients for different ranges of age female diabetes patients by calculating the total number of diabetes and take insulin diabetes patients. It is the main thing of this experiment. Here we get the higher prediction for the range of 21-40 age. In error column it gives the difference between predicted result and actual value while measuring the prediction. This table will provide full knowledge of this experiment. Everyone can understand the result with the full input given in the table.
Table 4.6: Prediction Result of Take Insulin Patient for Different Ranges of Age Female with the Inputs
Age Diabetes Take Insulin Predicted Error
1-20 15 7 7.143 0.143
21-40 51 17 19.076 2.076
41-60 22 15 9.463 -5.537
61-80 12 5 6.148 1.148
81-100 0 0 2.17 2.17
30
©Daffodil International University
4.3 Descriptive Analysis:
In this research project we can analysis many things with the result. Those analysis are:
1. Here we work with only 100 male and 100 female total 200 patients. If we can work with more patients then the results will be more accurate.
2. In the prediction parts we can see the prediction for different experiments. But the first predictions and the last predictions separately give the same result because of the same amount of diabetes patients for male and female.
3. The rest of the predictions give different results because there take different values for different attributes and instances.
4.4 Summary:
The project is done only for getting the predictions of the genetic diabetes patients. Here we find the genetic diabetes prediction for three different conditions. The first one is for getting the genetic diabetes prediction for different gender. The second one is for getting genetic diabetes prediction for different range of age male diabetes patients. The third one is for getting the genetic diabetes prediction for different range of female diabetes patients. Also we find an extra prediction for take insulin diabetes patients prediction.
Before we start getting the predictions, we get a clustering result and a decision tree.
31
©Daffodil International University
CHAPTER 5
SUMMARY, CONCLUSION, RECOMMENDATION AND IMPLICATION FOR FUTURE
RESEARCH
5.1 Summary of the Study:
In this report, we have elaborated out total work flow for the research and implementation of this method. In chapter 3, we described about the research subject, data collection procedure and implementation step. In chapter 4, we show the experimental result after implementation. In chapter 5, we discussed about the summery and association for future research. Finally we have concised all attempt and likened the result achieved by analyzing data set and representing different prediction.
5.2 Conclusions:
We have shown approach to predict the genetic diabetes using data mining. The research is done on prediction of genetic diabetes using prediction analysis by simple linear regression method. We also did not find any researches of the similar nature done focusing especially on genetic diabetes prediction.
Also, we have shown approach to predict the taking insulin diabetes patients using data mining. The research is also done on prediction of taking insulin diabetes using prediction analysis by simple linear regression method.
5.3 Recommendations:
In the recommendation process we have to give recommendation to the supervisor sir to do the research. Also we have to give recommendation to the hospitals to take the data of the diabetes patients.
32
©Daffodil International University
5.4 Implication for Further Study:
In our research paper, we trying to describe the process of understanding a person diabetes is genetic or not. But there are some limitations in our research. Our research was limited with the small available dataset. With greater scaled survey, more relevant emotions can be classified that fits the scope of this study. Larger set of input data from different set of people can give more accuracy. Therefore, providing the possibility of more accurate prediction. We think our research is unique because maximum research have been done on the risk factor of diabetes. Many few research are based on diabetes mellitus which is caused by gene mutation. So we can ensure that our research provide a new invention and this will help a lot in medical sector.
33
©Daffodil International University REFERENCES:
[1] diabetes, A. and diabetes, W. (2019). International Diabetes Federation - What is diabetes.
[online] Idf.org. Available at: https://www.idf.org/aboutdiabetes/what-is-
diabetes.html?gclid=EAIaIQobChMI687hkv6t5QIVg5WPCh1mYAc2EAAYASAAEgINovD_Bw E [Accessed 2 Nov. 2019].
[2] F. Cold et al., "The Risks and Complications of Uncontrolled Diabetes", WebMD, 2019. [Online].
Available: https://www.webmd.com/diabetes/guide/risks-complications-uncontrolled-diabetes#1.
[Accessed: 02- Nov- 2019].
[3] "Genetics of Type 2 Diabetes: Environmental Factors, Prevention, More", Healthline, 2019.
[Online]. Available: https://www.healthline.com/health/type-2-diabetes/genetics#genes- responsible-for-type-2. [Accessed: 02- Nov- 2019].
[4] Pdfs.semanticscholar.org, 2019. [Online]. Available:
https://pdfs.semanticscholar.org/7b8d/f4a0d81e2d819e4d0c21400fc0a9ffcf8bb4.pdf. [Accessed:
02- Nov- 2019].
[5] A. Azrar, Y. Ali, M. Awais and K. Zaheer, "Data Mining Models Comparison for Diabetes Prediction", International Journal of Advanced Computer Science and Applications, vol. 9, no. 8, 2018. Available: 10.14569/ijacsa.2018.090841.
[6] "10 facts on diabetes", World Health Organization, 2019. [Online]. Available:
https://www.who.int/features/factfiles/diabetes/en/. [Accessed: 02- Nov- 2019].
[7] C. Deborah Weatherspoon, "Diabetes and heredity: Type 1, type 2, and gestational diabetes", Medical News Today, 2019. [Online]. Available:
https://www.medicalnewstoday.com/articles/317468.php. [Accessed: 02- Nov- 2019].
[8] C. Deborah Weatherspoon, "History of diabetes: early science, early treatment, insulin", Medical News Today, 2019. [Online]. Available: https://www.medicalnewstoday.com/articles/317484.php.
[Accessed: 02- Nov- 2019].
[9] G. Reference, "Type 2 diabetes", Genetics Home Reference, 2019. [Online]. Available:
https://ghr.nlm.nih.gov/condition/type-2-diabetes#definition. [Accessed: 02- Nov- 2019].
[10] G. Reference, "Type 2 diabetes", Genetics Home Reference, 2019. [Online]. Available:
https://ghr.nlm.nih.gov/condition/type-2-diabetes#inheritance. [Accessed: 02- Nov- 2019].
[11] A. Aljumah, M. Ahamad and M. Siddiqui, "Application of data mining: Diabetes health care in young and old patients", Journal of King Saud University - Computer and Information Sciences, vol. 25, no. 2, pp. 127-136, 2013. Available: 10.1016/j.jksuci.2012.10.003.
[12] S. Perveen, M. Shahbaz, A. Guergachi and K. Keshavjee, "Performance Analysis of Data Mining Classification Techniques to Predict Diabetes", Procedia Computer Science, vol. 82, pp. 115-121, 2016. Available: 10.1016/j.procs.2016.04.016.
34
©Daffodil International University
APPENDICES:
Some implementation work processes screenshots of weka are given below:
35
©Daffodil International University
36
©Daffodil International University
37
©Daffodil International University
38
©Daffodil International University
39
©Daffodil International University
Other predictions are done with the same process of last four screenshots.
40
©Daffodil International University
41
©Daffodil International University
42
©Daffodil International University
43
©Daffodil International University