DESIGN AND DEVELOPMENT OF A MOBILE APPLICATION: BLOOD ANALYSIS
BY ASIFISLAM 181-15-11288
This Report Presented in Partial Fulfillment of the Requirements for the Degree of Bachelor of Science in Computer Science and Engineering
Supervised By Touhid Bhuiyan Professor & Head Department of CSE
Daffodil International University
Co-Supervised By
Mr. Narayan Ranjan Chakraborty
Assistant Professor Department of CSE
Daffodil International University
DAFFODIL INTERNATIONAL UNIVERSITY DHAKA, BANGLADESH
MAY2022
©Daffodil International University
This Project titled “Design and Development of a mobile application: Blood Analysis”, submitted by Asif Islam
Engineering, Daffodil International University, has been accepted as satisfactory for the partial fulfillment of the requirements for the degree of B.Sc. in Computer Science and Engineering and approved as to its style and contents. The presentation has been held on 16.05.2022.
BOARD OF EXAMINERS
________________________
Dr. S.M Aminul Haque
Associate Professor and Associate Head
Department of Computer Science and Engineering Faculty of Science & Information Technology Daffodil International University
________________________
Dr. Md. Tarek Habib Assistant Professor
Department of Computer Science and Engineering Faculty of Science & Information Technology Daffodil International University
Daffodil International University
APPROVAL
Design and Development of a mobile application: Blood Asif Islam to the Department of Computer Science and Engineering, Daffodil International University, has been accepted as satisfactory for the partial fulfillment of the requirements for the degree of B.Sc. in Computer Science and g and approved as to its style and contents. The presentation has been held on
BOARD OF EXAMINERS
________________________
Associate Professor and Associate Head
Department of Computer Science and Engineering of Science & Information Technology Daffodil International University
________________________
Department of Computer Science and Engineering Faculty of Science & Information Technology
International University
Internal Examiner
i Design and Development of a mobile application: Blood to the Department of Computer Science and Engineering, Daffodil International University, has been accepted as satisfactory for the partial fulfillment of the requirements for the degree of B.Sc. in Computer Science and g and approved as to its style and contents. The presentation has been held on
Chairman
Internal Examiner
©Daffodil International University ________________________
Md. Abbas Ali Khan Assistant Professor
Department of Computer Science and Engineering Faculty of Science & Information Technology Daffodil International University
______________________
Dr. Dewan Md. Farid Professor
Department of Computer Science and Engineering United International University
Daffodil International University ________________________
Department of Computer Science and Engineering Faculty of Science & Information Technology Daffodil International University
Internal Examiner
Department of Computer Science and Engineering United International University
External Examiner
ii Internal Examiner
External Examiner
©Daffodil International University
iii
DECLARATION
I hereby declare that, this project has been done by me under the supervision of Touhid Bhuiyan, Professor & Head, Department of CSE Daffodil International University. I also declare that neither this project nor any part of this project has been submitted elsewhere for award of any degree or diploma.
Supervised by:
Touhid Bhuiyan Professor & Head Department of CSE
Daffodil International University Co-Supervised by:
Mr. Narayan Ranjan Chakraborty Assistant Professor
Department of CSE
Daffodil International University Submitted by:
Asif Islam
ID: 181-15-11288 Department of CSE
Daffodil International University
©Daffodil International University
iv
ACKNOWLEDGEMENT
First I express our heartiest thanks and gratefulness to almighty God for His divine blessing makes me possible to complete the final year project/internship successfully.
I really grateful and wish our profound our indebtedness to Touhid Bhuiyan, Professor
& Head, Department of CSE Daffodil International University, Dhaka. Deep Knowledge
& keen interest of my supervisor in the field of “Computer Science” to carry out this project. His endless patience ,scholarly guidance ,continual encouragement , constant and energetic supervision, constructive criticism , valuable advice ,reading many inferior draft and correcting them at all stage have made it possible to complete this project.
I would like to express my heartiest gratitude to Touhid Bhuiyan, Professor & Head, Department of CSE, for his kind help to finish our project and also to other faculty member and the staff of CSE department of Daffodil International University.
I would like to thank my entire course mate in Daffodil International University, who took part in this discuss while completing the course work.
Finally, I must acknowledge with due respect the constant support and patients of my parents.
©Daffodil International University
v
ABSTRACT
The rapid growth of smart phone technology with sensors has enabled physiological measurements, which can simplify self assessments, medical diagnosis and environmental monitoring etc. Smart phone today offers significant advantages over traditional platforms in terms of test speed, control, low cost, ease-of-operation, and data management, and requires minimal equipment and user involvement. This study investigates the feasibility of extracting heart rate, oxygen saturation, respiration rate, blood pressure using a cell phone camera in a non invasive way, without the need of external sensors which is independent of ambient lighting condition. The method works by placing people finger over the smart phone camera and computing the quantity of light absorbed by the finger tissue. The smart phone thus acquires the Photoplethysmographic (PPG) signal. From heart pulse, oxygen saturation, respiration rate, blood pressure are estimated by using a peak detection algorithm in order to find the local maxima of the PPG signal and computing the time difference between peaks. I have compared the accuracy of heart pulse, oxygen saturation, respiration rate, blood pressure estimated by our method with a camera sensor over three different controlled experimental conditions.
The fast fourier transform (FFT) plots showed a clear frequency. This is a mobile application is being developed in order to measure and computed heart rate, blood pressure, all vital signs, respiration rate and oxygen saturation by doing image processing of blood cells.
©Daffodil International University
vi
TABLE OF CONTENTS
CONTENTS
PAGEBoard of examiners i
Declaration ii
Acknowledgements iii
Abstract iv
CHAPTER
CHAPTER 1: INTRODUCTION
1-31.1 Introduction 1
1.2 Motivation 2
1.3 Objectives 2
1.4 Expected Outcomes 2
1.5 Project Management and Finance 2-3
1.6 Report Layout 3
CHAPTER 2: BACKGROUND
5-72.1 Preliminaries/Terminologies 5
2.2 Related Works 5
2.3 Comparative Analysis 5
2.4 Scope of the Problem 6-7
2.5 Challenges 7
©Daffodil International University
vii
CHAPTER 3: REQUIREMENT SPECIFICATION
8-193.1 Business Process Modeling 8
3.2 Requirement Collection and Analysis 9
3.2.1 Methodology 10-13
3.3 Use Case Modeling and Description 14-17
3.4 Logical Data Model 18
3.5 Design Requirement 19
CHAPTER 4: DESIGN SPECIFICATION
20-494.1 Front-end Design 20-46
4.2 Back-end Design 47-48
4.3 Interaction Design and User Experience (UX) 49
4.4 Implementation Requirements 49
CHAPTER 5: IMPLEMENTATION AND TESTING
50-515.1 Implementation of Database 50
5.2 Implementation of Front-end Design 50
5.3 Testing Implementation 50
5.4 Test Results and Reports 51
CHAPTER 6: IMPACT ON SOCIETY,ENVIRONMENT
AND SUSTAINABILITY
52
6.1 Impact on Society 52
©Daffodil International University
viii
6.2 Impact on Environment 52
6.3 Ethical Aspects 52
6.4 Sustainability Plan 52
CHAPTER 7: CONCLUSION AND FUTURE SCOPE
537.1 Discussion and Conclusion 53
7.2 Scope for Further Developments 53
REFERENCES
54©Daffodil International University
ix
TABLE OF CONTENTS LIST OF FIGURES
FIGURES PAGE NO
Figure 3.1.1: Business Process Modeling 6
Figure 3.2.1: Fast Fourier Transform formula 11
Figure 3.2.2: Fast Fourier Transform frequency 11
Figure 3.2.3: Waterfall Model 12
Figure 3.2.4: Iterative and Incremental Life Cycle 13
Figure 3.3.1: Use case model 14
Figure 3.4.1: Logical Data Model 18
Figure 4.3.1: Sign In 20
Figure 4.3.2: Signup 21
Figure 4.1.3: Home 22
Figure 4.1.4: Heart Rate Instruction 23
Figure 4.1.5: Calculate Heart Rate 24
Figure 4.1.6: Heart Rate Result 25
Figure 4.1.7: Blood Pressure Information 26
Figure 4.1.8: Calculate Blood Pressure 27
Figure 4.1.9: Blood Pressure 28
©Daffodil International University
x
Figure 4.1.10: Respiration Rate Instruction 29
Figure 4.1.11: Calculate Respiration Rate 30
Figure 4.1.12: Respiration Rate Result 31
Figure 4.1.13: Oxygen Saturation Instruction 32
Figure 4.1.14: Calculate Oxygen Saturation 33
Figure 4.1.15: Oxygen Saturation 34
Figure 4.1.16: All Vital Signs Instruction 35
Figure 4.1.17: Calculate All Vital Signs 36
Figure 4.1.18: All Vital Signs Result 37
Figure 4.1.19: Information 38
Figure 4.1.20: Emagency 39
Figure 4.1.21: Report 40
Figure 4.1.22: Chart 41
Figure 4.1.23: About 42
Figure 4.1.24: Web Home Page 43
Figure 4.1.25: Dashboard 44
Figure 4.1.26: Profile 44
Figure 4.1.27: Weight 45
Figure 4.1.28: Appointment 46
Figure 4.2.1: Administration 47
©Daffodil International University
xi
Figure 4.2.2: Firebase 48
©Daffodil International University
xii
LIST OF TABLES
TABLES PAGE NO
Table 1.5: Project Management and Finance 3
Table 5.4: Test Results and Report 51
©Daffodil International University
1
CHAPTER 1 INTRODUCTION
1.1 Introduction
In our society, People suffer from various kinds of health issues. We need to do our regular check up. Chronic diseases, like heart disease, stroke, diabetes, cancer and communicable diseases affect the health of millions of people and cost billions of dollars in medical expenses every year. These diseases often can be prevented by tracking risk factors, including high blood pressure, high cholesterol and elevated blood sugar levels under control. People also don't have easier access to medical care, so they have to run to the hospital any time they feel sick and take advice. So, if anyone becomes ill, they have two options: focus on the emergency care available to them, which may or may not be helpful, or go to a location where they may locate a trained medical assistant, which may be time-consuming as well as expensive. The purpose of this android project is to provide everyone a one-stop solution for checking heart rate, oxygen saturation, blood pressure respiration rate by image processing. They need to use their fingertips on the back camera for doing the test with “Blood Analysis” android application.
1.2 Objective
The main objective of this project is to help patient detect their heart rate, oxygen saturation, blood pressure respiration rate at home by their selves using an android application.Some more objectives are given below -
Check heart pulse.
Check blood pressure
Check respiration rate
Check oxygen saturation
Tracking health problem
Test by android application
Less time consuming
No cost
©Daffodil International University
2 1.3 Motivation
In this modern era, technology has advanced to a level that is beyond our imagination.
But still doing medical test at home is not so easier. Today most of us using online doctor portal to save our time. But we need to go to the nearest clinic or hospital to do certain test, So I want to solve this problem by using an android application.
With this application patient can check heart rate, oxygen saturation, respiration rate, blood pressure from anywhere.
1.4 Expected Outcomes
Get heart pulse test report.
Get blood pressure test report.
Check respiration rate test report.
Check oxygen saturation test report.
Test can be conduct by an android application.
Doctor can see report digitally without any extra tool.
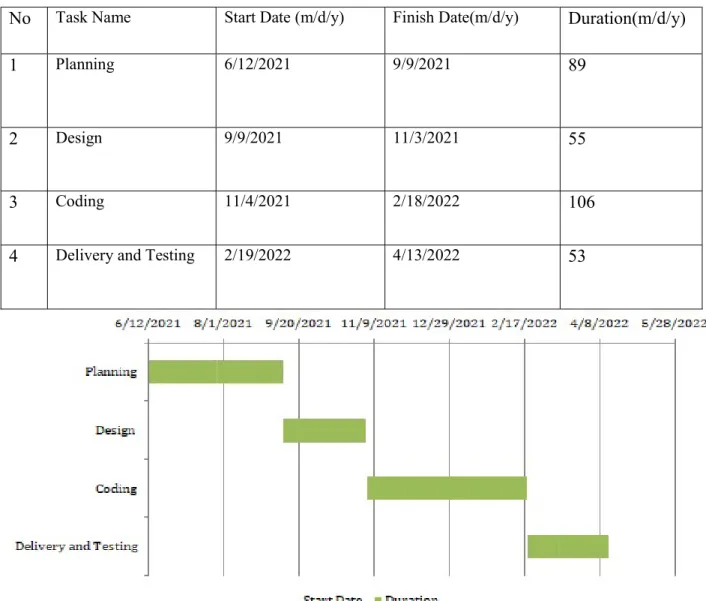
1.5 Project Management and Finance
Project financial management goes to simply managing costs and planning, capturing, and managing costs on any projects. If the user needs to maintain a balance between the project investment and the expected benefits or returns associated with that project. My project is Blood Analysis. So, I think my project is a portfolio project. This project should maintain a balance between the project investment and the expected benefits. I think the overall impact on my business results. Blood Analysis project discusses approaches to project financial management that benefit the user by providing them with meaningful, powerful financial information that can be used to manage my business. So, I think the overall context and criteria of my Blood Analysis project provides powerful project finances and is followed by specific approaches for managing and reporting , planning on project and portfolio performance of my Blood Analysis project. Projects are correlated to the budgets that I have to fund it.
©Daffodil International University
Varieties calculations, budget and need to spend are unfailing across the portfolio.
Financial performance
Financial performance can be aggregated to continue the project and across. So, it is helpful for me.
Project financial information is relevant to the Sponsor.
I have to store the data on the server. So, server.
Table 1.5: Project Management and Finance
No Task Name 1 Planning
2 Design
3 Coding
4 Delivery and Testing
Daffodil International University
Varieties calculations, budget and need to spend are unfailing across the portfolio.
Financial performance for components within a portion of a project.
Financial performance can be aggregated to continue the project and across. So, it
Project financial information is relevant to the Sponsor.
re the data on the server. So, I need funds to store the data to the
Table 1.5: Project Management and Finance Start Date (m/d/y) Finish Date(m/d/y)
6/12/2021 9/9/2021
9/9/2021 11/3/2021
11/4/2021 2/18/2022
2/19/2022 4/13/2022
Figure 1.5: Gantt Chart
3 Varieties calculations, budget and need to spend are unfailing across the portfolio.
Financial performance can be aggregated to continue the project and across. So, it
need funds to store the data to the
Duration(m/d/y) 89
55
106 53
©Daffodil International University
4 1.6 Report Layout
In this chapter 1, there is a Introduction, here discuses about introduction, objectives, motivation and the expected outcome. Project Management and Finance of my project.
In this chapter 2, there is a Background, here discusses about the background of Preliminaries/Terminologies, related work such as comparison with other app projects and website projects and check the problem to my project, the challenges is which are facing when the project do.
In this chapter 3, there is a Requirement Specification, here give whose kind of requirements and work to the project such as business process modeling, requirement collection and analysis, use case modeling and description, Logical data model and design requirement
In this chapter 4, there is aDesign Specification, here The purpose of the design of the project. In this purpose there have two types of the design first is Front-end Design and other is Back-end, Interaction Design and User Experience (UX), Implementation Requirements The proper work in this project of the design is show with in detail.
In this chapter 5, there are an Implementation and Testing, here Implementation of Database, Implementation of Front-end Design, Testing Implementation and Testing system of the project by the project, Test Results and Reports in this project.
In this chapter 6, there are Impact on Society, Environment and Sustainability, here discuss about impact on society, impact on environment, ethical aspects, sustainability plan in my project.
In this chapter 7, there are a Conclusion and Future Scope, here discussion about in this project and Conclusion of this project, here also discussed about which kind of thing I will add in future implementation scope in this project.
©Daffodil International University
5
CHAPTER 2 BACKGROUND
2.1 Preliminaries/Terminologies
In today’s world smart phone capabilities are increasing day by day. We can now analysis different kind of things with help of sensors. “Blood analysis” is an android application which takes user figure as input on the back camera with flash light turned on.
Camera takes multiple snaps and do image processing to calculate heart pulse, oxygen saturation, blood pressure, respiration rate. Patient can test these things at home and send data to doctor via online platform. No need to buy extra device, their smart phone will do all the jobs.
2.2 Related Works
There are some related works is available right now but no one is similar. Many of the systems have some limitations. Many of the systems are based on the Web or have only a one feature. From the study of this similar project, I got interested to develop this system where four features are combined in one app and give more accurate measurement. These are some related application in the play store – “Heart Rate pulse”, “Pulse Oximeter Tracker”.
2.3 Comparative Analysis
This "Blood Analysis'' app is different from any other app in the market. There are some apps and websites, where they offer only one feature at a time. But I have combine four feature in one app using image processing. Patient can check or test heart rate, oxygen saturation, all vital signs, blood pressure and respiration rate easily from one app.
©Daffodil International University
6 2.4 Scope of the Problem
Doing medical test from home still not very easy in the modern era. There are some problem scope given below -
Need to visit to clinic for test
Need to use extra device for test
Need to wait for a long time to get test report
Extra device is costly
Operating via smart phone is not available
One device cannot give all the faculties what an smart phone application can give
Patience can’t sent test result to the doctor via online medium so easily if needed
According to these problems, my mobile application makes solutions that will help patients to recover their problem. The patients can easily access the mobile application anytime and anywhere. This application is user friendly and very easy to use. This application has most importantly there is no privacy issue.
For Patients helps,
• Time saving
• The smart way of measuring
• Easily finds result
• Reduce cost
• Send their result to the doctor
• Reduce the test delay For Doctors helps,
©Daffodil International University
7
• Easily check patient Result
• No need for any extra test device
• Can know patient present health conditions 2.5 Challenges
No task is without challenges. Additionally, we encountered some challenges while completing my project.
Here are a few of the main issues that I have face:
Software Development Stage: While developing “Blood Analysis”, I have to consider multiple Android versions.
Image Processing: Capturing the fingertip and doing image processing to extract data.
Custom UI design: As the standard UI cannot meet all of an application's requirements, I had to redesign the UI by customizing the options.
Camera Sensor: Camera was sometime crashing while taking the finger measurement.
Security issues: It is challenging to make the application and user data secure.
Power Management: While doing the heavy image processing the battery was draining fast. I had to use android “wakelock” feature.
Testing State: I needed to follow different testing strategies.
Java Programming Language: I have to implement image processing and blood measurement logic in this mobile application through this language. It was very challenging.
Scalability: I need to build my mobile application that is marketable to accept the latest technologies.
©Daffodil International University
REQUIREMENT SPECIFICATION
3.1 Business Process Modeling
Figure
Daffodil International University
CHAPTER 3
REQUIREMENT SPECIFICATION
3.1 Business Process Modeling
Figure3.1.1: Business Process Modeling
8
©Daffodil International University
9 In this is Figure 3.1.1 is a Business Process Modeling. Here:
Patient’s can first Sign Up.
Then the patient can Sign In the app.
Then the patient takes a choose option from dashboard.
Then the patient presses any button from dashboard.
Then the patient put his finger on the camera sensor.
The patient calculate the beats per minute from this app
The patient sees the result and sends the data by share data button.
The patient can upload data to cloud.
The doctor can see patients test result.
Then the doctor can discuss the data and check the problem.
Then the doctor gives medicine to his patients.
This Business Process Modeling will show how to patient’s send the beats per minute data and the doctor can see the result.
3.2 Requirement Collection and Analysis This app should Requirement have:
User Interface
Scope
Verification
Limitation
©Daffodil International University
10 User Interface: User Interface is very needed for an application. It helps to give results for design.
Scope: This app calculate BPM and show their result by using camera sensor.
Verification: My app will work excellently. User can verify this app very easily.
Limitation:
Need to put finger on camera properly.
Sometime may not give 100% accurate result.
We will provide high security in future.
Need to have smart phone with camera and flashlight 3.2.1 Methodology:
The method started with a human placing his finger over the phone camera without pressing down any additional force and the smart phone camera’s flash turned on. User need to keep his finger for 26 sec on the camera to give finger tips measurement. RGB components were extracted from every frame by image processing. The red and green values were used to compute the average of light absorbed by the finger tissue in every frame. Thus, the PPG signal is acquired and used to extract data. The red and green intensity average in the PPG signal formed peaks that correspond to cardiac pulse. A peak detection algorithm was used to find all the cardiac peaks in the signal. Once a peak was found, the time difference between consecutive peaks was calculated.After this, the Fast Fourier Transform (FFT) of the heart rate was computed. I observed that the FFT plots showed a clear harmonic peak at the frequencies, which corresponded to the respective respiration rate.
The R-R interval is used for measurement heart rate using the formula is given below:
Heart Rate = 26 /RR
YUV data to convert RGB. Here Cr is a U and Cb is a V:
Cr = Cr - 128;
©Daffodil International University
11 Cb = Cb – 128;
R = Y + Cr + (Cr >> 2) + (Cr >> 3) + (Cr >> 5);
G = Y – ((Cb >> 2) + (Cb >> 4) + (Cb >> 5)) – ((Cr >> 1) + (Cr >> 3) + (Cr >> 4) + (Cr>> 5));
B = Y + Cb + (Cb >> 1) + (Cb >> 2) + (Cb >> 6);
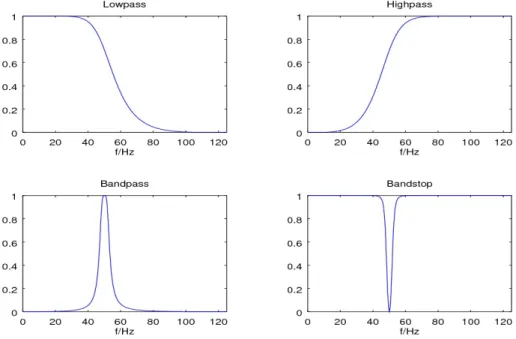
In this app I used Fast Fourier Transform to store in an array to Red and Green intensities. The formula is given below:
Figure 3.2.1: Fast Fourier Transform formula
The Respiration Rate I used Fft2. The Fft2 is a bandpass filter should be 0.1 Hz to 0.4Hz with 0.2Hz.
Figure 3.2.2: Fast Fourier Transform frequency
©Daffodil International University
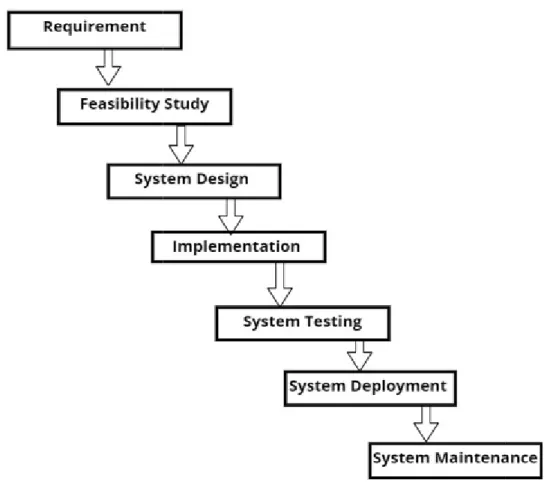
In this project I use the waterfall model. This model is commonly used to create the development life cycle. Why I use this model it is given below:
It presents clear projects.
It is easy to use.
It is easy to test and debug.
It can be easily understand and managed.
Waterfall Model
Project Management Life Cycle:
It is a framework via which to translate knowledge into reality in an exactly.
Daffodil International University
In this project I use the waterfall model. This model is commonly used to create the development life cycle. Why I use this model it is given below:
It presents clear projects.
It is easy to test and debug.
It can be easily understand and managed.
Figure 3.2.3: Waterfall Model Project Management Life Cycle:
It is a framework via which to translate knowledge into reality in an exactly.
12 In this project I use the waterfall model. This model is commonly used to create the
©Daffodil International University
This is a higher process for a successful to my project. Through this, the life cycle of each project is described. The following picture shows the steps of its life cycle:
Starting
Planning
Executing
Handling
Ending Life Cycle
Figure 3.2.4
Daffodil International University
a higher process for a successful to my project. Through this, the life cycle of each project is described. The following picture shows the steps of its life cycle:
Figure 3.2.4: Iterative and Incremental Life Cycle
13 a higher process for a successful to my project. Through this, the life cycle of each project is described. The following picture shows the steps of its life cycle:
©Daffodil International University
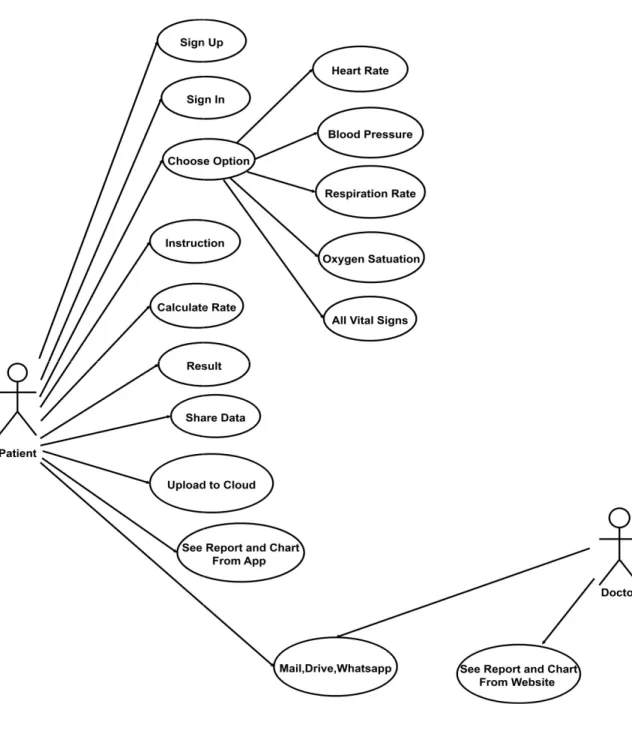
3.3 Use Case Modeling and Description
In this is Figure 3.3.1 is a Use Case Modeling. Here:
Use case 1: Sign Up Actor: Patient
Daffodil International University
3.3 Use Case Modeling and Description
Figure 3.3.1: Use case model
3.3.1 is a Use Case Modeling. Here:
14
©Daffodil International University
15 Precondition: No precondition is required
Success Scenario:
1. Actor enters the Username.
2. Actor enters the Password.
3. Actor enters the Conform Password.
4. Actor enters the Age.
5. Actor enters the Mail.
6. Actor enters the Height.
7. Actor enters the Weight.
Exception Scenario:
1. Correct Password, Conform Password, Age, Mail, Height, Weight.
Use case 2: Sign In Actor: Patient
Precondition: No precondition is required Success Scenario:
1. Actor enters Username in the Username box.
2. Actor enters Password in the password box.
3. Actor enters his or her credentials by pressing the login button.
Exception Scenario:
1. The password is incorrect.
2. There is no password.
©Daffodil International University
16 Use case 3: Choose Option
Actor: Patient
Precondition: No precondition is required Success Scenario:
1. Actor pressing the Heart Rate button.
2. Actor pressing the Respiration Rate button.
3. Actor pressing the Blood Pressure button.
4. Actor pressing the Oxygen Saturation button.
5. Actor pressing the All Vital Signs button.
Exception Scenario:
1. Have no any.
Use case 4: Instruction Actor: Patient
Precondition: Select Heart Rate, Respiration Rate, Blood Pressure, Oxygen Saturation or All Vital Signs button
Success Scenario:
1. Actor Know about measuring their BPM.
Exception Scenario:
1. Choose any Heart Rate, Respiration Rate, Blood Pressure, Oxygen Saturation or All Vital Signs button it is not work.
Use case 5: Calculate BPM
©Daffodil International University
17 Actor: Patient
Precondition: Select Heart Rate, Respiration Rate, Blood Pressure, Oxygen Saturation or All Vital Signs measurement button.
Success Scenario:
1. Actor put his finger on the sensor.
Exception Scenario:
1. If move his finger on the sensor it do not measurement.
Use case 6: Result Actor: Patient
Precondition: Select Heart Rate, Respiration Rate, Blood Pressure, Oxygen Saturation or All Vital Signs measurement button then measuring their BPM.
Success Scenario:
1. Actor sees their result.
2. Send their result to Mail, Drive, Whatsapp.
Exception Scenario:
1. If move his finger on the sensor it do not measurement.
This Use Case Modeling will show how to patient’s send the beats per minute data and the doctor can see the result.
©Daffodil International University 3.4 Logical Data Model
In this Figure 3.4.1 is a Logical Data Model.
Patient and
Doctor Patients has:
Patient name
Daffodil International University
Figure3.4.1: Logical Data Model
is a Logical Data Model. Here have two people. Such as:
18 Such as:
©Daffodil International University
19
Sign Up the app
Sign In the app
Measurement BPM and shared result Doctor has:
Doctor name
See result
3.5 Design Requirement
I am designing my project by XML to design the app by layout, In JAVA I calculate the BPM and calculate result and In website design by using HTML, CSS, BOOSTRAP.
©Daffodil International University
20
CHAPTER 4
DESIGN SPECIFICATION
4.1 Front-end Design
The front-end is everything the patients can see on a mobile app. In this project I have used XML in the Front-end Design in the android application. In the website I have used HTML, CSS, JAVASCRIPT
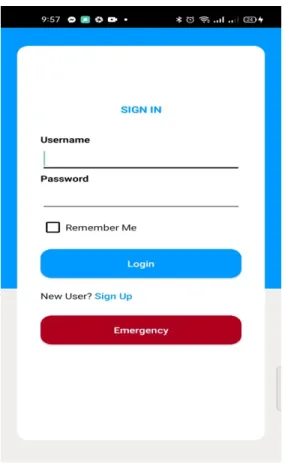
Sign In
Figure 4.1.1:Sign In
This is a Sign in for Design and Development of a mobile application: Blood Analysis.
Patient can see a login button. This activity will show Username and Password for login this app and they can show a button for going to another activity. If the patient forgets their password then they can sign up from Create New Account.
©Daffodil International University
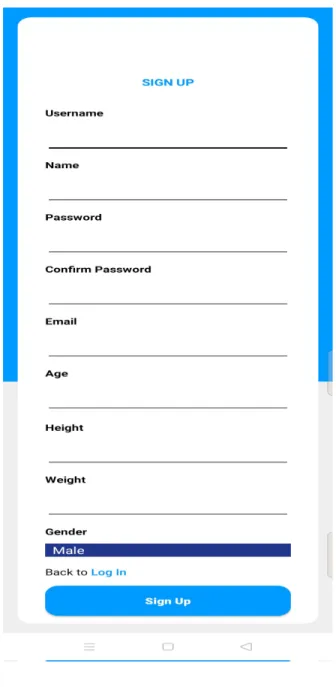
21 Sign up
Figure 4.1.2:Sign up
This is a Sign up for Design and Development of a mobile application: Blood Analysis.
Patient can see a Create New Account button. This activity will show Username, Name, Password, Confirm Password, Email, Age, Height, Weight, Gender for Create New Account this app and they can show a button for going to another activity.
©Daffodil International University
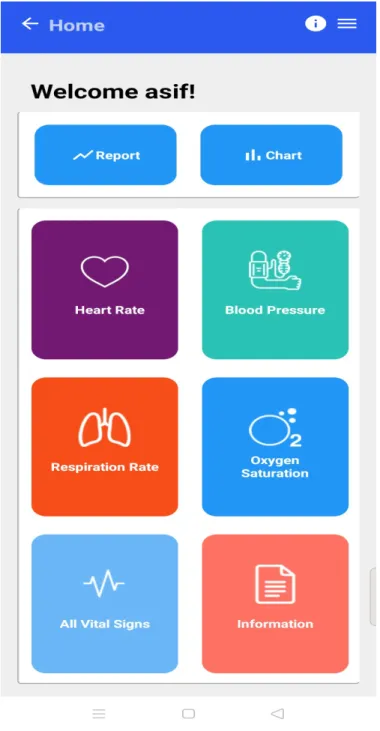
22 Home
Figure 4.1.3: Home
This is a I give 6 Choose type of Heart Rate, Respiration Rate, Blood Pressure, Oxygen Saturation, and All Vital Signs and I also give back, about, navigation bar button. Patient can see in this page.
©Daffodil International University
23 Heart Rate Instruction
Figure 4.1.4:Heart Rate Instruction
This is aInstruction for measurement of Heart Rate. Patients can see Instruction how to measurement of Heart Rate from the Instruction and click the Start Measurement button.
After pressing Start Measurement button, then it go to the Heart Rate process.
©Daffodil International University
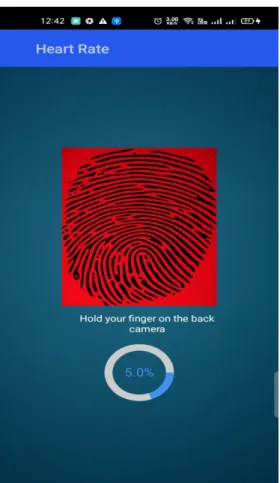
24 Calculate Heart Rate
Figure 4.1.5: Calculate Heart Rate
This is a calculate heart rate for measurement of heart rate activity. Here a camera is call SurfaceView and a prograssbar. Patient have to put their finger on the camera sensor then it calculates the bpm and show result in next activity.
©Daffodil International University
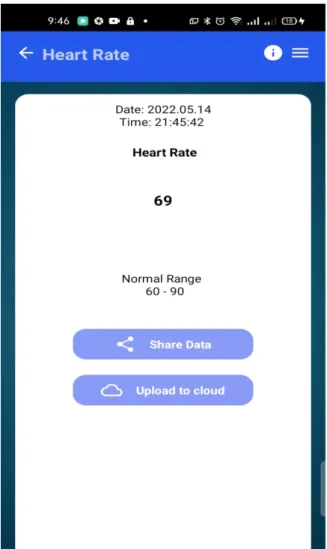
25 Heart Rate Result
Figure 4.1.6: Heart Rate Result
This is a heart rate result. In this activity have date and time, two button. One button is a Share data and another is a upload to cloud button. Patient can see their heart rate result in this activity and share the data via mail, drive, whatapps and website and the doctor can see this data from the website.
©Daffodil International University
26 Blood Pressure Instruction
Figure 4.1.7: Blood PressureInformation
This is aInstruction for measurement of Blood Pressure. Patients can see Instruction how to measurement of Blood Pressure from the Instruction and click the Start Measurement button. After pressing Start Measurement button, then it go to the Blood Pressure process.
©Daffodil International University
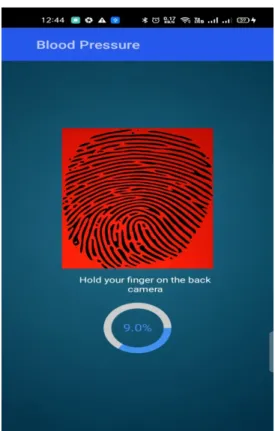
27 Calculate Blood Pressure
Figure 4.1.8: Calculate Blood Pressure
This is a calculate blood pressure for measurement of blood pressure activity. Here a camera is call SurfaceView and a prograssbar. Patient have to put their finger on the camera sensor then it calculates the blood pressure and show result in next activity.
©Daffodil International University
28 Blood Pressure Result
Figure 4.1.9: Blood Pressure
This is a Blood Pressure result activity. In this activity have date and time, two button.
One button is a share data and another is a upload to cloud button. Patient can see their blood pressure result in this activity and share the data via mail, drive, whatapps and blood analysis website and the doctor can see this data from the blood analysis website.
©Daffodil International University
29 Respiration Rate Instruction
Figure 4.1.10: Respiration RateInstruction
This is a Instruction for measurement of Respiration Rate. Patients can see Instruction how to measurement of Respiration Rate from the Instruction and click the Start Measurement button. After pressing Start Measurement button, then it go to the Respiration Rate process.
©Daffodil International University
30 Calculate Respiration Rate
Figure 4.1.11: Calculate Respiration Rate
This is a calculate respiration rate for measurement of respiration rate activity. Here a camera is call SurfaceView and a prograssbar. Patient have to put their finger on the camera sensor then it calculates the respiration rate and show result in next activity. If respiration rate is 12-20 then it is normal.
©Daffodil International University
31 Respiration Rate Result
Figure 4.1.12: Respiration Rate Result
This is a respiration rate result activity. In this activity have date and time, two button.
One button is a share data and another is a upload to cloud button. Patient can see their a respiration rate result in this activity and share the data via mail, drive, whatapps and blood analysis website and the doctor can see this data from the blood analysis website.
©Daffodil International University
32 Oxygen Saturation Instruction
Figure 4.1.13: Oxygen Saturation Instruction
This is aInstruction for measurement of Oxygen Saturation. Patients can see Instruction how to measurement of Oxygen Saturation from the Instruction and click the Start Measurement button. After pressing Start Measurement button, then it go to the Oxygen Saturation process.
©Daffodil International University
33 Calculate Oxygen Saturation
Figure 4.1.14: Calculate Oxygen Saturation
This is a calculate oxygen saturation for measurement of oxygen saturation activity. Here a camera is call SurfaceView and a prograssbar. Patient have to put their finger on the camera sensor then it calculates the oxygen saturation and show result in next activity.
©Daffodil International University
34 Oxygen SaturationResult
Figure 4.1.15: Oxygen Saturation
This is a oxygen saturation result activity. In this activity have date and time, two button.
One button is a share data and another is a upload to cloud button. Patient can see their a oxygen saturation result in this activity and share the data via mail, drive, whatapps and blood analysis website and the doctor can see this data from the blood analysis website. If oxygen saturation between 95 to 100 then it is normal.
©Daffodil International University
35 All Vital Signs Instruction
Figure 4.1.16: All Vital SignsInstruction
This is aAll Vital Signs Instruction for measurement of All Vital Signs. Patients can see Instruction how to measurement of All Vital Signs from the Instruction and click the Start Measurement button. After pressing Start Measurement button, then it go to the All Vital Signs process.
©Daffodil International University
36 Calculate All Vital Signs
Figure 4.1.17: Calculate All Vital Signs
This is a calculate all vital signs for measurement of all vital signs activity. Here a camera is call SurfaceView and a prograssbar. Patient have to put their finger on the camera sensor then it calculates the all vital signs and show result in next activity.
©Daffodil International University
37 All Vital Signs Result
Figure 4.1.18: All Vital Signs Result
This is oxygen saturation , heart rate, blood pressure and respiration rate result activity. In this activity have date and time, two button. One button is a share data and another is a upload to cloud button. Patient can see their a oxygen saturation , heart rate, blood pressure and respiration rate result in this activity and share the data via mail, drive,
©Daffodil International University
38 whatapps and blood analysis website and the doctor can see this data from the blood analysis website
Information
Figure 4.1.19:Information
This is a Information of Oxygen Saturation, Heart Rate, All Vital Signs, Blood Pressure and Respiration Rate button. Patient can see all information about Heart Rate, All Vital Signs, Respiration Rate, Blood Pressure and Oxygen Saturation when they click button.
©Daffodil International University
39 Emergency
Figure 4.1.20:Emagency
This is a emergency activity of Heart Rate, Blood Pressure button. Patient can measurement Heart Rate and Blood Pressure when they click button.
©Daffodil International University
40 Report
Figure 4.1.21: Report
This is a Report for the app. Patient can see their all the measurement types, rate, date and time from here.
©Daffodil International University
41 Chart
Figure 4.1.22:Chart
This is a chart for the app. Patient can see their all the measurement rate, types in this chart easily.
©Daffodil International University
42 About
Figure 4.1.23: About
This is a about for Design and Development of a mobile application: Blood Analysis.
Patient can see details about it.
©Daffodil International University Web Home Page
Daffodil International University
Figure 4.1.24: WebHome Page
43
©Daffodil International University
This is a home page of the website. Here patient and doctor can see all Information. They can see service, contact and download the app from the QR code by the blood analysis website.
Dashboard
This it is a dashboard of blood analysis heart rate bar chart, respiration r saturation bar chart.
Profile
Daffodil International University
This is a home page of the website. Here patient and doctor can see all Information. They service, contact and download the app from the QR code by the blood analysis
Figure 4.1.25:Dashboard
of blood analysis website, here Doctor or patient can , respiration rate bar chart, blood pressure bar chart and
Figure 4.1.26: Profile
44 This is a home page of the website. Here patient and doctor can see all Information. They service, contact and download the app from the QR code by the blood analysis
can easily see bar chart and oxygen
©Daffodil International University
This it is a profile of blood analysis website, Appointment serial number, date time, details activity.
Weight
This it is a Patient’s weight, here Doctor or patient’s can see Patient’s weight time.
Daffodil International University
This it is a profile of blood analysis website, here Doctor or patient’s can see Appointment serial number, date time, details activity.
Figure 4.1.27:Weight
it is a Patient’s weight, here Doctor or patient’s can see Patient’s weight
45 here Doctor or patient’s can see
it is a Patient’s weight, here Doctor or patient’s can see Patient’s weight, date and
©Daffodil International University Appointment
This it is a Patient’s Appointment, here Patient’s can see Patient’s name, Appointment time, doctor name treatment type and submit. Doctor and Patient’s can see appointment time and doctor name if patient
Daffodil International University
Figure 4.1.28:Appointment
it is a Patient’s Appointment, here Patient’s can see Patient’s name, Appointment time, doctor name treatment type and submit. Doctor and Patient’s can see appointment
and doctor name if patient can want to unsubmit all then he can.
46 it is a Patient’s Appointment, here Patient’s can see Patient’s name, Appointment time, doctor name treatment type and submit. Doctor and Patient’s can see appointment
©Daffodil International University 4.2 Back-end Design
The back-end is made up of a variety of elements that vary depending on the platform. I used to create my application. In addition, I establish a database in
system to store data that the server receives from users.
used it in django administration.
In the back-end various different tasks are performed for example data handling, third party system integration etc. The process of showing data is performed from the back end. In the back-end data is stored as Jason. After user connects with the real database the user receives updates with new data instantly since it is a real time database in our back-end I got all data of user and sessional information. The information about comment are also going to be stored here.
Administration
Daffodil International University
end is made up of a variety of elements that vary depending on the platform. I application. In addition, I establish a database in my website's backend system to store data that the server receives from users. For the building of my
used it in django administration.
end various different tasks are performed for example data handling, third party system integration etc. The process of showing data is performed from the back
end data is stored as Jason. After user connects with the real database the user receives updates with new data instantly since it is a real time database
end I got all data of user and sessional information. The information about t are also going to be stored here.
Figure 4.2.1:Administration
47 end is made up of a variety of elements that vary depending on the platform. I website's backend uilding of my website, I
end various different tasks are performed for example data handling, third party system integration etc. The process of showing data is performed from the back-
end data is stored as Jason. After user connects with the real-time database the user receives updates with new data instantly since it is a real time database end I got all data of user and sessional information. The information about
©Daffodil International University
This is a Administration, here store weight, doctor name, type, time, Appointment time.
Firebase:
This firebase is for used to store their Heart Rate result, Respiration Rate Pressure result, Oxygen Saturation result, types, date and time
registration of the users to sign in to their account. Here that patient and doctor can see realtime data.
the patient give their data for storage it synchronized in realtime to every connected patient.
Daffodil International University
is a Administration, here store weight, doctor name, type, time, Appointment time.
store their Heart Rate result, Respiration Rate
Pressure result, Oxygen Saturation result, types, date and time. I also used to store registration of the users to sign in to their account. Here I used firebase realtime database that patient and doctor can see realtime data.It is a NoSQL database online hosted.
the patient give their data for storage it synchronized in realtime to every connected
Figure 4.2.2:Firebase
48 is a Administration, here store weight, doctor name, type, time, Appointment time.
result, Blood I also used to store ebase realtime database hosted. When the patient give their data for storage it synchronized in realtime to every connected
©Daffodil International University
49 4.3 Interaction Design and User Experience (UX)
I use to work heart rate, oxygen saturation, all vital signs, respiration rate and blood pressure to calculate by java, xml and I have to need the camera sensor where patient’s put on their fingers. I am designing my android app by XML and I use JAVA for calculate BPM. I also use to HTML, CSS, JavaScript and BOOSTRAP for design the website.
4.4 Implementation Requirements
This app make it more useful and more user-friendly so I use xml, java in this app and I give some requirement in this app. It is:
User-friendly
Easy to Create Sign up
Easy to Excess
Easy to Manage
Easy to Use
Android Mobile
Permission Camera
Camera sensor
Prefect Light
©Daffodil International University
50
CHAPTER 5
IMPLEMENTATION AND TESTING
5.1 Implementation of Database
I had a user login to contribute to the app. I have used the MYSQL server.
5.2 Implementation of Front-end Design
I calculated BPM on the application. It is a XML, JAVA which is used by this app for the patients.
5.3 Testing Implementation
I tested this app, but I could not find any problem with it. In this app users give their name and password then login. Then they see a camera and they put their finger on this camera and calculate their blood rate by sensor. They can send the data to a website.
There are no problems with use.
©Daffodil International University
51 5.4 Test Results and Reports
I already tested this app and website, it runs 100 percent. There were no errors when that app and website is running.
Table 5.4: Test Results and Report Test Case Test Input Expected
Outcome
Obtained Outcome
Pass/Fail Tested On
Interface testing Testing in various android devices
Perfectly tested in various devices
App is
supported in all devices
Pass 22-2-2021
Application is not responding
Testing in various devices
Very rare not responding
Problem rate is very rare
Pass 26-2-2022
User Sign Up Required User Information
Successfully Registered
Successfully Registered
Pass 1-3-2022
User Sign In Username and Password
Successfully Sign In
Successfully Registered
Pass 1-3-2022
Password Wrong
Password
Wrong Password
Wrong Password
Pass 3-3-2022
Internet access permission
Connect through application
Connected Connected Pass 4-3-2022
Camera Permission
Camera Permission on
Camera on Camera on Pass 6-3-2022
Measurement of bpm by sensor
Put finger Calculated Calculated Pass 9-3-2022
Share Result Shared Result Shared Shared Pass 13-3-2022
©Daffodil International University
52
CHAPTER 6
IMPACT ON SOCIETY, ENVIRONMENT AND SUSTAINABILITY
6.1 Impact on Society
In our society, many people do not know how to solve rising heart rate. This app will show heart rate, information, oxygen saturation, all vital signs, blood pressure, instruction, respiration rate and patients can know if their oxygen saturation, blood pressure, heart rate, respiration rate is normal or abnormal. If their heart rate is abnormal then they can go to the doctor and take medicine.
6.2 Impact on Environment
It impacts the environment when they use this app. Many patent’s can solved their problem very quickly from use this apps. It helps to the patent of time saving and they can do another more work.
6.3 Ethical Aspects
These android application proposals allow the reduce patient suffering problem. Keep patient immediately check and immediately get result is my first priority. Many patient suffer from various kind of health issues and they have to do their regular check up. My app wishes to show accurate result while they are measurement. I also link to the safety data storage in Firebase. Anyone cannot hacking any data or stored another server, exchanged, through me. If the user gives any information, it verifies properly.
6.4 Sustainability Plan
My application and many patient need to be sustainable. Mainly the user patient needs to be regular and use for their immediate get result then my application will be more sustainable. I need my project can be updated in the future and I think huge people give me good support. My plan to give more measurement test and if anyone wants to work on it they can join with me.
©Daffodil International University
53
CHAPTER 7
CONCLUSION AND FUTURE SCOPE
7.1 Discussion and Conclusion
This application can help the patient to do their medical test at home. Today’s era most people use online doctor portal. So, they meet doctor virtually. For some test they need to go to clinic or medical. With this application they can send the test report to doctor instantly by self doing the test. I have added heart pulse, oxygen saturation, blood pressure, respiration rate test in this app. Patient need to put his finger on the back camera. This application computing the quantity of light absorbed by the finger tissue, It capture multiple image, do image processing to detect the red cell and complete the measurement.
7.2 Scope for Further Developments
I want to update my application in the future. I will add:
I will work to calculate diabetics rate.
I will work to calculate blood cell count.
I will work Blood group detection.
I will work to Blood disease detection.
©Daffodil International University
54
REFERENCES
[1] Valentine, S., Cunningham, A.C., Klasmer, B., Dabbah, M., Balabanovic, M., Aral, M., Vahdat, D. and Plans, D, “Smartphone movement sensors for the remote monitoring of respiratory rates: Technical validatio,” Digital health, vol.8, pp.2055, April 2022.
[2] Tabei, Fatemehsadat, Jon Michael Gresham, Behnam Askarian, Kwanghee Jung and Jo Woon Chong.
“Cuff-Less Blood Pressure Monitoring System Using Smartphones.” IEEE Access, vol.8, pp11534-11545, 2020
[3] De Ridder, B., Van Rompaey, B., Kampen, J.K., Haine, S. and Dilles, T, “Smartphone apps using photoplethysmography for heart rate monitoring: meta-analysis,”JMIR cardio, vol.2, pp.e8802, June 2018 [4] Liu, J., Shi, C., Chen, Y., Liu, H. and Gruteser, M, “Cardiocam: Leveraging camera on mobile devices to verify users while their heart is pumping,” In Proceedings of the 17th Annual International Conference on Mobile Systems, Applications, and Services, pp. 249-261, May 2019.
[5] Massaroni, C., Lo Presti, D., Formica, D., Silvestri, S. and Schena, E, “Non-contact monitoring of breathing pattern and respiratory rate via RGB signal measurement, vol.19, pp.2758, June 2019.
[6] Devaki V, Jayanthi T. “Pulse rate measurement using android smartphone,” IEEE Transl. International Conference on Wireless Communications Signal Processing and Networking (WiSPNET) , pp. 22-25, March 2019.
[7] Sabatini, A., Iannello, G., Pennazza, G., Santonico, M., Spinosa, M. and Vollero, L, “Heart Rate Analysis through Smartphone Camera,” IEEE International Workshop on Metrology for Industry 4.0 &
IoT, vol .2, pp. 402-406, June 2021.
[8] Wang, E.J., Zhu, J., Jain, M., Lee, T.J., Saba, E., Nachman, L. and Patel, S.N, “Seismo: Blood pressure monitoring using built-in smartphone accelerometer and camera,” In Proceedings of the 2018 CHI conference on human factors in computing Systems, pp. 1-9, April 2018.
[9] Luo, H., Yang, D., Barszczyk, A., Vempala, N., Wei, J., Wu, S.J., Zheng, P.P., Fu, G., Lee, K. and Feng, Z.P, Smartphone-based blood pressure measurement using transdermal optical imaging technology.
Circulation: Cardiovascular Imaging, vol.12, p.e008857, Augest 2019.
[10] Sabatini, A., Iannello, G., Pennazza, G., Santonico, M., Spinosa, M. and Vollero, L, “Heart Rate Analysis through Smartphone Camera. IEEE International Workshop on Metrology for Industry 4.0 & IoT, vol.2, pp. 402-406, June 2021.
©Daffodil International UniversityDaffodil International University
55
©Daffodil International UniversityDaffodil International University
56