CROP PLANT DISEASE DETECTION USING IMAGE PROCESSING BY
Rakib Mahmud ID: 201-25-860
This Report Presented in Partial Fulfillment of the Requirements for the Degree of Master of Science in Computer Science and Engineering
Supervised By
Md. Zahid Hasan Assistant Professor Department of CSE
Daffodil International University
DAFFODIL INTERNATIONAL UNIVERSITY
DHAKA, BANGLADESH JUNE 2021
ii
©Daffodil International University
APPROVAL
This Project titled “Crop Plant Disease Detection using Image Processing”, submitted by Rakib Mahmud, ID NO 201-25-860 to the Department of Computer Science and Engineering, Daffodil International University, has been accepted as satisfactory for the partial fulfillment of the requirements for the degree of M.Sc. in Computer Science and Engineering and approved as to its style and contents. The presentation has been held on 3th June 2021.
BOARD OF EXAMINERS
________________________
Dr. Touhid Bhuiyan Professor and Head
Department of Computer Science and Engineering Faculty of Science & Information Technology Daffodil International University
Chairman
________________________
Dr. Md. Ismail Jabiullah Professor
Department of Computer Science and Engineering Faculty of Science & Information Technology Daffodil International University
Internal Examiner
iii
©Daffodil International University ________________________
Dr. Sheak Rashed Haider Noori
Associate Professor and Associate Head
Department of Computer Science and Engineering Faculty of Science & Information Technology Daffodil International University
Internal Examiner
________________________
Dr. Shamim H Ripon Professor
Department of Computer Science and Engineering East West University
External Examiner
iv
©Daffodil International University
DECLARATION
I hereby declare that, this project has been done by m under the supervision of Md. Zahid Hasan, Assistant Professor, Department of CSE Daffodil International University. I also declare that neither this project nor any part of this project has been submitted elsewhere for award of any degree or diploma.
Supervised by:
Md. Zahid Hasan Assistant Professor Department of CSE
Daffodil International University
Submitted by:
Rakib Mahmud ID: 201-25-860 Department of CSE
Daffodil International University
v
©Daffodil International University
ACKNOWLEDGEMENT
First we express my heartiest thanks and gratefulness to almighty God for His divine blessing that makes it possible to complete the final year project successfully.
We really grateful and wish our profound our indebtedness to Md. Zahid Hasan, Assistant Professor, Department of CSE Daffodil International University, Dhaka. Deep Knowledge & keen interest of our supervisor in the field of “Image Processing” to carry out this project. His endless patience ,scholarly guidance ,continual encouragement , constant and energetic supervision, constructive criticism , valuable advice ,reading many inferior draft and correcting them at all stage have made it possible to complete this project.
We would like to express our heartiest gratitude to Professor Dr. Touhid Bhuiyan, Professor &
Head, Department of CSE, for his kind help to finish our project and also to other faculty member and the staff of CSE department of Daffodil International University.
We would like to thank our entire course mate in Daffodil International University, who took part in this discuss while completing the course work.
Finally, we must acknowledge with due respect the constant support and patients of our parents.
vi
©Daffodil International University
ABSTRACT
Our country depends greatly on the crop for its economy and to meet food needs. It is important to detect any disease in time to ensure healthy and proper growth of crop plants and before applying necessary treatment on the affected plants. Since the manual identification of the disease is much time and labor costs, so it is inevitably wise to take automatic system. The automatic method requires a towering lot of work, Plant diseases require efficiency and excessive processing time.
In this project, the disease detection systems of rice leaves and various other plants and fruits presented using image processing. Most crop and fruit tree diseases such as Cercospora, leaf smut, bacterial blight, and Leaf Spot diseases are identified in this work. Hence, Steps such as detect the disease are involves image collection, image noise, and object removal prepared for pre-processing techniques, Using K-means clustering for segmentation and RGB to HIS, Color co-occurrence Strategy for Feature extraction then classified by utilizing SVM. This paper outlines the methods used to detect diseases in plant by identifying pictures of their leaves.
vii
©Daffodil International University
TABLE OF CONTENTS
CONTENTS PAGE
Board of examiners ii
Declaration iv
Acknowledgements v
Abstract vi
Table of Contents vii
List of Figures x
List of Tables x
CHAPTER
CHAPTER 1: INTRODUCTION
1-21.1 Introduction 1
1.2 Motivation 1.3 Objectives
1 2
1.4 Expected Outcome 1.5 Report Layout
2 2
CHAPTER 2: BACKGROUND
3-62.1 Introduction 3
2.2 Related Work 2.3 Challenges
3 5
viii
©Daffodil International University
CHAPTER 3: MATERIALS AND METHODS
7-11
3.1 Working Process 7
3.2 Image Acquisition 8
3.3 Image Pre-processing 8
3.4 Image Segmentation 9
3.5 Feature Extraction 3.6 Training & Classification
11 11
CHAPTER 4: EXPERIMENTAL AND RESULTS
4.1 Experimental 4.2 Result
4.3 Comparative Analysis
12-13 12 12 13
CHAPTER 5: CONCLUSION AND FUTURE WORK
145.1 Conclusion 14
5.2 Future Work 14
REFERENCES
15-16PLAGIARISM REPORT
17ix
©Daffodil International University
LIST OF FIGURES
FIGURES PAGE NO
Figure 1: Final result of Three Feature 4
Figure 2: Original images of infected rice leaves 5
Figure 3: Segmented Images Corresponding to Fig.2 5
Figure 4: Framework of the proposed system 7
Figure 5: Original image of diseased crop and fruit leaf 8 Figure 6: Contrast enhanced and RGB gray transformation leaf image 9 Figure 7: Diseased Crop leaf image clusters
Figure 8 : Diseased Fruit leaf image clusters Figure 9 : Rice plant disease detection result
10 10 12
x
©Daffodil International University
LIST OF TABLES
TABLES PAGE NO
Table 1: Comparative analysis 13
1
©Daffodil International University
CHAPTER 1 Introduction
1.1 Introduction
Bangladesh achieved its highest GDP, BDT 11.02 billion in 2020[1], from the agricultural sector.
Half of the agricultural GDP is supplied through rice production. As a result, it also contributes about half to agricultural employment (48%) [2]. Providing an important role in the economy of the country, rice provides staple food to the masses and two-thirds of the daily caloric intake per capita. The whole rice yields range and corresponding production are estimated to be According to the USDA report, 11.8 million hectares in the whole rice yields and 35.3 million metric tons for the corresponding production is an estimate in 2020-2021 (May to April) [3].According to the USDA, Proper paddy plantation in future may get a priority for Bangladesh, because economic changes clearly shown and this information demonstrates this report. Disease free paddy plantation will play an effective role in ensuring stable economic processes and maintaining specific goals.
Bangladesh must work for industrial progress to stay at pace with the fourth technology revolution.
Through which Bangladesh can engage smart systems for industrial progress and which will take the right decision without human intervention. An automatic system, which automatically disease identifies the system and will classify the disease from the leaves.
1.2 Motivation
One of the reasons for the decline in quality and quantity is plant diseases of agricultural crops.
The overall production of the crop may be affected in a country when quality and quantity decline.
The main problem for plants is the lack of continuous observation. Newbie farmers in particular are not aware of these diseases and the timing of their occurrence. Usually in any plant, at any time disease can occur. Can prevent the transmission of the disease, only through continuous monitoring. A survey conducted in 1979-1981 revealed twenty diseases in rice [4]. Disease monitoring, very important are their frequencies and occurrences for early identification of
2
©Daffodil International University
infected trees. Timely treatment of them, and importantly, to plan future strategies for disease prevention to reduce losses.
1.3 Objectives
The aim of this study is to, Identification of plant diseases by image-processing based solutions in implementation and evaluation.
Helps the farmer to diagnose diseases and take action on damaged plants.
Increase in quality and quantity of agricultural crops.
1.4 Expected Outcome
The purpose of the project is all about disease detection. Giving newbie farmers ideas about plant diseases through automatic disease detection by image processing techniques. How to diagnose early disease and give timely treatment. To increase crop production by taking care of trees in time.
1.5 Report Layout
Chapter 1 presents the research introduction, objectives, and key research questions.
Chapter 2 highlights a detailed review of the related literature.
Chapter 3 describes the proposed methodology with detailed description.
Chapter 4 explains the result analysis and comparison with existing work.
Chapter 5 concludes the present research along with a direction for future work.
3
©Daffodil International University
CHAPTER 2 Background
2.1 Introduction
My paper is based on image processing. As a plant disease detection, this project developed in Matlab R2015a. We perform image segmentation to identify diseased areas. And standard feature extraction techniques are used to extract properties from segmented regions. In the end, Image Features Uses Multiclass Support Vector Machine (SVM) classification which is used for classification and identification of various diseases. Used Matlab language.
2.2 Related Work
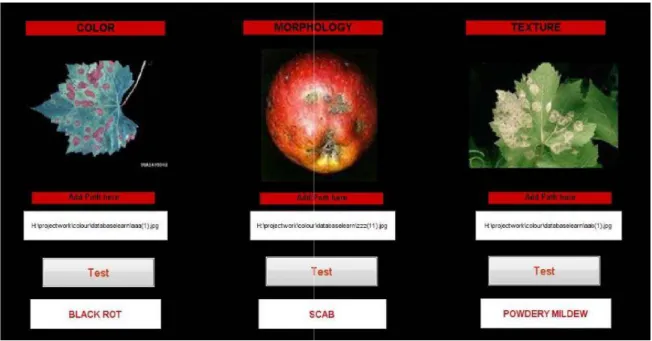
J. Monica identifies disease and fruit grading using image processing. Used artificial neural networks to detection the disease. Created two databases separately, Images of the disease are stored in a database for training and another database, to implement query images. Training databases of Back propagation is use for weight adjustment. Color, texture, and morphology consider these three characteristic vectors. [5]. The following figure 1 is about the final result of three features. The spread of the disease is done using the K-mean clustering method which is similar to our project.
4
©Daffodil International University
Figure 1 :Final result of Three Feature
RGB images are used to identification the disease. To identify the green pixels and then obtain different threshold values using Otsu's method, K-means clustering techniques are applied before these tasks are performed. The color co-occurrence method is used to extract features. The HSI translation has been converted from the RGB image. The SGDM matrix is generated and the feature is calculated using the GLCM function to computation the texture statistics. [6].
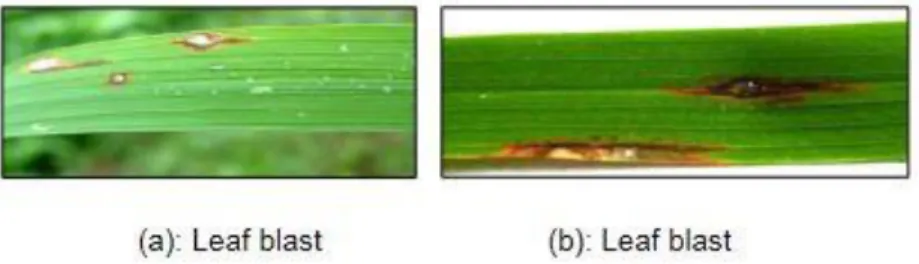
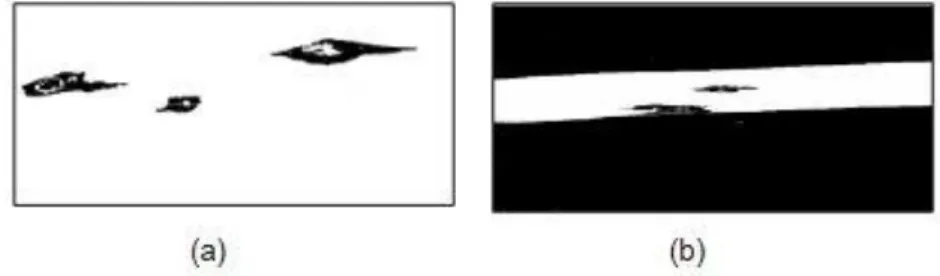
For rice disease detection, Jaya and Shantanu has used pattern recognition techniques [7]. A software prototype is described in this paper which detects rice disease on the basis of infected images of rice plants. After searching the area of interest, HIS used the model to segmentation the image. By identifying the borders and spots, the infected part of the leaf is detected. The following figure 2 and 3 is about infected rice leaves to segmentation of the image.
5
©Daffodil International University
Figure 2: Infected rice leaves
Figure 3: Segmented Images Corresponding to Fig.2
DSLR camera were used to capture RGB images of plant with varying degrees of canopy reduction. Multiple spectra of high-spatial resolution satellites are then used to indicate the severity of the disease or canopy reduction in the upper, middle and lower limits of the trees. A disease called powdery mildew occurs on cherry leaves. An algorithm proposed [8] to diagnose this disease is to remove the background from the image. The diseased part is extracted using morphological operators and intensity-based thresholds. Here is a description of image processing- based methods and color sensitivity, which are used to detect the severity of foliar disease in plants.
This foliar disease occurs in soybean plants [9].
2.3 Challenges
a. Image Collection: Not easy to find out good resolution crop plant image. Therefore, collecting image data from the UCI [10] and QUAYES Agricultural Supplies [11].
6
©Daffodil International University
b. Raw Image Processing: Images collected from different sources were sometimes low or high contrast or noisy. So, the challenge is to organize the pictures perfectly for classification which can be contrast-enhanced and noise-free.
c. Select Machine Learning Approach: Several researchers use different machine learning techniques to finish the work effortlessly. Thus, the selection of the best machine learning techniques can accurately classify different types of crop plant diseases.
7
©Daffodil International University
CHAPTER 3
MATERIALS AND METHODS
3.1 Working Process
The proposed system through the block diagram is shown below fig.4.
Fig.4 Framework of the proposed system
The proposed method includes a database collection of leaf and fruit images, Image pre- processing, Image segmentation is done by using the K-means clustering method. Feature are
Image
Acquisition Image
Pre-processing
Image Segmentation
Feature Extration
Training &
Classification Recognition
8
©Daffodil International University
extracted using the GLCM (gray layer co-presence matrix) method and the system is trained using the SVM algorithm.
3.2 Image Acquisition
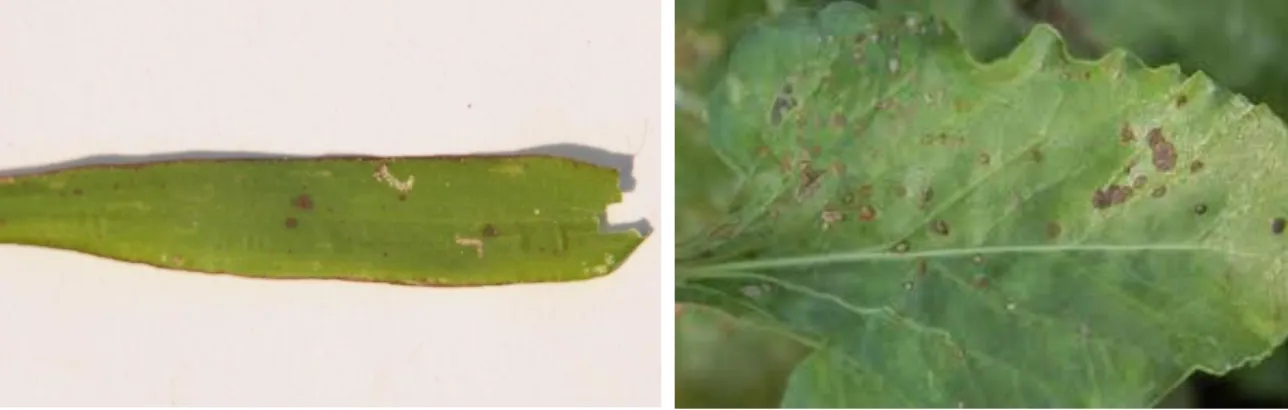
For Matlab activities, it captures images stored in digital media and describes them as image capture with a digital camera, and some of the images acquired are the first method of image processing. In our work, we collected the image from UCI [11] and QUAYES Agricultural Supplies [12]. Healthy images of crops and fruit leaves are shown in fig.5, which will be used for the Matlab image processing system.
Fig. 5 Pictures of diseased fruits and crop leaves
3.3 Image Pre-processing
Further processing to enhance the properties of some images or strengthen image data for those who are unintentionally distorted these are the main objectives of image pre-processing. Various techniques are used in pre-processing methods, including image conversion, morphology
operations, noise filtering, image enhancement, image resizing and shaping. RGB grayscale
9
©Daffodil International University
conversions are shown in fig. 6. We've used different Matlab codes to resize images, reinforce contrast, RGB to grayscale conversions.
Fig.6 Contrast enhanced and RGB gray transformation leaf image
3.4 Image Segmentation
For easy analysis, how to render an image to something and the transformation of the digital image into several sections is called image segmentation. Image segmentation is used to identify objects in an image and to identify boundary lines. The input RGB image is divided into three sections by the segmentation algorithm. Like the original image, the RGB is also present in each section in color-space and shape. Each section has different areas of the original image where there is an area of interest and that is part of the original image disease. K-means the clustering algorithm is used to classify objects based on a set of properties within the number of classes. The squares of the distance between the corresponding clusters and the classification of objects are reduced by the sum of the objects. Algorithm for K–means clustering determining the center of a cluster, either randomly or on some heuristic basis, defining each pixel in the image is a cluster that reduces the distance between the pixels and the cluster. Repeat the previous two steps until integration is done and before that count, the cluster centers with the average of all the pixels in the cluster. Algorithm for input image division using K-means clustering. l* a* b* will be converted to colour space from
10
©Daffodil International University
input image RGB colour space. From the image in L*a*b* colour-space, extract a* b* chroma components. Three clusters can be found by applying K-mean clustering to chroma elements.
Three clusters back into the three-segmented RGB image. Fig.7 and Fig.8 respectively shows the crop leaves image and fruit leaves image segmentation by three clusters format and shown the area of interest.
Fig.7 clusters of diseased crop leaves
Fig.8 clusters of diseased fruit leaves
11
©Daffodil International University 3.5 Feature Extraction
There are three sections in RGB color space after the splitting process. The area of interest is where one of the segments has the diseased part. The affected part has to be selected from the visual inspection of the three sections. This part of the system requires user intervention because the system is not automated in this part. The system will look for the characteristics of the diseased parts, when the user selects the affected parts. Mean, standard deviation, entropy, inverse difference, variance, smoothness, kurtosis, skewness, and root mean square (RMS) These 9 characteristics are determined from the diseased part in the RGB color space. After converting the disease-affected section into a grayscale intensity figure, the characteristics of contrast, correlation, energy, and homogeneity are determined.
3.6 Training & Classification
We use Support Vector Machine (SVM) for disease recognition. Use the radial basis kernel function (Gaussian kernel) and libsvm library for classification. For multiclass classification, kernel functions are commonly used. We created a multiclass SVM model, first we trained for sample leaves with pre-defined characteristics of diseased leaves and healthy leaves. Each type of diseases affected leaves belong to one separate class and there is a class of healthy leaves. Using the Multiclass SVM model, we build the data for a set of training sample images and save it in a file. At the test phase, the system must look for the disease class in a leaf image. First, we segment the test image and choose the region of interest (ROI), then we compute its feature vector. Finally, we pass this information to the classifier. The Multiclass SVM classifier compares the feature vector of ROI of an unknown test image with the pre-built database. Based on the best match, it predicts the disease class of the test image.
12
©Daffodil International University
CHAPTER 4 Experimental & Results
4.1 Experimental
The proposed algorithm is applied to a data set of 125 images. A total of 125 images, all divided into two sets, training and test sets. The data set five types of leaves, one type is of healthy leaves and four types of leaves with diseases namely Bacterial leaf Blight, Cercospora Leaf Spot, Leaf smut and Anthracnose. Test accuracy of classification is 96.7742%.
4.2 Result
The results of the leaf disease detection are as follows:
Fig.9 Rice plant disease detection result
13
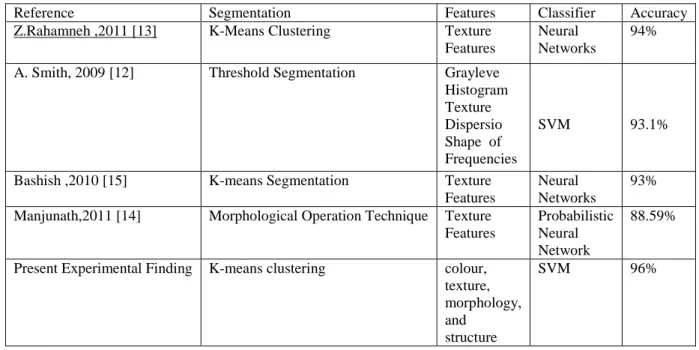
©Daffodil International University 4.3 Comparative Analysis
The paper needs to be equated with recently published papers to measure its significance. For this reason, some of its components are compared with other research works which are shown in Table I.
Plant disease detection through different machine learning techniques such as SVM [12]. Feature Extraction Shape, Texture, Dispersio, Grayleve, Histogram and to achieve 93.1% accuracy.
Whereas Neural Networks to achieve approximately 94% accuracy[13]. In another research work, is described through Probabilistic Neural Network. The overall accuracy rate was 88.59% achieved in this study [14]. According to this study [15], the Neural Networks model with an accuracy of 93%.
TABLE I. COMPARATIVE ANALYSIS
Reference Segmentation Features Classifier Accuracy
Z.Rahamneh ,2011 [13] K-Means Clustering Texture Features
Neural Networks
94%
A. Smith, 2009 [12] Threshold Segmentation Grayleve Histogram Texture Dispersio Shape of Frequencies
SVM 93.1%
Bashish ,2010 [15] K-means Segmentation Texture
Features
Neural Networks
93%
Manjunath,2011 [14] Morphological Operation Technique Texture Features
Probabilistic Neural Network
88.59%
Present Experimental Finding K-means clustering colour, texture, morphology, and
structure
SVM 96%
14
©Daffodil International University
CHAPTER 5
CONCLUSION AND FUTURE SCOPE
5.1 Conclusion
The present study discusses crop and fruit image processing techniques related to automatic diagnosis with plant leaf detection. It involves image acquisition, image sorting, feature extraction, image preprocessing and classification. The development of automated detection systems using advanced computer technology to assist farmers in early detection of diseases and to provide useful information for its control We would like to further enhance our work in detecting more tree diseases.
5.2 Future Scope:
Accuracy can be enhanced by improving the classification of datasets and changing feature extraction techniques, and increasing the techniques of image processing and classification, which we plan to do in the future.
15
©Daffodil International University
REFERENCES
[1] “Bangladesh GDP from agriculture.” https://urlzs.com/3xaEg. Accessed: 2021-05-24.
[2]Farhana, Asrafhun, Tahmina, and Tania “Factors determining the profitability of rice farming in Bangladesh, https://urlzs.com/Z5QuF, vol. 17, no. 1, pp. 86–91, 2019.
[3] “Usda: Rice output continues to see growth.” https://urlzs.com/jb9wo. Accessed: 2021-05-5.
[4] N. Sharma and S. Miah “A survey of rice diseases in Bangladesh,” https://urlzs.com/31dQe, vol. 31, no. 3, pp.
208–213, 1985.
[5] J. Monica , K. Ashwani, and B. Rushikesh , “Image Processing For Smart Farming: Detection Of Disease And Fruit Grading”, https://urlzs.com/LM6Zu , pp.521-526, January 2014.
[6] B. Malik, R. Mohammed, A.B. Suleiman, A.H. Heba , “Fast and Accurate Detection and Classification of Plant Diseases”, https://urlzs.com/KV1Hm, March 2011.
[7]S. Jaya and P. Santanu, “Rice Disease Identification using Pattern Recognition”, https://urlzs.com/gLXND, 2008, Khulna, Bangladesh.
[8] J.B, Gupta and Travieso “Automated segmentation of powdery mildew disease from cherry leaves using image processing”. https://urlzs.com/ygHKD , 2017; 1-4.
[9]S.H. Dhara, K.S. satish and Shrivastava “Color sensing and image processing-based automatic soybean plant foliar disease severity detection and estimation”. https://urlzs.com/YY7B3 , September 2014.
[10] Rice Leaf Diseases Data Set . https://urlzs.com/aRJow , Accessed: 2021-05-27.
[11] QUAYES Agricultural Supplies.http://www.agri971.yolasite.com/. Accessed: 2021-05-5.
[12] A. Smith and Camargo 2009. An image-processing based algorithm to automatically identify plant disease visual symptoms. https://rb.gy/zthybl, Biosystems Engineering, 102: 9 – 21.
[13] Z. ALRahamneh ,H., S. Bani-Ahmad, Al-Hiary and M. Reyalat 2011. Fast and Accurate Detection and Classification of Plant Diseases. https://urlzs.com/7iHok, International Journal of Computer Applications (0975 – 8887) Volume 17– No.1, March 2011.
16
©Daffodil International University
[14] S. Mallikarjuna, Manjunath and Guru 2011. Segmentation and Classification of Tobacco Seedling Diseases.
https://urlzs.com/FsVkW, Accessed: 2021-05-25.
[15] B.A. Suleiman, B. Malik and A.B. Dheeb 2010. Frame work for detection and classification of plant leaf and stem diseases. https://urlzs.com/Focy5 Accessed: 2021-05-27.
17
©Daffodil International University
PLAGIARISM REPORT
18
©Daffodil International University