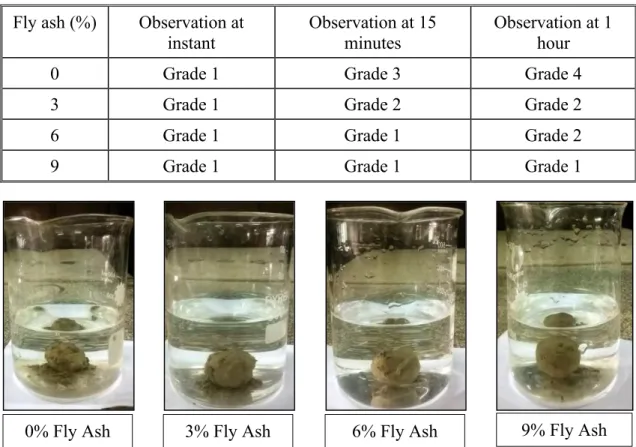
The crumb test shows that the dispersibility of the soil is reduced by the addition of different percentages of fly ash content. The microstructure of treated soil with fly ash shows that the voids between the soil particles become smaller.
LIST OF TABLES
LIST OF ABBREVIATIONS
Chapter One INTRODUCTION
General
Visual classification such as Atterberg's limits and particle size analysis do not provide a sufficient basis for distinguishing between dispersive clays and ordinary erosion-resistant clays (Umesha et al., 2011; Fattah et al., 2014; Maharaj et al., 2015; Ismael et al., 2015). , 2021). In the last few decades, several researches and studies have been carried out by scientists to eradicate and stabilize the dispersive ability of dispersive soil.
Background of the Study
Therefore, in this thesis, the effects of adding different percentages of coal fly ash (pozzolan) to spread soils available in Bangladesh with different drying times were investigated. In the past, the use of such soils was not recommended at all, but nowadays the improvement of dispersive soils is highly recommended due to the increasingly frequent construction of earthen structures and the uneconomical replacement of dispersive soils with borrowed non-dispersive soils (Belarbi et al., 2013; Ashraf and Islam, 2018; Faruk et al. ., 2019).
Objectives of the Research
When the results obtained were as expected, the same test was performed on the sample mixed with 3%, 6% and 9% fly ash (w/w). An improvement in the micro level of soil particles is observed at all percentages of fly ash mixed with dispersive soil (3%, 6% and 9% by weight).
Chapter Two
LITERATURE REVIEW
Introduction
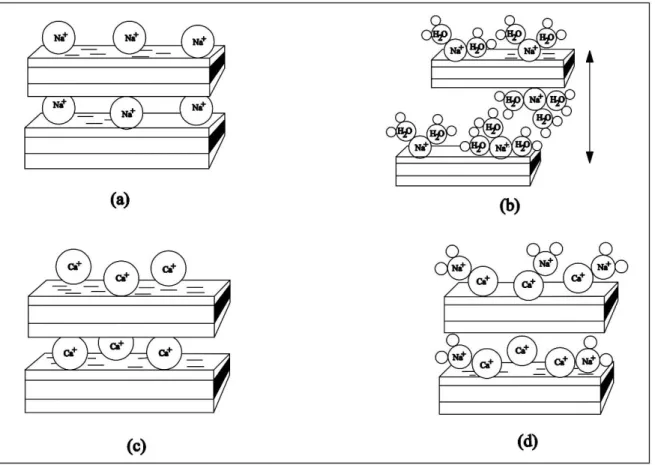
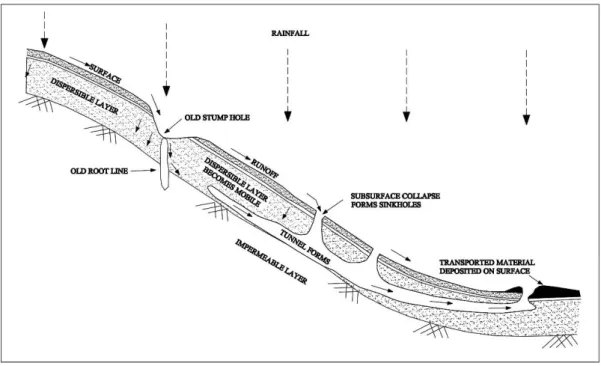
Origin of Dispersive Soils
These failures draw attention to the importance of early identification and recognition of dispersive clay soils. Therefore, a comprehensive study is required for the identification of dispersive soil, problems and improvement of soil engineering properties using different soil stabilization procedures (Faulkner, 2006; Abbaslou et al., 2016).
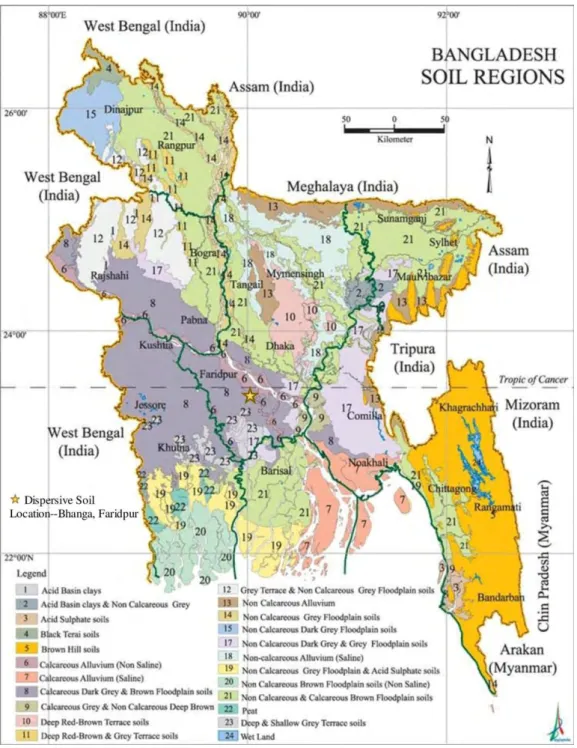
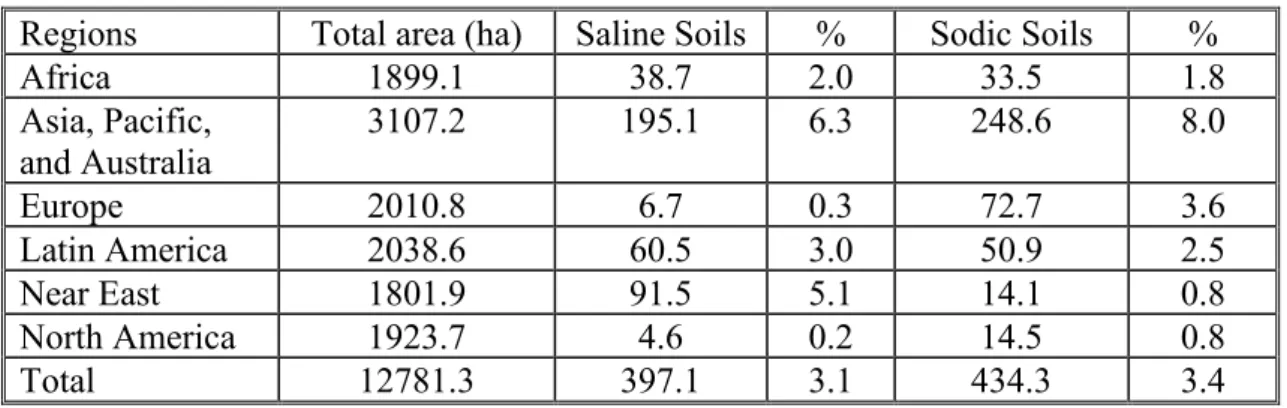
Extent of Dispersive Soils
- Stabilization with Fly Ash
- Effect of Other Stabilizers on Dispersive Soil .1 Lime Stabilization
- Stabilization with ZELIAC
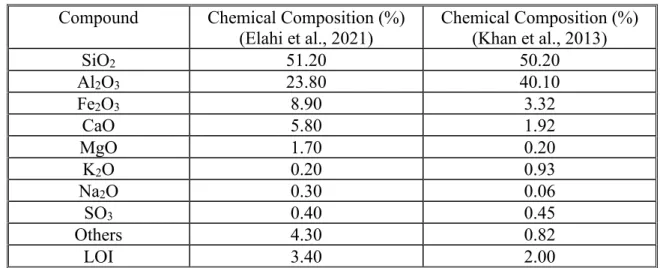
In the present research, changes in dispersive potential and other properties of dispersive soil samples were investigated with pozzolanic fly ash. Qualitative analysis shows that fly ash from BTTP coal in Bangladesh is classified as class F fly ash (Tamim et al., 2013).
Past Researches
The amount of dispersion decreased with the addition of 5% lime and 2% lime + 15% fly ash mixture. The researchers used lignite fly ash with lime as a secondary binder to stabilize the scattered soils. The test results obtained showed that lignite fly ash effectively reduces the spreading power of the soil by adding lime (Premkumer et al., 2016).
Some researchers found that fly ash did not cause significant changes in the distribution of dispersed soil. However, the addition of lime with fly ash causes changes in the dispersive properties (Rani et al., 2017). It was revealed that only the use of fly ash in different percentages significantly reduced the spreading power of the soil. 2019) attempted to stabilize the dispersed soil with bioengineering methods.
As such, fly ash is considered as one of the suitable and sustainable construction materials in Bangladesh (Elahi et al., 2021).
Summary
Chemical stabilization was very popular among researchers using alum, cement, fly ash, gypsum, polymers, ZELIAC, etc. Therefore, the commercial use of fly ash in construction works will open a new horizon for waste management and a pollution-free environment. It was noted that some research was done on the distribution land, which is available in Bangladesh.
The use of fly ash for dispersive soil stabilization has had a mixed response. 2007) stated that the addition of fly ash alone does not significantly reduce dispersion. On the other hand, Elahi et al. 2021) found fly ash to be a suitable and sustainable building material in Bangladesh. Therefore, available fly ash in Bangladesh is considered to determine the strength characteristics of distributive soil.
Chapter Three
- Introduction
- Materials
- Dispersive Soil Sample
- Fly Ash
- Test Methods
- Atterberg Limit Test
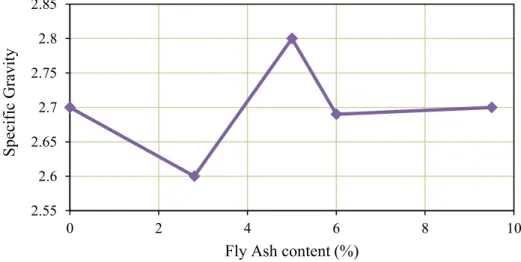
- Specific Gravity Test
- Crumb Test
- Crumb Test Procedure
- Double Hydrometer Test
- Double Hydrometer Test Procedure
- Double Hydrometer Test Result Criteria
- Pinhole Test
- Pinhole Test Procedure
- Pinhole Test Result Criteria
- Chemical Test
- Scanning Electron Microscopy
- Unconfined Compression Test
- Sample Preparation for Unconfined Compression Test
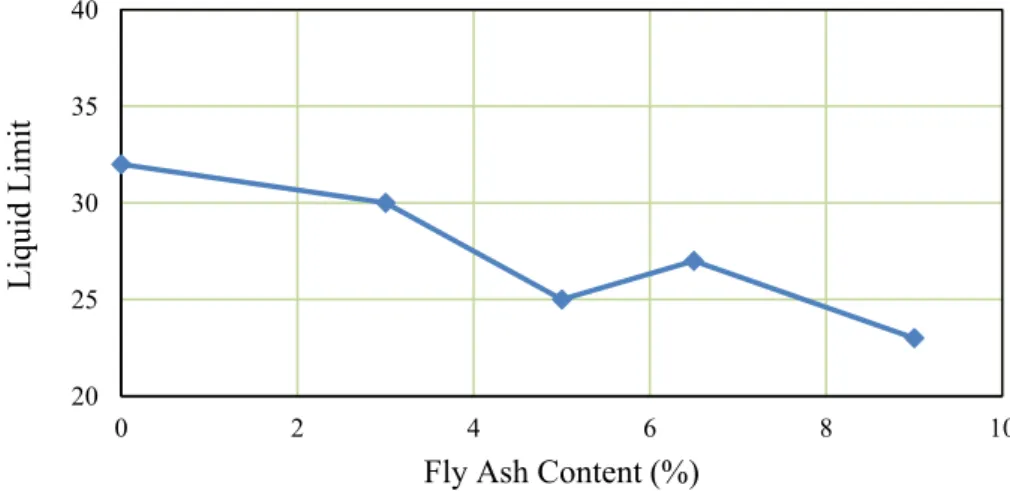
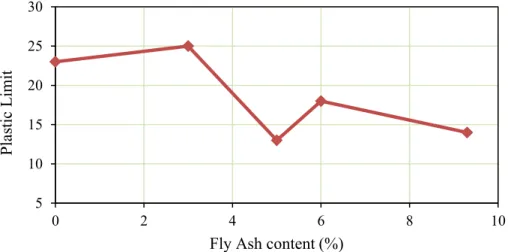
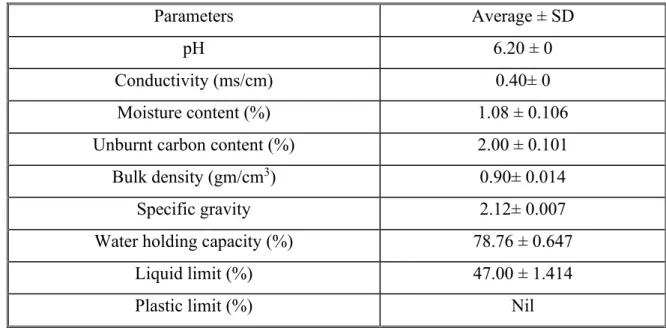
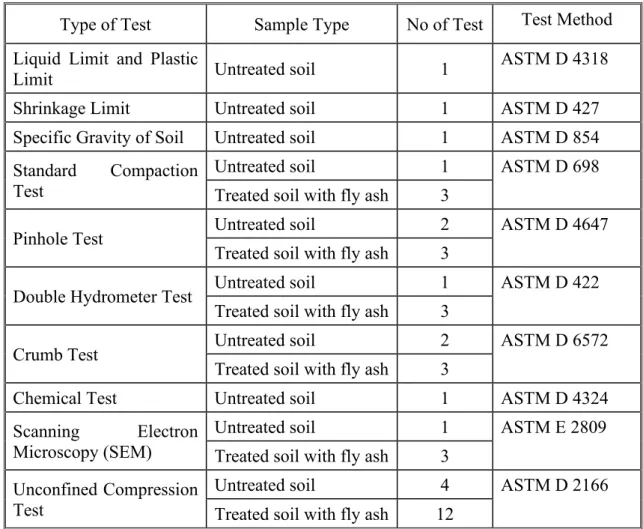
Properties of the fly ash used in this investigation are given in Table 4.2 of Chapter 4. The Standard Test Procedure followed to determine the properties of the soil is given in Table 3.1. Plasticity index (PI) is the size of the range of water contents where the soil exhibits plastic properties.
In this study, the specific gravity test provided an important parameter of the soil sample, and the result was used to calculate the percent dispersion in the double hydrometer test. The Drobta test is a relatively accurate positive indicator of the presence of dispersivity in the soil. When this test is performed in conjunction with the ASTM D 422 Standard Hydrometer Test Method on the same soil sample, this test method indicates the natural dispersivity of the soil sample.
Boiling is done to extract the pore water from the saturated slurry of the soil sample.
Chapter Four
RESULTS AND DISCUSSIONS
Introduction
Index Properties of Untreated Dispersive Soil
- Engineering Properties According to Index Parameter
According to Table 3.6, the value falls in the range of 16-35, which means that the soil is plastic in nature, has medium to high dry strength and is difficult to crush. The plasticity index (PI) also indicates that the soil is extremely fine. 4) The resistance index is the ratio of the plasticity index (PI) to the flow index (IF) of the soil. The results give an idea of the shear strength of the soil at its plastic limit.
The soil's toughness index is 1.5, which indicates that the soil contains a low percentage of colloidal clay containing the mineral kaolinite.
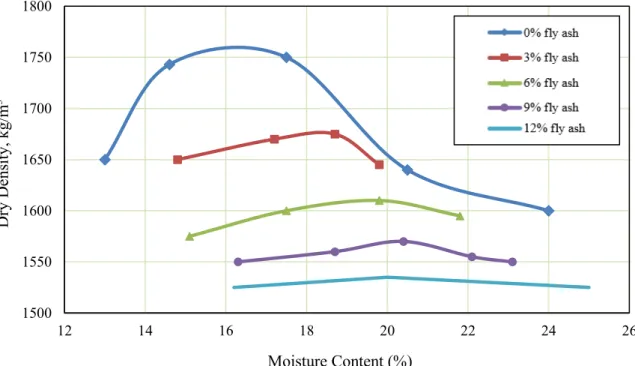
Compaction Test
- Crumb Test
- Double Hydrometer Test
- Pinhole Test
- Chemical Test
These tests are conducted to predict the effectiveness of fly ash in reducing soil emissions. Finally, based on all observations, the soil can be considered moderately to highly dispersed. The results obtained from the tests are based on the observation of the turbidity of the collected water and the flow rate as discussed in section 3.9.2.
In addition, the enlargement of a hole with a diameter of 1 mm inside the soil sample is subsequently measured to evaluate the test results according to ASTM D 4647. From the chemical test, the amount of sodium, calcium, magnesium and potassium is obtained in ppm (parts per million) units is given in table 4.7. ESP values must be converted to meg/100 g soil, as cation exchange capacity (CEC) is expressed as meg/100 g soil.
From the periodic table of elements, the atomic weight of calcium, magnesium, potassium and sodium is 23 and 23 respectively.
Variation of Degree of Dispersion of Soil Sample
Stabilization of Dispersive Soil with Fly Ash
- Double Hydrometer Test with Fly Ash
- Pinhole Test with Fly Ash
The crumbling tests were carried out for the soil samples mixed with 3%, 6% and 9% fly ash (w/w) content. That is why the treated soil is called Grade 2. 3) The crumb of the soil sample stabilized with 6% fly ash shows no reaction immediately. That is why the treated soil is called Grade 2. 4) The crumb of the soil sample stabilized with 9% fly ash does not show turbidity after 1 hour.
Double hydrometer tests are carried out for the spread soil treated with fly ash content of 3%, 6% and 9%. In addition, Figure 4.12 shows variations in the percentage of dispersion with fly ash content. The tests show that the addition of fly ash improves the properties of the spread soil.
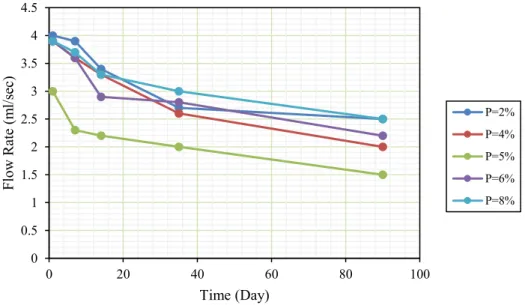
This study performed pinhole tests on treated soil samples prepared with 3%, 6%, and 9% fly ash content.
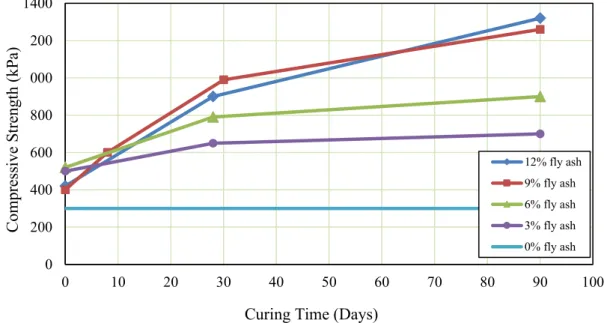
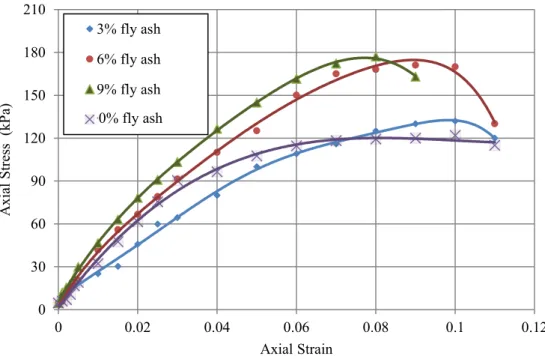
Unconfined Compression Test Results
This means that the strength of the soil sample is reduced with the increase in fly ash content by more than 9%. Therefore, the treated soil sample with fly ash exhibits more brittleness than the untreated soil sample. Although adding fly ash increases strength, adding a higher percentage of fly ash, 9%, results in a reduction in failure load.
Variations of the fracture strain with fly ash content and curing age are shown in table 4.14. The results show that the breaking strain decreases with the increase in curing age, and the breaking strain decreases with the increase in fly ash content. However, 21 days curing test with 3% fly ash showed maximum strength than the test with 9% fly ash.
Soil samples with 9% fly ash content at 21 days of nurturing and soil sample with 3% fly ash content at 21 days and 14 days of nurturing showed a higher peak value.
Scanning Electron Microscopy (SEM)
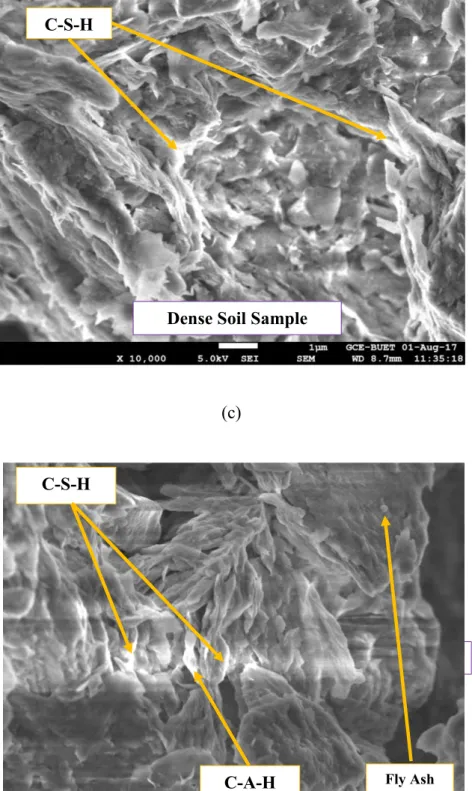
Finally, the microstructure of the prepared soil sample with 9% fly ash implies a well-coordinated bond between the soil particles. Therefore, it shows that 9% ash content is the optimal dose to significantly reduce soil dispersion.
Chapter Five
CONCLUSIONS AND RECOMMENDATIONS
Introduction
Conclusions
The crumb test revealed that soil dispersion decreases with increasing ash content. Therefore, samples should be prepared in excess of the highest percentage of initial water content, i.e. OMC, for proper hydration of the fly ash content. As the fly ash content increased, the rate of pozzolanic reactions also increased, producing C-A-H and C-S-H crystals around the molecular level of soil particles.
Therefore, the effect of adding fly ash content on index properties of dispersive soil can be investigated. In this study, the initial water content was the OMC of the dispersive soil for an increase in fly ash content. Therefore, the amount of water required for the hydration process of fly ash on dispersive soil needs to be investigated.
In this study, only the effect of fly ash on UC strength was investigated.
Fattah, M.Y., Omran, H.A., and Abdul Latif, T.M., "Modification of pinhole equipment for identification and classification of dispersed clay soils", Journal of Engineering and Development, University of Al-Mustansiriya, Vol. Maharaj, A., Van Rooy, L., and Paige-Green, P., "Revised test protocols for the identification of dispersive soils", Journal of the South African Institution of Civil Engineering, Vol. Marchuk, A., and Rengasamy, P., “Threshold electrolyte concentration and dispersive potential in relation to CROSS in dispersive soils”, Soil Research, Vol.
Nagy, G., Nagy, L., and Kopecskó, K., "Examination of the physico-chemical composition of dispersive soils", Periodica Polytechnica Civil Engineering, Vol. Tamim, M.M., Dhar, A. and Hossain, M.S., "Fly ash in Bangladesh-an overview", International Journal of Scientific & Engineering Research, Vol. Umesh, T.S., Dinesh, S.V., and Sivapullaiah, P.V., “Characterization of Dispersive Soils,” Department of Civil Engineering, Siddaganga Institute of Technology, Tumkur, India, pp.
Vyas, S., Phougat, N., Sharma, P., and Ratnam, M., "Stabilization of dispersed soil by mixing polymers", International Journal of Earth Sciences and Engineering, Vol.
APPENDIX A
SEM Images of Soil Sample Treated with 3% Fly Ash
SEM Images of Soil Sample Treated with 6% Fly Ash
SEM Images of Soil Sample Treated with 9% Fly Ash
SEM Images and Data of Treated Soil with 3% Fly Ash
SEM Images and Data of Treated Soil with 6% Fly Ash
SEM Images and Data of Treated Soil with 9% Fly Ash