Introduction
- Preamble
- Problem statement
- Aim and objectives
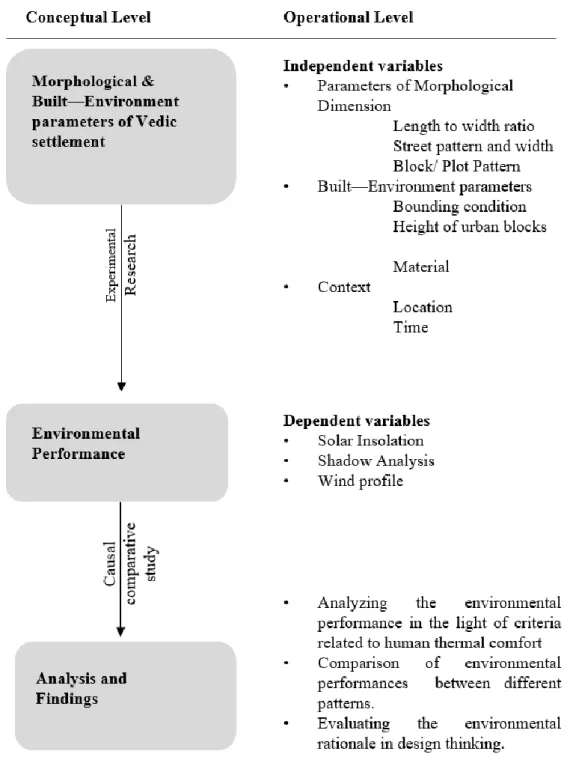
- Conceptual framework
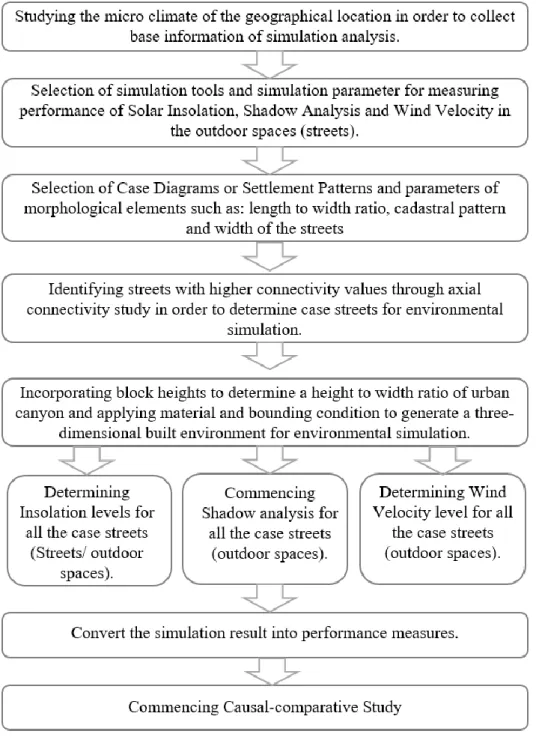
- Overview of research methodology
- Scopes and limitations
Solar insolation, shade condition and wind speed, three essential components of thermal comfort in outdoor spaces will be studied parametrically to assess the environmental reasoning of Vedic architects. 4 c) What are the environmental performance of the outdoor spaces of the Vedic settlements and do the results meet the environmental design thinking suggested in the Vedic treatises.
Literature review
Preamble
Elements of morphological dimension in urban planning
Existing buildings in a settlement can be adapted and converted to a changed land use (Carmona et al., 2003). Road and space patterns of old tend to remain as fragments in current patterns (Carmona et al., 2003).
Settlement planning in Vedic period
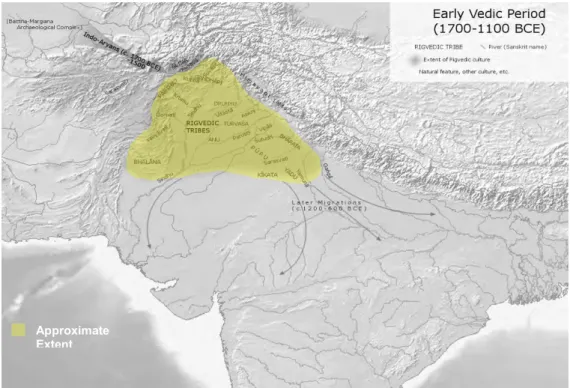
- Vedic period and ‘second urbanization’ ( বেনদ যুগ ও নিতীয় নগরায়ণ)
- Major literary sources
- Professionals in Vedic period
- Units of measurement
- Socio-economic scenario in Vedic period
- Origin of Indian cities: types of settlement
- The Indo-Aryan village
- Siting considerations and environmental rationales
- Street planning
- Site planning and folk planning
- Building bye-laws
The Vedas are composed in Vedic Sanskrit (संग्सक्रित) and are a large body of texts containing liturgical material as well as mythological accounts, poems, prayers and formulas which are considered sacred (Violatti, 2013). It is noteworthy that the prominent architect Le Corbusier later developed a figure named the 'modular man' to create a universal system of proportions in which the length of the human figure is considered to be six feet (Figure: 2.3).
Examples
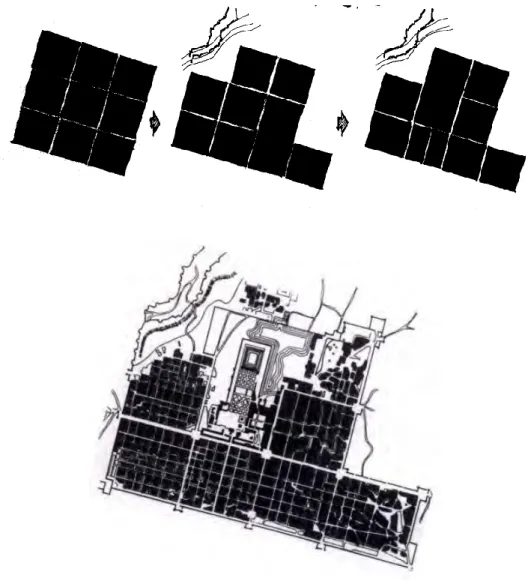
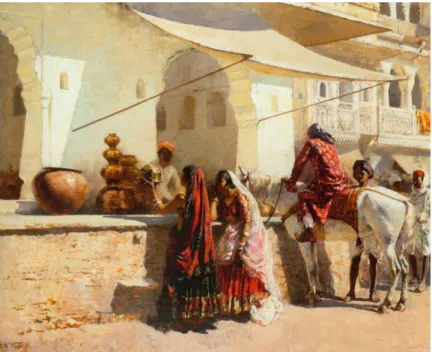
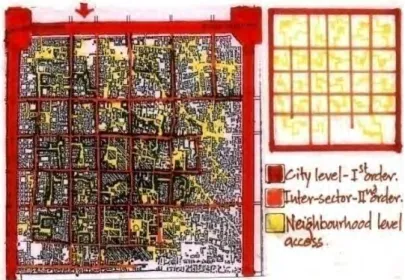
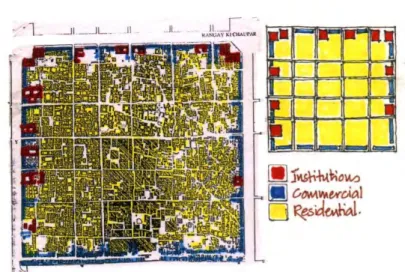
- Case study: Jaipur
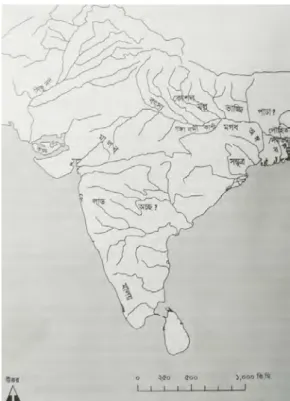
- Settlements in Bengal
The width of the primary, secondary and tertiary streets is found to be 111ft, 55ft and 27ft respectively. 55 The streets and Chowks (central open city squares) of Chowkries with numerous wards or muhallas were not predetermined. Kotasura (বক্যিযুর), Pokhanna (বপাখ্ন্ন্ন), Dihara (শ্তদগার) and Mangalakota (ক্ক্ল্ক আই): These settlements were part of Rarha Janapada located at West Bengal.
Shahnaj Husne Jahan suspects that the city had trade relations with Tibet, Sikkim, Nepal, Bhutan, Assam, Cooch Behar and the lower valleys of the Ganges (Yusuf, 2016).
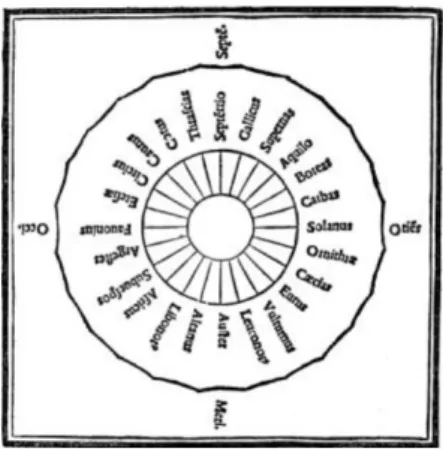
Contemporary principles of city planning by Vitruvius
60 Vitruvius stated that the architect would need a holistic education to understand the different aspects of the citizens. He also told that the heat makes people weak in summer and beware of the districts from where hot winds can spread over the inhabitants (Morgan, 1914). Winds are suggested not to enter the interior of the dwellings as this will increase the health condition of the well and the patients who are already suffering from diseases.
Patients would have a better chance of recovery from the tenderness that comes from being shut out from the winds (Morgan, 1914).
Climatic Imperatives
- Thermal comfort
- Determinants of thermal comfort in outdoor urban environment
63 In tropical urban environments and in many Mediterranean cities, it has been observed that people tend to follow the shaded paths as they walk, which are generated by the geometry of the buildings and the foliage of the trees planted along them. Air temperature: Heat exchange by free or forced convection is directly related to the dry bulb temperature of the environment. It is the ratio between the actual amount of moisture present and the amount of moisture air could hold at the given temperature expressed as a percentage.
But if the air temperature is higher than the skin temperature, it causes heat gain of the body.
Critical findings from literature review
The two main streets, the Brahmavithi and Mahakalavithi, along with the Mangalavithi, are considered to be 5 dandas wide. All other streets, Rajapatha, Vamanapatha, Vithi and Marga, are considered 2 dandas wide. F). Therefore, the simulation of this study will use brick as building material and external paving for road surfaces. j) The environmental reasons suggested in the literary sources have largely been developed through empirical knowledge, as scientific terms and tools of modern times to quantify the relevant variables have not been discovered.
Acharya, PK, (1922), The Training of Architects in Ancient India, An Illustrated Quarterly for Oriental Art, No. 1996), Approaches to Bioclimatic Urban Design for the Tropics with special reference to Dhaka Bangladesh, PhD thesis, Environment and Energy Studies Programme, Architectural Association School of Architecture, London.
Simulation and analysis
Preamble
Methodology for simulation
- Microclimate of Dhaka
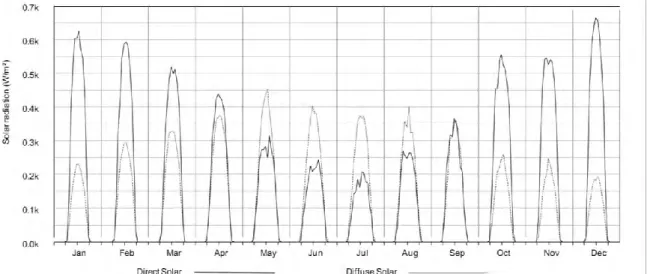
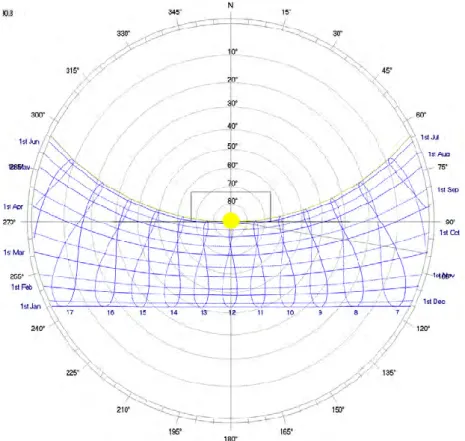
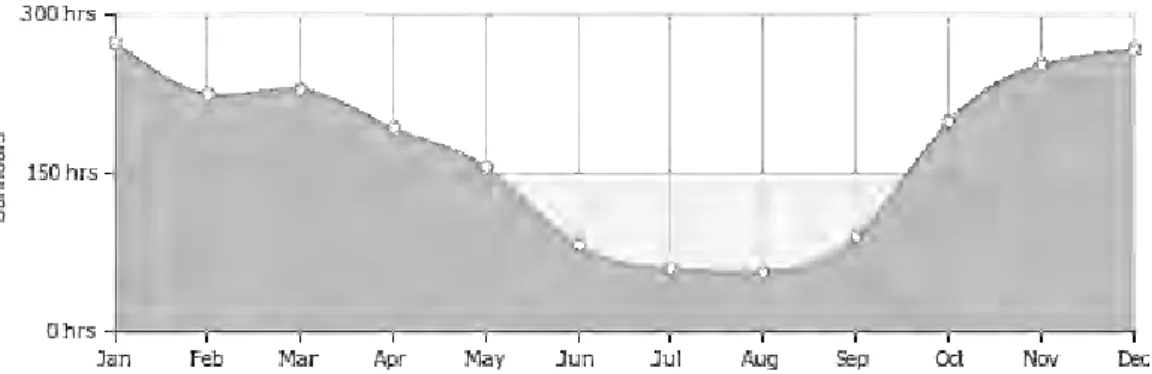
- Sunshine hours and sun path diagram
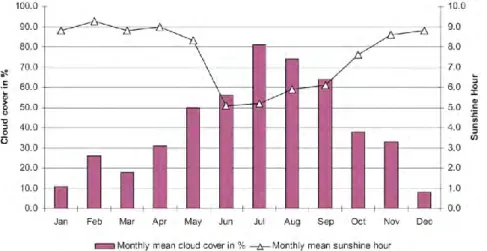
- Sky condition
- Annual wind flow condition
The city has a distinct monsoon season, with an average annual temperature of 27.5 °C (81.5 °F) and monthly averages ranging from 19.5 °C (67 °F) in January to 32 °C (90 °F ) in April. Dhaka City mainly has three distinct seasons – hot dry (March-May), hot humid (June-November) and cool dry season (December-February). Dhaka has a composite climate where clear skies, cloudy skies and partly cloudy skies are observed throughout the year (Figure 3.5), and designers have to face difficulties in considering both sky conditions (Ahmed, 1987). In the case of wind, most of the cases in summer time in Dhaka city wind comes from south and southeast direction (Figure 3.7(a)), which is about 42% of all wind coming from all directions.
The maximum wind flow is from the south with a wind speed of 2.78 m/s for more than 632 hours and 568 hours of wind flow is from the south with a wind speed of 4.18 m/s.
Selection of simulation tools
Sometimes the wind speed can reach up to 13.88 m/s speed from north, northeast side, east, southeast and south. The 80-connection 'UCL Depthmap' developed by the Bartlett School of Architecture, University College London has been used. Ecotect Analysis specific use of the access method is based on 'ISO Thermal performance of buildings' and 'ISO Thermal performance of buildings' as well as parts of 'ISO Transmission heat loss coefficient - Calculation method' (Validation, 2014).
For architectural applications, Autodesk Flow design is suitable, especially for analyzing wind behavior in outdoor spaces.
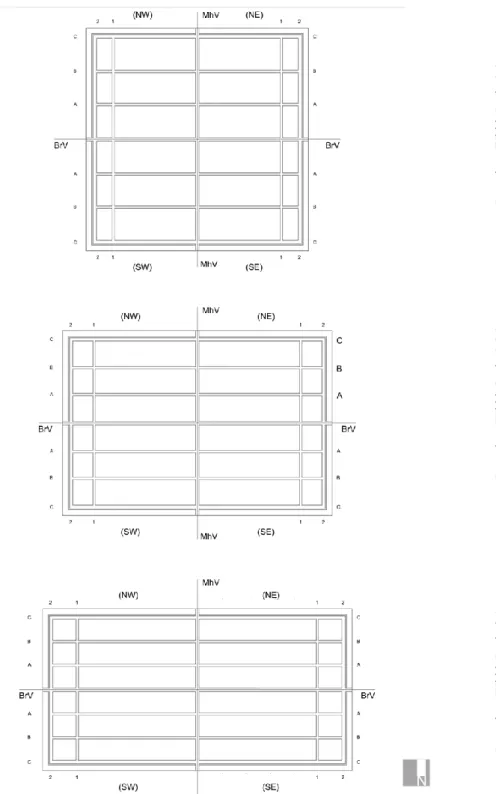
Selection of case diagrams
82 The two main streets, the Brahmavithi and Mahakalavithi along with the Mangalavithi were considered to be 5 dandas wide, which is equivalent to 9m. All the other streets, the Rajapatha, Vamanapatha, Vithi and Marga were considered to be 2 dandas or 4m wide. The Rajapatha and Vamanapatha for Dandaka were considered to be 3 dandas or 6m wide as the description indicates.
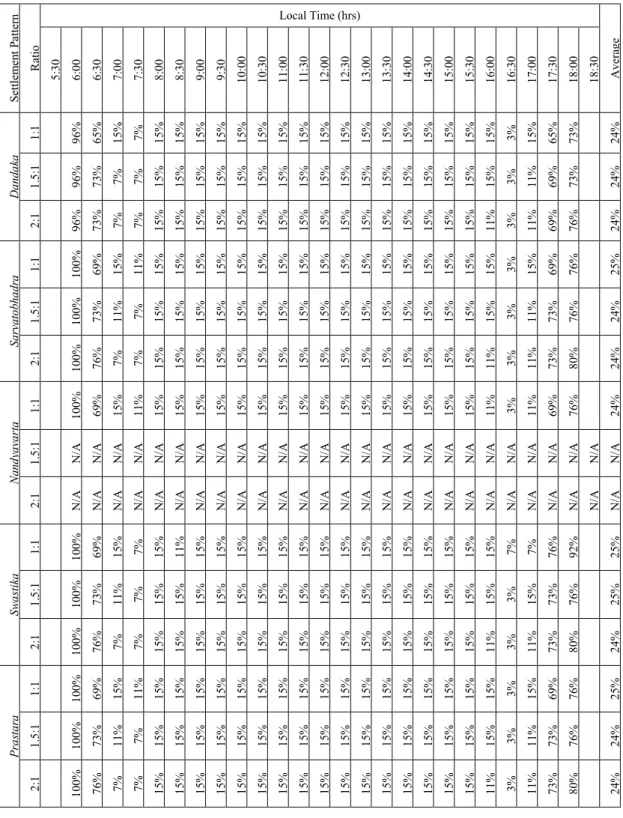
Based on the above information, fifteen alignment patterns were generated from the selected six case diagrams.
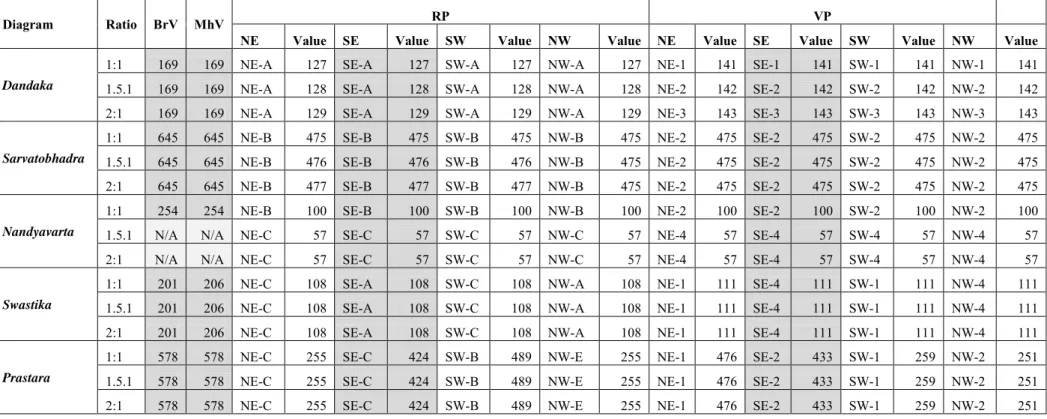
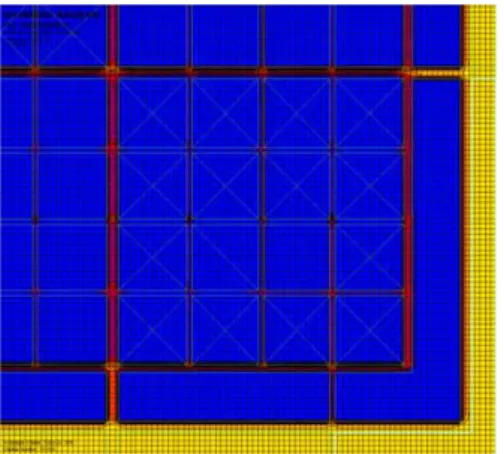
Axial connectivity study and selection of case-streets
According to the axial connectivity study, Brahmavithi and Mahakalavithi are the highest connected streets for all settlement patterns, which is also in accordance with the codes suggested in the literary sources. However, the highest associated Rajapath and Vamanapath differ for each type of village and in cases for each quarter of the settlement pattern. The connectivity values of the highest connected streets for the four quarters of each diagram are shown in Table 3.3.
Since Prastara is asymmetrical, its streets from different quarters have different values, with the highest cumulative value for both Rajapatha and Vamanapatha being observed in the south-eastern quarter.
Introducing built-environment parameters for three-dimensional model
Strict application of the principles of Padavinyasa and the building bye-laws regarding allocation, distribution, setback, height, size and shape of the buildings are not observed in the case studies. The facades of the blocks adjacent to the primary or secondary streets are continuous and have negligible amounts of space between the built forms. As a result, the blocks do not form significant cracks, which can make a noticeable contribution to the porosity of the whole block, although the internal spaces have undeveloped areas and building with courtyards (Figure 3.15).
Based on the above scenario, the height of the solid blocks is handled within the settlement models.
Insolation analysis
- Formation of 3d model for computer simulation
- Time-basis and other parameters
June 21 and December 22 were chosen from the three dates because these are the summer solstice and winter solstice, respectively, for the Earth's northern hemisphere. As a result, June 21 is the longest and December 22 the shortest day of the year, implying that these dates respectively have the maximum and minimum exposure to the sun in a year, although the level of radiation will be largely determined by the condition of the air . According to the weather data of Dhaka, April is the warmest month of the year in terms of air temperature and April 4 has the highest recorded solar radiation level within the month, which can give us the maximum radiation threshold for this study.
April, June and December also represent three different seasons: hot-dry, warm-humid and cold-dry.
Insolation analysis results
- Brahmavithi (BrV)
- Mahakalavithi (MhV)
- Rajapatha (RP)
- Vamanapatha (VP)
- Key observations from insolation analysis
Average daily insolation (Wh/(m.2 .day)) within the cross-section of BrV for 22 December 3.18: Average daily insolation (Wh/(m.2 .day)) within the cross-section of BrV for all. From the data, it can be observed that the average cumulative irradiance level (direct and diffuse) of Mahakalavithi (MhV) of all the settlement patterns varies within a close range. Average daily insolation (Wh/(m.2 .day)) within cross-section of MhV for 22 December 3.20: Average daily insolation (Wh/(m.2 .day)) within cross-section of MhV for all.
Average daily insolation (Wh/(m.2 .day)) within cross-section of RP for December 22 3.22: Average daily insolation (Wh/(m.2 .day)) within cross-section of RP for all.
Shadow analysis
- Formation of 3d model for computer simulation
- Time-basis and other parameters
Shadow analysis results
- Brahmavithi (BrV)
- Mahakalavithi (MhV)
- Rajapatha (RP)
- Vamanapatha (VP)
- Average shading condition
Shaded percentage (%) of all BrV with hours for December 22 3.25: Shaded percentage (%) of all BrV with hours. Shaded percentage (%) of all MhV with hours for December 22 3.26: Shaded percentage (%) of all MhV with hours. Overshadowing percentage (%) of all RPs with hours for December 22 3:27: Overshadowing percentage (%) of all RPs with hours.
Shade percentage (%) of all hourly VPs for December 22 3.28: Shade percentage (%) of all hourly VPs.
Wind flow analysis
Wind simulation results
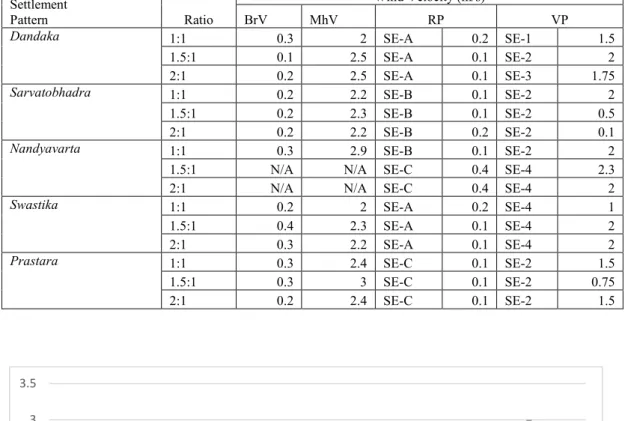
Therefore, more perforated villages in terms of VPs and RPs cause more wind flow than the solid ones. This situation causes wind flow in the RPs to some extent and street has an avenue for wind flow at regular interval. Compared to that, the Dandaka has longer east-west oriented streets with relatively lower wind flow.
Regarding the built-in environment parameter, diagrams with a higher surface-to-volume ratio showed better flow and wind speed.
Performance indicator
- Solar insolation
- Overshadowing percentage
- Wind velocity
- Performance indicator calculation
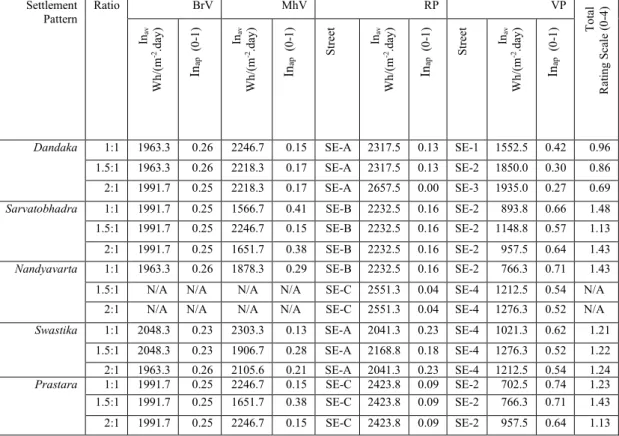
The following strategies have been considered for determining the numerical rating value for the solar radiation level. Based on this, the numerical rating for all four street types is shown in Table 3.25(a). The value of Inmax is set at 2785.6 Wh/(m-2.day). Table 3.25(b) shows the numerical rating of all four street types for June 21.
The following strategies were followed to determine the numerical value of the percent shading score.
Causal-comparative analysis
- Cadastral pattern and orientation
- Height to width ratio
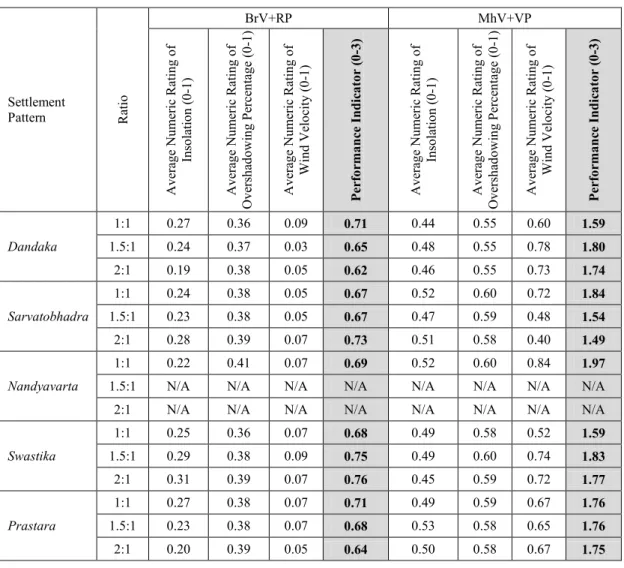
The Performance Indicator values of the east-west elongated streets (BrV and RP) and the north-south elongated streets (MhV and VP) are shown in Table 3.30. The data from Table 3.30 also shows that the north-south elongated streets have a higher indicator value in terms of every three dependent variables. The PI value of the RPs and VPs along with their respective H/W ratio is shown in Table 3.31.
The cumulative value of PI for RP and VP was shown in order from highest to lowest in Table 3.33 and Figure 3.39.
Summary
Discussion and conclusion
Preamble
Key observations
Evaluation of environmental rationales
Suggestion for future research
Conclusion
![Figure 3.7(a): Average wind direction of Dhaka city (January 2000 - December 2008) (Source:www.weatheronline.co.uk/weather]](https://thumb-ap.123doks.com/thumbv2/filepdfnet/10888840.0/95.892.202.744.720.987/figure-average-direction-january-december-source-weatheronline-weather.webp)
