AN EVALUATION ON CAPACITY OF CASTING
INDUSTRY BY USING SIMULATION
CHIN SOON HWA
UNIVERSITI TEKNIKAL MALAYSIA MELAKA
An Evaluation on Capacity of Casting Industry
by Using Simulation
Report submitted in accordance with the partial requirements of the
Universiti Teknikal Malaysia Melaka for the
Bachelor’s Degree of Manufacturing Engineering (Manufacturing
Management)
By
Chin Soon Hwa
Faculty of Manufacturing Engineering
UTeM Library (Pind.1/2008)
UNIVERSITI TEKNIKAL MALAYSIA MELAKA (UTeM)
BORANG PENGESAHAN STATUS LAPORAN*
JUDUL: AN EVALUATION ON CAPACITY OF CASTING INDUSTRY BY USING SIMULATION
SESI PENGAJIAN : 2007/ 2008
Saya CHIN SOON HWA
mengaku membenarkan laporan (PSM/ Sarj ana/ Dokt or Falsaf ah) ini disimpan di Perpust akaan Universit i Teknikal Malaysia Melaka (UTeM) dengan syarat -syarat kegunaan sepert i berikut :
1. Laporan adalah hak milik Universit i Teknikal Malaysia Melaka.
2. Perpust akaan Universit i Teknikal Malaysia Melaka dibenarkan membuat salinan unt uk t uj uan pengaj ian sahaj a.
3. Perpust akaan dibenarkan membuat salinan laporan ini sebagai bahan pert ukaran ant ara inst it usi pengaj ian t inggi.
4. **Sila t andakan (√)
SULIT
TERHAD
TIDAK TERHAD
(Mengandungi maklumat yang berdarj ah keselamat an at au kepent ingan Malaysia yang t ermakt ub di dalam AKTA RAHSIA RASMI 1972)
(Mengandungi maklumat TERHAD yang t elah dit ent ukan oleh organisasi/ badan di mana penyelidikan dij alankan)
(TANDATANGAN PENULIS)
APPROVAL
This report submitted to the senate of UTeM and has been accepted as partial fulfillment of the requirements for the degree of Bachelor of Manufacturing Engineering (Manufacturing Management). The member of the supervisory
committee is as follow:
……… Supervisor
DECLARATION
I hereby, declared this report entitled “An Evaluation on Capacity of Casting Industry by Using Simulation” is the results of my own research
except as cited in the references.
Signature : ………
Author’s Name : Chin Soon Hwa
ABSTRACT
ABSTRAK
DEDICATION
ACKNOWLEDGEMENTS
I would like to extend my warmest gratitude and thankful to my supervisor, Prof. Madya Dr. Adi Saptari for his invaluable guidance and assistance towards me throughout this project. I would like to express my appreciation to all the knowledge and advice that gained from my supervisor. Every single thing that been told to me was a gift to make me success in not just only for PSM but also for the future of my career.
I would like to express my highest appreciation to ABC Company for providing the chance of perform research in their plant, I would like to express my gratitude to all of the staff and operators in ABC Company for giving me the information when I in doubt. Especially Mr. Syed, the foundry manager of ABC Company, who always shows his sincerity and kindness to help me and also willing to share his ideas.
TABLE OF CONTENTS
List Of Abbreviations, Symbols, Specialized Nomenclature………xi
1. INTRODUCTION...1
1.1 Background….…………...1
1.2 Problem Statement………..…4
1.3 Objectives………...5
1.4 Scope of Study………5
1.5 Organization Of The Study………...6
2. LITERATURE REVIEW………...………8
2.1 Introduction to Queueing Theory………...……..8
2.2 Evolution of Queueing Theory and Simulation……...……….………..15
2.3 Simulation Modeling Methods………...……….………...17
2.4 Current Development………...……...……….….……….20
3. METHODOLOGY……….24
3.1 Introduction of Methodology………...……..24
3.2 Planning of Study………...23
3.2.1 Problem Formulation……….………...26
3.2.2.1 Define Objectives……….26
3.2.9 Alternative Solutions and Improvement………...…………...….36
4. RESULT……….……….37
4.1 Introduction ………..………...……..37
4.2 Documentation of Data………..…………...……..37
4.3 Distribution Identification Analysis…….………...……..39
4.4 Simulation Results……….…………...……..45
5. DISCUSSION……….……….53
5.1 Introduction ………..………...……..53
5.2 Bottleneck and Constraint Identification………..…………...….…..53
5.3 Major Root Cause of Bottleneck…….………..…...………..55
5.4 Alternative Solutions and Improvement on The Process Performance...……..57
6. CONCLUSION AND RECOMMENDATIONS...……….61
6.1 Conclusion ………..………..………...……..61
6.2 Recommendations………...….…..62
APPENDICES
A Gantt Chart of PSM 1 B Gantt Chart of PSM 2
LIST OF FIGURES
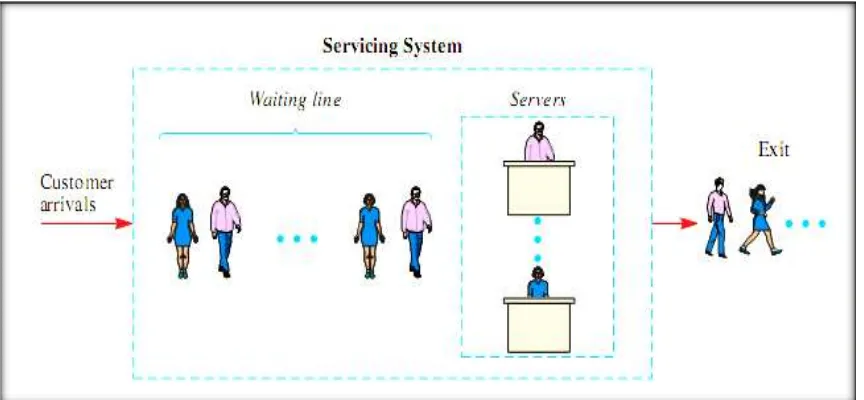
2.1 Components of Queueing System……….……….8
2.2 Numbers of Lines………...…9
2.3 Queue Discipline………..…10
2.4 Line Structure of Queueing System………...11
2.5 History of Simulation………...16
3.1 Methodology of Simulation Study……….………..25
3.2 Scope of Model……….28
3.3 Process Flow of ABC Company Manufacturing System...….……….29
3.4 Steps of Data Collection and Analysis……….30
3.5 Flow Chart of Data Collection and Analysis...……….31
3.6 An Animation Screen of Experiment of ABC Company Manufacturing System…...35
4.1 Probability Plots of GDC machine For Normal, Exponential, Weibull and Gamma Distribution……….………..……..41
4.2 Probability Plots of GDC machine For Lognormal, Logistic, Loglogistic, 2-Parameter Exponential Distribution………...………..….42
4.3 Defined Location In Simulation Modeling………...….……….44
4.4 Defined Downtime For Location In Simulation Modeling Analysis…..……….45
4.5 Defined Entities In Simulation Modeling ………...……….….45
4.6 Defined Resources In Simulation Modeling.……….….……….46
4.7 Defined Path Network In Simulation Modeling …………...…..……….46
4.8 Defined Processes And Routes In Simulation Modeling.………...…….30
LIST OF TABLES
2.1 Infinite-Source Symbol………...14
2.2 The Current Development of Queueing Theory and Simulation………20
3.1 Steps and Task of Data Collection and Analysis Methods...………..32
3.2Structural Elements of Simulation Modeling Methods………..33
4.1 Defined Parameters...………..38
4.2 Data Documentation of GDC Machine with Sample Size of 28………...38
4.3 Descriptive Statistics of GDC Machine…...………...40
4.4 Results of Goodness of Fit Test for Distribution………...41
4.5 Comparison between Normal and Weilbull Distribution for AD and P-value…...43
4.6 Types of Distribution for Machine and Resources….……….………...43
4.7 Average Time Wait for Resources for Entities………...52
5.1 Capacity Of Location In Empty, Part Occupied And Full………..38
5.2 Alternative Model A For ABC Company………...38
5.3 Time Weighted Value Chart For WIP_2 Contents (Alternative Model A)……....40
5.4 Alternative Model B For ABC Company ………..41
LIST OF ABBREVIATIONS, SYMBOLS, SPECIALIZED
NOMENCLATURE
AD - Anderson-Darling AS - Automated Storage
ATM - Automated Teller Machine
DC - Dual Command
FCFS - First Come First Serve
FECN - Forward Explicit Congestion Notification GDC - Gravity Die Casting
GoF - Goodness of Fit PC - Personal Computer PSM - Projek Sarjana Muda RS - Retrieval Storage RTI - Run Time Interface
SC - Single Command
UTeM - Universiti Teknikal Malaysia Melaka WLC - Work Load Control
CHAPTER 1
INTRODUCTION
1.1 Background
A queue is a waiting line, for example, customers waiting at a supermarket checkout counter. For queueing theory, it is known as mathematical theory of waiting lines. More generally, queueing theory is concerned with the mathematical modeling and analysis of systems that provide service to random demands. Unlike many other modeling methods, it is not process specific and it can be used to model any dynamic system in which discrete events alter the state of the system. Typically, a queueing model represents the system's physical configuration to specify the number and arrangement of the servers, which provide service to the customers, and the probabilistic or statistical nature of the demands, and specify the variability in the arrival process and in the service process.
Danish telephone engineer A. K. Erlang. Prior to World War II, very few attempts were made to apply queueing theory to business problems.
Simulation modeling method has become an essential tool to simulate a model. Its had widely used in various kind of industry, such as waiting line in ATM, congestion at the plaza toll, bottleneck production in manufacturing system, logistic and many more. Nowadays, people are much relies on this simulation technology because of its capability to predict the outcome before the actual plan is put into real practice. Besides that, simulation can account for system variances. The conventional analytical methods, such as mathematical models, do not effectively address variances as calculations are derived from constant values. For simulation, it looks at variances in a system which incorporates independence, interaction among components, and time.
Simulation modeling is the best way to visualize, analyse, and predict process
performance. (Harrington and Tumay, 2000) It is very true that simulation modeling
methods can promote a total solution which allows modeling entire systems. The modeling of a process or system in such a way that the model mimics the response of the
actual system to events that take place over time.(Schriber, 1987)By study the behavior
Computer simulation was first used in the defense industry in 1950s. In the early 1960s, the use of simulation spread out to other industries, including manufacturing and finance. In the late 1980s and early 1990s, graphics capabilities of personal computers enabled software developers to create graphical model major development tools and use animation with simulation. The first half of the 1990s brought another very exciting development to simulation-object-oriented modeling analysis.
One of the success stories is from IBM PC Company, one of the largest personal computer manufacturers in the world. In early 1993, they had faced some huge challenges that were eroding its market share, such as frequent price cuts, rapid customer order response times, and a steady arrival of new product and features by aggressive competitor. The IBM Company had suffered losses due to poor forecasting and critical shortages of popularity products. To rescue such a critical situation, they implemented the simulation modeling method to evaluate different manufacturing execution strategies, and evaluate the effect of different planning and forecasting methods. The outcome was a success, where the IBM Company successfully improves its customer service levels, at the same time decrease finished goods inventory. The estimated saving in distribution costs for IBM PC company would totally approximately $40 million per year. The simulation study showed how extraordinary improvements can be achieved through very
ordinary means. (Moore, 1997) In fact, it is unquestionable that the development of
simulation modeling tools has brought astonishing enhancement and created many triumphant history.
1.2 Problem statement
In manufacturing industry, the company which applies line production and
continuous processing production will results a high volume of buffer in finished
inventory. Due to the high market needs, these companies prefer to implement
tradition push system as their manufacturing strategy and to be competitive in
market. However, they had experienced the bottleneck production due to the push
system.
Improper manufacturing strategy and process choice may cause much
longer lead time, low productivity and poor on time delivery. This would
indirectly affect the company’s competitiveness in the market and their reputation.
Furthermore, the company may suffer huge loss in their business if the process
planning is not implemented properly.
Moreover, industrial and service enterprise face increase pressure to
minimizing the time it takes to service customer and fulfill demand. Today,
customers tend to set high expectation on the product and service quality with
custom features at affordable prices. This situation has put tremendous pressure
on business manager to maximize profits while minimizing the risks.
Due to the seriousness of the problem, some of the company has
implemented simulation modeling methods as the new tool to support their
business. By using simulation modeling methods, the evaluations have been
performed to different manufacturing execution strategies. Moreover, process
simulation has enabled the manufacturing firms to examine the effect of palling
and forecast methods. And yet, there are many real applications were simulated
over the past 20 years and the simulation modeling methods has brought a major
success in their business.
In ABC Company, demand variation and process variation has been the
volume, they have to assign different task to different machine and at the same
time able to meet the delivery. But the main problem is the lack of tool to tell
them about capacity of machine. So, this eventually ended up with tight
scheduling and improper assignment task to machine. Meanwhile, the process
variation, such as scrap, unexpected longer cycle time and so on, has cause the
increase level of buffer in the production. Thus, the company suffers from losses.
1.3 Objectives
The objectives of this project are:
a) To simulate the manufacturing process under a given set of circumstances. b) To recognize the bottleneck and constraint in the production process. c) To identify the major root that cause to bottleneck process.
d) To suggest alternative solutions and improvement on the process performance.
1.4 Scope of study
bottleneck in the process and propose the workable solutions to reduce and eliminate the constraints.
In order to accomplish these tasks, PROMODEL simulation modeling software becomes the tool to assist in performance measurement production system. By collecting the data from ABC Company, their current production system can be simulated. The output analysis of modeling simulation method will report the symptomatic behavior of problems. Due to the simulation software is not capable to identify the causes of problems, therefore, this project will discuss the major roots that caused bottleneck production. Finally, improvement and solutions will be suggested in order to make the system more efficient and to reduce waiting time.
However, this project will exclude the performance analysis on supply chain management and the logistic. The facility planning of the manufacturing system will not be included in this project.
1.5 Organization of The Study
This study will be categorized into six chapters, which are Introduction, Literature Review, Methodology, Results, Discussion, and Conclusion.
a. Chapter 1 : Introduction
This chapter contains the background of the problem statement, the objectives and the scope of the study. In this chapter, it summarizes the progress of the study and describes the plan to accomplish the study.
b. Chapter 2: Literature Review
c. Chapter 3 : Methodology
It describes overview of the research methods and how to conduct the research methods. The steps to perform simulation modeling methods for will be included in this part.
d. Chapter 4 : Results
In this chapter, the result of simulation will be presented in animation display and graph. The results will be gathered from simulation modeling software.
e. Chapter 5: Discussion
The outcome of the simulation will be discussed more in detail. The discussion includes the reason that caused to bottleneck production. Alternative solutions will be proposed to improve the manufacturing performance.
f. Chapter 6 : Conclusion and Recommendations
CHAPTER 2
LITERATURE REVIEW
2.1 Introduction to Queueing Theory
Queueing theory studies how queues or waiting lines develop and behave as a
function of their primary characteristics. (Stevensen, 2007) Queueing theory is the
mathematical study of waiting lines or queues. The queueing theory is used primarily in assisting the design and operation of queuing system.