Yield Stability Evaluation of Upland Rice Lines Obtained
from Anther Culture
Deni D Sulaeman
a, Bambang S Purwoko
b*, Iswari S Dewi
c, Muhamad Syukur
b, Desta
Wirnas
b, Heni Safitri
da
Graduate Student of Plant Breeding and Biotechnology Major, the Graduate School of Bogor Agricultural University, bDepartment of Agronomy and Horticulture, Faculty of Agriculture, Bogor Agricultural Universit, c
Indonesian Center for Agricultural Biotechnology and Genetic Resources Research and Development, Bogor, dIndonesian Center for Rice Research, Bogor
*Corresponding author: Jln Meranti, Darmaga, Bogor 16680 Indonesia. Tel: +62 251 8629353.
E-mail address: [email protected]
Abstract
The objective of this research was to study the adaptation and yield stability of upland rice lines obtained from anther culture. Ten upland rice doubled-haploid (DH) lines were tested for their potential yield in eight different locations (in Provinces of Lampung, West Java, Central Java, Yogyakarta, East Java - Indonesia) in the rainy season of 2010/2011 along with two check varieties (Way Rarem and Batutegi). In each location, the design was Randomized Complete Block Design with four replicates. The method of Francis & Kannenberg, Finlay & Wilkinson, Eberhart & RusseIl and AMMI (Additive Main Effect Multiplicative Interaction) were used to analyze the adaptation and yield stability of the tested DH lines. The results indicated that the line showing the most stable yield in different environment was I5-10-1-1 followed by WI-44, and IG-38. I5-10-1-1 produced 4.01 tons of dry grain per hectare. The line showing the highest yield was WI-44, and this line produced 4.72 tons of dry grain per hectare. Visualization with AMMI showed that IW-56 and IW-67 lines were specifically adapted in Purworejo, O18-b-1 is specifically adapted in Bogor, and IG-19 is specifically adapted in Malang, respectively.
Keywords: upland rice, DH lines, yield stability
Introduction
Efforts to increase the food production, especially rice, through the utilization of dry land can be reached by breeding upland rice, since the high-yielding upland rice varieties may be accepted by farmers. Anther culture has been reported to produce doubled-haploid (DH) plants or pure lines in a short time (Dewi et al., 1996). On the contrary, conventional breeding will require a long period of time (more than 5 years) in obtaining pure lines as a result of combining the desirable traits of different varieties or parents. Through anther culture of F1, several number of upland rice DH lines were obtained from previous experiment, i.e. IW-56, IW-67, IG-19, IG-38, and GI-8 lines tolerant to low light intensity or shade (Sasmita et al., 2006); III3-4-6-1 and I5-10-1-1 lines tolerant to aluminum toxicity (Herathwati et al., 2009); while O18-b-1 and B13-2e lines tolerant to both shade and Al toxicity (Purwoko, 2007). Those DH lines need to be evaluated further.
was aimed to study the adaptation and yield stability of upland rice DH lines obtained from anther culture in 8 different environments.
Materials and Methods
The yield stability test of upland rice was held at eight locations in the rainy season during October 2010 until April 2011. Testing locations spread across Java and Sumatra, namely: the Taman Bogo - Lampung, Natar - Lampung, Cikarawang Bogor - West Java, Sukabumi - West Java, Indramayu - West Java, Purworejo - Central Java, Wonosari - Gunung Kidul, and Malang - East Java. A total of 12 genotypes were used as test material, which consisted of 10 upland rice DH lines obtained from anther culture, i.e. III3-4-6-1, I5-10-1-1, WI-44, GI-7, O18-b-1, IW-67, IG-19, IG-38, IW 56, and B13-2e, while Batutegi and Way Rarem.were two check varieties used for comparison.
The experimental design was Randomized Complete Block Design with four replicates. An experimental unit consisted of 4 x 5 m2 plot. Each of the tested genotypes were planted with a spacing of 30 x 15 cm. Observations and data analysis were conducted on dry grain yield per hectare. The method of Francis & Kannenberg, Finlay & Wilkinson, Eberhart & RusseIl and AMMI (Additive Main Effect Multiplicative Interaction) were used to analyze the adaptation and yield stability of the tested DH lines.
Results and Discussion
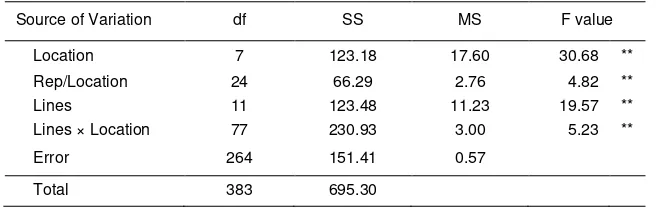
The variance analysis of pooled data at eight test locations showed the occurrence of interaction between lines (genotype) and environment (G × E) (Table 1). The existence of such interactions will cause each lines responded differently to the environment in which testing was conducted. The response was mainly shown by the fluctuations in grain yield. A genotypes or varieties though, will not always produce the same great results if planted in different environments. This is caused by the large diversity of the macro geophysical environment that will provide the large environmental diversity for plant growth as well (Satoto et al, 2009).
Table 1. Analysis of variance of pooled data at 8 locations
Source of Variation df SS MS F value
Location 7 123.18 17.60 30.68 **
Rep/Location 24 66.29 2.76 4.82 **
Lines 11 123.48 11.23 19.57 **
Lines × Location 77 230.93 3.00 5.23 **
Error 264 151.41 0.57
Total 383 695.30
Notes : ** very significantly different
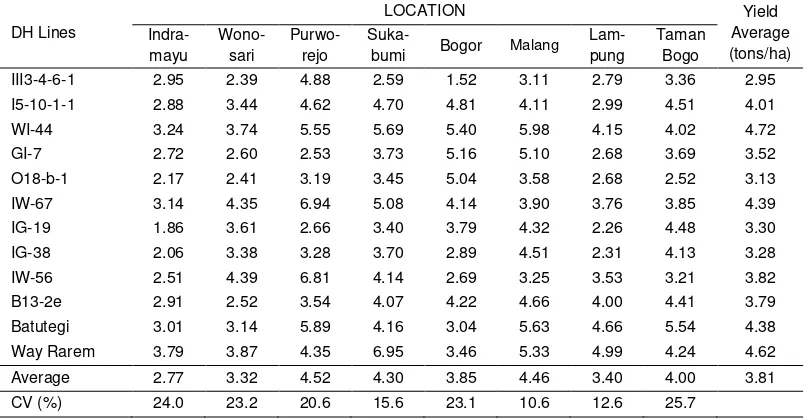
Batutegi. However, the difference in average yields between WI-44 with Way Rarem was 0.1 tons/ha or WI-44 approximately 17.2% higher than Way Rarem.
Tabel 2. The average dry grain yield (tons/ha) of upland rice DH lines in every test location
DH Lines environment is parallel to the mean response of all genotypes in the trial, (3) residual mean square (MS) from the regression model on the environmental index is small.
Tabel 3. Parameters of stability of dry grain yield of upland rice DH lines from eight locations
Francis & Kanennberg (1978)
Francis and Kanennberg (1978) measure the stability by using the coefficient of variability (% CVI) of each genotype tested in multiple environments. The small values of its coefficient of genotype diversity meant that the genotype is more stable. Moedjiono and Mejaya (1994) categorized the value of the coefficient of genotype diversity in four groups, namely low (<25%), rather low (25 -50%), rather high (50-75%), and high (75-100%). Therefore, based on those criteria the DH lines tested in this study fell into of low and rather low groups. I5-10-1-1, WI-44, B13-2e, and Way Rarem have a low coefficient of genotype diversity, thus classified as stable.
Finlay and Wilkinson (1963)
Stability analysis of Finlay and Wilkinson (1963) is a method of measurement stability that is based on the regression coefficient (bi) between the average yields of a genotype with a general average of all genotypes tested in all test environments. This analysis can explain the phenomenon of stability and adaptability of a genotype. Finlay and Wilkinson categorize standard bi values of stability in the three groups, namely (1) the stability is below the average, if the value of bi > 1, (2) stability is equivalent the average, if the value of bi = 1, (3) stability is above the average, if the value of bi <1.
Based on those criteria, Batutegi and Way Rarem and also three DH lines had bi values not significantly different from 1, i.e. I5-10-1-1, IG-19, IG-38, and IW-56. Those DH lines were categorized as a stable line, which meant the lines will be able to adapt to the large environment. Lines with the stability below the average were WI-44 and IW-67 with the bi of 1.52 and 1.31, while the lines with the stability above the average were III3-4-6-1, GI-7, O18-b-1, and B13-2e with bi values of 0.64, 0.77, 0.76, and 0.78, respectively. Lines that have below-average stability are sensitive to environmental changes and adapt to particular environmental benefit (favorable). The lines which have above average stability are generally able to adapt to marginal environments.
Eberhard dan Russel (1966)
Stability analysis of Eberhard and Russell (1966) is a measure of stability based on the deviation from the regression of the average value of genotype on the environmental index. A genotype is stable if residual mean square (MS) from the regression model on the environmental index is small. Parameter stability seen from the deviation value ( 2) and coefficient of determination (Ri2) of the tested genotypes. εodel stability of a genotype is good if it has little 2 value and large Ri2 value (approaching 1).
Based on these parameters, two DH lines namely B13-2e and I5-10-1-1 had the smallest value of 2, i.e. 0.65 and 0.73 (Table 3). Coefficient of determination (Ri2) from these two lines also had the largest value among lines and other varieties, i.e. 0.67 and 0.64. Therefore, the regression model used to estimate the stability of those two lines are better than the other lines.
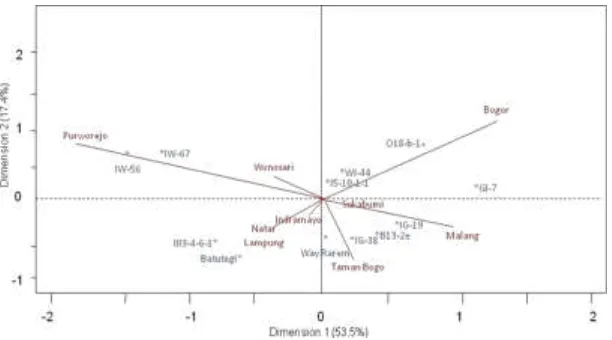
AMMI (Additive Main Effect Multiplicative Interaction)
Figure 1. Bi-plot of interaction effects AMMI2 model for the dry grain yield of upland rice DH lines derived from anther culture
Conclusions
The DH line showing the most stable yield in different environment was I5-10-1-1 followed by WI-44, and IG-38. Visualization with AMMI showed that IW-56 and IW-67 lines were specifically adapted in Purworejo, O18-b-1 was specifically adapted in Bogor, and IG-19 was specifically adapted in Malang.
References
Allard RW. 1960. Principles of Plant Breeding. J Wiley and Sons. New York. 485 p.
Dewi IS, Hanarida I, Rianawati S. 1996. Anther culture and its application for rice improvement program in Indonesia. Indon. Agric. Res. Dev. J. (18) : 51-56.
Eberhart SA, Russel WA. 1966. Stability parameters for comparing varieties. Crop Sci. 6:36-40.
Finlay KW, Wilkinson GN. 1963. The analysis of adaptation in a plant-breeding programme. Aust. J. Agric. Res 14:742-754.
Francis TR, Kannenberg LW. 1978. Yield stability studies in short-season maize. A descript method for grouping genotypes. Can. J. Plant Sci. 58:1029-1034.
Herawati R, Purwoko BS, Dewi IS. 2009. Keragaman genetik dan karakter agronomi galur haploid ganda padi gogo dengan sifat-sifat tipe baru hasil kultur antera. J.Agron. Indonesia 37(2) : 87-94.
Lin CS, Binns MR, Levkovitch LP. 1986. Stability analisis : Where do we stand?. Crop Science. Vol. 26 : 894-900.
Mudjiono, Mejaya MJ. 1994. Variabilitas genetik beberapa karakter plasma nutfah jagung koleksi Balittas Malang. Zuriat 5(2) : 27-32.
Purwoko BS. 2007. Aplikasi kultur antera dan marka RAPD dalam perakitan padi gogo toleran cekaman lingkungan. Laporan Riset Unggulan Terpadu Bidang Pertanian dan Pangan.
Sasmita P, Purwoko BS, Sujiprihati S, Hanarida I, Dewi IS, Chozin MA. 2006. Evaluasi pertumbuhan dan produksi padi gogo haploid ganda toleran naungan dalam sistem tumpang sari. Bul. Agron. (34) (2) 79-86.
Satoto, Utomo STW, Widyastuti Y, Rumanti IA. 2009. Usulan Pelepasan Varietas Padi Hibrida H45, H47, H64, H68 dan H78. Makalah pada Sidang Pelepasan Varietas, Desember 2009.
Subandi, 1981. Genotype x environment interactions in corn variety test. Food Crop 65:1-9.