1
The Study of Sea Bottom Morphology and Bathymetric Mapping Using
Worldview-2 Imagery
Iwan E. Setiawan
Badan Informasi Geospasial, Cibinong, Indonesia
Doddy M. Yuwono
Badan Informasi Geospasial, Cibinong, Indonesia
Vincentius P. Siregar
Institut Pertanian Bogor, Bogor, Indonesia
Gatot H. Pramono
Badan Informasi Geospasial, Cibinong, Indonesia
Abstract
Benthic habitat identification is highly associated with reef or sea bottom morphology. Penetration of multispectral bands gives benefits to identification of sea bottom morphology which could be improved by bathymetric mapping. The purpose of this study is to improve methodology of the sea bottom morphology and bathymetric mapping using Worldview-2 imagery. Sea bottom morphology mapping can also assist identification of benthic habitat in the shallow water. The approach of this study is by using several image transformations assisted by depth in situ measurement. In addition, some image classifications and transformations are also used to improve the sea bottom morphology and bathymetric mapping. The study site is around Panggang Island, Jakarta. The result of this study shows that image-based bathymetric estimation model provides best accuracy among others with varied shallow-water bottom morphology with highest R2 of 0.711 and depth residual at 0.538 m. The result accuracy is assessed by using
information from depth in situ measurement.
1. Introduction
Shallow water in tropical coastal area is a good habitat for coral reef and seagrass. In ecosystem, either coral reef or seagrass plays an important role as nursery ground for some fish species, stabilizing and protecting coastal area from destructive wave energy.
In oceanography, shallow water means an area ranges from coastline to 200 meters below the sea surface. This specific definition of shallow water is delimited by the use of light penetration and sensor technology especially in remote sensing. Based on multispectral sensor used in remote sensing technology, electromagnet spectrum penetrates shallow water up to 20 or 30 meter below sea surface in clear water condition.
According to Nugrahadi (2010) in Guntur et al., (2012), remote sensing technology is able to penetrate water column and identify shallow water objects. In other words, if there is no electromagnetic spectrum can penetrate water column, there is no information about shallow water object can be derived. Moreover, Sutanto (1992) stated that multispectral sensor, especially green and
blue band, can penetrate up to 20 meter below the sea surface in a clear water condition. It is known that electromagnetic spectrum penetration also varies and depends on water clarity conditions. Guntur et al. (2012) argued that higher water turbidity results in less electromagnetic spectrum penetration through water column.
In many studies, green and blue bands are the most used multispectral band in shallow water habitat mapping. One of them is Lyzenga et al (2006) who used green and blue bands to extract bathymetric information of shallow water habitat.
Stumpf et. al. (2003) developed different method to enhance bathymetric information of shallow water using bottom albedo-independent bathymetry algorithm. Calibration of relative water depth resulted by this algorithm was done by using a set of groundtruth points.
1
decrease exponentially. The decreasing light intensity is caused by absorption and dispersion process by both an-organic and organic materials. This absorption and dispersion process is known as attenuation.
The use of remote sensing imageries in shallow water habitat and bathymetric mapping was initiated by using medium resolution satellite images. Nowadays, high resolution satellite images are also available with various spectral resolutions. One of them is Worldview-2 satellite which is the latest generation of high resolution satellite launched by DigitalGlobe in October 2009.
Since its launch, Worldview-2 imageries have been used for shallow water mapping. Madden (2011) used band ratio of several Worldview-2 bands and found that yellow and coastal blue combination was the best combination to enhance shallow water bathymetric information. Alsubaie (2012) who performed bathymetric mapping research in San Francisco Bay also agreed that yellow and coastal blue band ratio gave a proper result.
The use of remote sensing images in coastal and shallow water bathymetric mapping is considerably cost effective (Mumby et al., 1999). As a comparison, bathymetric mapping using sonar data needs a dense gridding sample method to gain a good bathymetric map. In addition, interpolation methods still result in bias information.
This paper used Worldview-2 satellite image to examine both bottom albedo-independent bathymetry algorithm and simple band ratio in providing shallow water bathymetric information. In addition, bathymetric map resulted from Worldview-2 image calibrated with sonar data will be visually and statistically compared with bathymetric map resulted from interpolation method of sonar data. In the end, the bathymetric map will be used to identify shallow water bottom morphology.
2. Methodology 2.1.Study Area
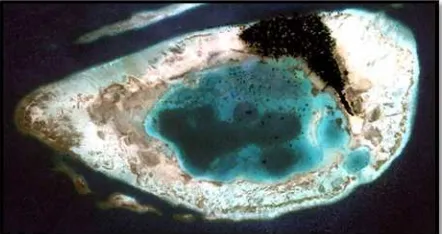
Location of the study is at around Panggang Island which is part of Kepulauan Seribu District, DKI Jakarta (Figure 1). Geographically, Panggang Island is in the northern Jakarta Bay and one of 110 coral islands in Kepulauan Seribu District.
Figure 1. Location of study area in Panggang Island
Panggang Island is located between 5° 44’ – 5° 45’ S and 106° 35’10” – 106° 36’ 30” E. Panggang Island represents complex shallow water bottom morphology with major coral reef ecosystem.
In general, water clarity in Panggang Island shallow waters is categorized as good vision with maximum view ranges from 5 to 7 meters. The growing of some algae species in this shallow water also influences the underwater visibility. Moreover, human activities in land area producing domestic waste change the water quality especially water clarity.
2.2.Dataset
Worldview-2 by DigitalGlobe is the latest satellite generation launch in October 2009 and operated on 770 km height (Figure 2). It has 8 multispectral bands which produces 0.46 m spatial resolution of panchromatic and 1.85 m spatial resolution of multispectral bands (DigitalGlobe, 2009).
Figure 2. Worldview-2 image of Panggang Island
This research used 8 multispectral bands of Worldview-2 image. Acquisition date of the image is October 19th, 2011. To enhance geometric accuracy
1
Figure 3. Worldview-2 image with sounding distribution
In addition, GPS MapSounder was also used to collect depth information for calibrating the Worldview-2 bathymetry information derived from image transformation. To calibrate depth information with real time tidal condition when image and depth information were taken, this research used real time data from BIG’s tide station located on Pondok Dayung and Kolinlamil (Tanjung Priok).
2.3.Data Processing
There are several steps before Worldview-2 image can be analyzed. The first step is image pre-processing which is consisted of geometric correction, atmospheric correction, and glint removal. Second, image processing based on each depth estimation model. The first image model is image difference using band 1 vs. band 4, band 4 vs. band 6 and band 1 vs. band 5. The second is data processing using common depth-estimation algorithm developed by Lyzenga et al. (1978 and 2006). This algorithm is also known as depth invariant index.
Last, Worldview-2 image was processed using bottom albedo-independent bathymetry algorithm developed by Stumpf and Holderied (2003). Deeper analysis will be presented in the discussion by comparing all those image transformation/algorithm, and also compared to real
depth measurement derived from GPS MapSounder.
2.3.1 Pre-processing
As mentioned above, geometric correction was done by ground control points that were collected using GPS receiver in April 2013. The margin error resulted from geometric correction is around 2 meter. Atmosphere and sea surface condition when image was taken is important to determine the degree of image correction. In this research,
Worldview-2 image atmosphere and sea surface condition is categorised as clear since there are no haze or even clouds. Sea surface condition of the image is influenced by ship activities and moderate waves causing glint effect surrounding the study area.
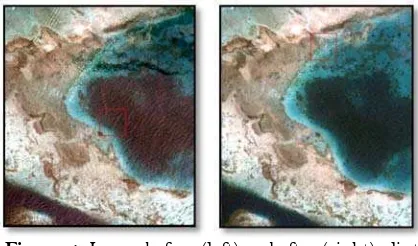
Atmospheric and glint removal were done at once since visual quality of the image is reasonable. The process was done only for glint removal using basically identical equation with atmospheric correction. Worldview-2 image before and after correction can be seen in Figure 4.
Figure 4. Image before (left) and after (right) glint removal
2.3.2 Image Difference Ratio
Image difference is commonly used in vegetation analysis to enhance or extract vegetation properties, such as chlorophyll, age, or even biomass (Gao, 2009). In vegetation remote sensing analysis, a well-known image difference is Normalized Difference Vegetation Index (NDVI). For shallow-water bottom mapping, this image difference ratio has been demonstrated by Collin et al. (2012). This research tried to apply the same concept of image difference to sea bottom object. Sea bottom object has higher reflectance in coastal blue and blue band while sea bottom object has lower peak reflectance in red or NIR band. The image difference ratio bands should have both higher and lower reflectance of sea bottom object. Thus, it used the combination of coastal blue and yellow band, yellow and red-edge band, and coastal blue and red band. Equation to produce image difference ratio is:
Image difference = (band Wi – band Wj) (band Wi + band Wj)
in which Wi is yellow or red-edge or red band, Wj is coastal blue or yellow band.
1
The first image algorithm assessed in this research is Lyzenga et al. (1978 and 2006). The basic concept of the algorithm is enhancing shallow-water bottom habitat by omitting water column effect, called water-attenuation. Lyzenga et al. (1978 and 2006) used green and blue band as the best band-combination in enhancing shallow-water bottom habitat. Then, image algorithm was done using the following equation:
Y = (ln Band1) - (ki/kj*ln Band2)
Lyzenga et al. (2006) tried to overcome and calibrate the variation of water attenuation by developing more complicated equation. However, this research used a simple linear equation to calibrate the estimated depth information from Lyzenga using real depth measurement derived from GPS MapSounder. This step is considered effective because it is quick and shows the agreement between estimated and real data.
2.3.4 Bottom Albedo-independent
Bathymetry Algorithm
The use of bottom albedo-independent bathymetry algorithm developed by Stumpf and Holderied (2003) is also demonstrated by Lyons et al. (2011). This algorithm uses a ratio of observed reflectance and two constants to derive depth information. Using real depth measurements, relative water depth derived from the algorithm was calibrated to obtain absolute water depth. Formula for calculating relative depth based on Stumpf and Holderied (2003) is:
= 1 ln Rw(λi) − 0 ln Rw(λj)
In which Rw is the observed reflectance of the wavelength (λ) for bands i and j, m1 and m0 are constants.
2.3.5 Real Depth Measurement
Depth measurement obtained from shallow water sounding was used for both calibration and produced shallow-water bottom surface DEM. Total points of real depth measurement is 24,844 points, 70% of which is used for calibrating the depth estimation in each model. Remaining points are used for accuracy assessment which is mainly based on R2
calculation and residual depth data.
Using sounding data, shallow-water bottom surface derived from krigging model was created in specific grid spacing comparable to Worldview-2 pixel size and median filter which are applied in depth estimation model. This step is intentionally to
do in order to reduce horizontal error between real depth data and estimation model.
Figure 5. Krigging method was used to obtain shallow-water bottom surface DEM.
2.3.6 Median Filter
Median filter was applied to obtain fine image result or reduce high frequency noise resulting from estimation model. This research applied 4 median filters to each estimation model. The median filters used in this research are: kernel 3x3, 5x5, 7x7, and 15x15.
Result from each estimation model is expected to reduce high difference between pixel values in their neighbourhoods. Thus, pixels in neighbouring area could have approximately similar value. However, smoothing over neighbouring pixels could have smoother result and even omitting small shallow-water bottom object (ENVI, 2005).
3. Results
Each estimation model was calibrated using 70% of the real depth measurement data derived from MapSounder. From image difference ratio processing, there are three combination bands resulting three depth estimation models. The three combination bands are coastal blue vs. yellow, coastal blue vs. red, and yellow vs. red-edge. Image difference ratio band combination resulted in low R2
of the linear model respectively: 0.568, 0.507, and 0.465. This model was run in median filter using kernel 3x3.
Based on simple linear model above mentioned, the best band combination is between coastal blue and yellow bands. In the next step, this image difference ratio was processed using other median filters such as kernel 5x5, 7x7, and 15x15. As a result, the linear model with R2 of 0.571, 0.577, and
0.578 was produced. Chosen model with the best R2
was used to produce bathymetric image.
1
kernel 15x15 might be omitting important benthic habitat information even though it is giving best fit of the model. To meet two research purposes, all of image difference ratio results using 4 different median filters (R2 of 0.568, 0.571, 0.577, and 0.578)
were assessed.
Insignificant results were showed by depth-estimation algorithm (Lyzenga et al., 1978). Based on the four different median filter processes, linear model resulted from this algorithm showed poor R2.
This finding was contradictory with results by Lyon et al. (2011) who showed a good R2 in linear model.
The R2 resulted from linear model based on each
median filters respectively are: 0.0595, 0.0591, 0.0588, and 0.0586. Thus, for following processes and analyses, this algorithm will not be presented.
The last model was bottom albedo-independent bathymetry algorithm developed by Stumpf and Holderied (2003). There are two models demonstrated using this algorithm, i.e. linear and non-linear model. Worldview-2 bands used in this process are coastal blue and yellow bands. This is the best band combination used for bottom albedo-independent bathymetry algorithm as compared to blue and red banda.
Both linear and non-linear model resulting from bottom albedo-independent bathymetry algorithm have slightly similar R2 value. However, the best fit
model was generally shown by non-linear model specifically using median filter kernel 15x15. Complete R2 resulting from linear and non-linear
models is shown in the Table 1.
Table 1. R2 resulting from linear and non-linear
model
Model 3x3 5x5 7x7 15x15
Linear 0.587 0.592 0.595 0.597
Non-linear 0.670 0.684 0.693 0.700
Shallow-water bottom surface derived from krigging model used as a bathymetric reference for above mentioned estimation model was also created in various grid spacing ranges from 2 up to 30 meter. Based on visual observation of the resulted DEMs, grid spacing determines the model smoothness. Wider grid spacing produces smoother model. However, in terms of accuracy, R2 value
showed different result. Wider grid spacing produces lower R2 value. This R2 value is calculated
as accuracy assessment using 30% of the total real depth measurement data. Moreover, DEM with narrow grid spacing showed unrealistic view compared with the wider one. In general, all of R2
derived from krigging model to build surface DEM is very satisfying with values above 0.900.
4. Discussion and Conclusion
Sea (shallow-water) bottom morphology and bathymetric mapping could not be analyzed separately. Shallow-water bottom morphology identification needs depth information to identify the roughness of the bottom surface. Shallow-water morphology is important to address information about benthic habitat. Therefore, it needs both depth information and thematic information of the bottom surface. Accurate bathymetric and thematic information is essential for enhancing benthic habitat identification using image.
Shallow-water bottom surface derived from krigging model is a proper way to obtain accurate depth information (with all R2 value above 0.900).
However, it loses a lot of bottom surface morphological detail which is important in benthic habitat identification.
On the other hand, image-based bathymetric derived information showed moderate to poor accuracy (with R2 value range from 0.700 to 0.500.
The bathymetric accuracy is determined by R2 and
average residual depth data. The comparison of accuracy between shallow-water bottom surface derived from krigging model and image-based bathymetric derived information can be seen in Table 2.
Table 2. R2 and average residual depth data from
each selected model
Model 3.3 res 5.5 res 7.7 res 15.15 res
IDR .579 .674 .583 .671 .586 .667 .590 .664
Lin Z .625 .475 .606 .498 .607 .498 .607 .502
NLin Z .714 .805 .707 .724 .710 .644 .711 .538
DEM .998 .222 .992 .456 .996 .394 .963 1.145
in which
IDR : image difference ratio
Lin Z : bottom albedo-independent bathymetry algorithm (linear model)
NLin Z : bottom albedo-independent bathymetry algorithm (non-linear model)
DEM : krigging model to build bottom surface DEM
res : average residual depth data
1
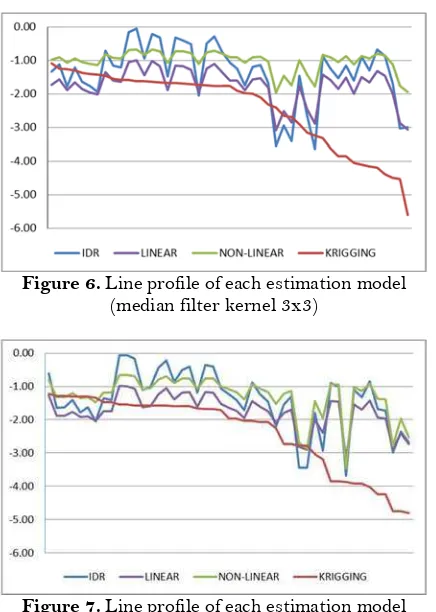
bathymetric derived information provides more varied shallow-water bottom morphology. Shallow-water bottom surface derived from krigging model tends to interpolate or connect real depth information without considering pixel or digital number. Figure 8 shows the resulted bottom profiling.
Figure 9 shows the difference between shallow-water bottom surface derived from krigging model and image-based bathymetric data in representing shallow-water bottom surface morphology. DEM of shallow-water bottom surface derived from krigging model shows unrealistic surface compared to DEM of image-based bathymetric estimation model since the lack of field measurement data. This weakness could be reduced by using pixel or digital number in image-based bathymetric estimation model.
Figure 6. Line profile of each estimation model (median filter kernel 3x3)
Figure 7. Line profile of each estimation model (median filter kernel 15x15)
Figure 8. Blue line is a line graph for bottom profiling
As an important note, detailed shallow-water bottom surface morphology represented by image-based bathymetric data still needs to be enhanced and verified on the field. It is because the depth residual of the estimation model is still around 0.5 to 1 meter, which means that shallow-water bottom morphology illustrated by the model is not really representing real detail morphology on the field. This is an important aspect in distinguishing between coral cover and rubble. Finally, the interpreters still have to recognise those two difference morphology by its spectral reflectance (digital number).
Figure 9. DEM derived from krigging model (above) and image-based bathymetric estimation
model using non-linear median filter (below).
ACKNOWLEDGEMENTS
The authors would like to acknowledge Center for Thematic Integration and Mapping, BIG for supporting the research and Marine Science Department, IPB for sharing the data.
REFERENCES
Alsubaie, N.M. (2012). Thesis: The Potential of Using Worldview-2 Imagery for Shallow Water Depth Mapping. Departement of Geomatics Enggineering. University of Calgary: Calgary, Alberta.
1
DigitalGlobe. (2009). White Paper – The Benefits of the 8 Spectral Bands of Worlview-2.
ENVI. (2005). Envi Help. Exelis, Inc.
Guntur, D. Prasetyo, & Wawan. (2012). Pemetaan Terumbu Karang Teori, Metode, dan Praktek. Bogor, Ghalia Indonesia.
Jay Gao. (2009). Bathymetric mapping by means of remote sensing: methods, accuracy and limitations. Progress in Physical Geography, 33(1), 103–116.
Lyzenga, D.R. (1978). Passive Remote Sensing Techniques for Mapping Water Depth and Bottom Features. Applied Optics, 17, 379–383.
Lyzenga, D.R., Malinas, N.P., & Tanis, F.J. (2006). Multispectral Bathymetry Using a Simple Physically Based Algorithm. IEEE Geoscince and Remote Sensing, 44, 2251-2259.
Madden, C.K. (2011). Thesis: Contribution to Remote Sensing of Shallow Water Depth With The Worldview-2 Yellow Band. Naval Postgraduate School: Monterey, California.
Lyons, M., Phinn, S. & Roelfsema, C. (2011). Integrating Quickbird Multi-Spectral Satellite and Field Data: Mapping Bathymetry, Seagrass Cover, Seagrass Species and Change in Moreton Bay, Australia in 2004 and 2007. Remote Sensing, 3, 42-64.
Stumpf, R.P., Holderied, K. & Sinclair, M. (2003). Determination of water depth with high-resolution satellite imagery over variable bottom types, limnology. Oceanography, 48(1), 547–556.
SEMINAR PROCEEDING
International Seminar and Workshop on Hydrography
Roles of Hydrography in Marine
Industry and Resources Management
iii
C
C
C
o
o
o
m
m
m
m
m
m
i
i
i
t
t
t
t
t
t
e
e
e
e
e
e
Steering Committee
Head of Geospatial Information Agency, Dr. Asep Karsidi, MSc Head of National Land Agency, Hendarman Supandji, S.H., M.H., C.N. Head of Hydro-Oceanographic Office, Laksma TNI Aan Kurnia, SSos Head of Indonesian Surveyor Association, Ir. Budhy Andono Soenhadi, MCP Head of Indonesian Hydrographic Society, Prof. Dr.-Ing. Sjamsir Mira
Reviewer and Scientific Committee
Prof. Dr. Widyo Nugroho SULASDI (Bandung Institute of Technology) Prof. Dr. Hasanuddin Z. Abidin (Bandung Institute of Technology) Prof. Dr. Razali Mahmud (University of Technology Malaysia-Malaysia) Prof. Dr.-Ing. Delf Egge (Hafen City University, Hamburg, Germany)
Organizing Committee
Chair : Dr. Ir. Samsul Bachri, M.Eng
Co-chair : Ir. Tri Patmasari, MSi
Finance : Sylvia Nayoan
Secretary : Ir. Nanang Henky Suharto
Co-secretary : Wiria Indraswari, SE
Sponsorship : Ir. Fuad Fachrudin
Publication : Ir. Syartoni Kamaruddin
Security and Permit : Kol. Laut Daryanto
: Letkol. Laut Nurriyadi
Coordinator of Seminar : Dr.rer.nat. Wiwin Windupranata, ST., MSi
Publication : Agung Pandi Nugroho, ST.
Sella Lestari, ST, MT
Design : Auzan Kasyfu Ambara
Registration : Intan Hayatiningsih, ST, MSc
Alifiya Ikhsani Apriliyana
Coordinator of Exhibition : Renny Rachmalia, ST.
Coordinator of Workshop : Kol. Laut. Trismadi
Co-coordinator : Drs. Win Islamudin Bale
Class Coordinator : Fajar Triady Mugiarto, ST, MT
iv
O
O
O
r
r
r
g
g
g
a
a
a
n
n
n
i
i
i
z
z
z
e
e
e
r
r
r
a
a
a
n
n
n
d
d
d
S
S
S
p
p
p
o
o
o
n
n
n
s
s
s
o
o
o
r
r
r
Main Organizer
Indonesian Surveyor Association, Ikatan Surveyor Indonesia (ISI) Indonesian Hydrographic Society, Masyarakat Hidrografi Indonesia (MHI) Geospatial Information Agency, Badan Informasi Geospasial (BIG) National Land Agency, Badan Pertanahan Nasional (BPN)
Naval Hydro-Oceanographic Office, Dinas Hidro-Oseanografi (DISHIDROS)
Co-Organizer
Bandung Institute of Technology, Institut Teknologi Bandung (ITB) Batam State Polytechnic, Politeknik Negeri Batam (Poltek Batam) Maritime University Raja Ali Haji, Universitas Maritim Raja Ali Haji (UMRAH) Naval Hydro-Oceanographic Training Centre, Pusat Pendidikan Hidro-Oseanografi (PUSDIKHIDROS) Riau Islands Province Government, Pemprov Kepulauan Riau Batam Indonesia Free Zone Authority, Badan Pengusaha Batam (BP Batam)
Gold Sponsor
Silver Sponsor
Workshop Sponsor
-
v
Dear Hydrographers and Distinguished Guests,
It is my great pleasure to have this opportunity to welcome many participations from countries all over the world. I am very pleased to be grateful for all of you to the International seminar and Workshop on Hydrography on behalf of the organising committe and all those who have constributed to this Seminar and workshop.
It was December 2012, when the Indonesian Surveyor Association (ISI) and Indonesian Hydrographic Society (MHI) began to initiate the first International Hydrography Seminar in Indonesia, since then the various preparations for the Seminar have progressed steadily, especially through the hard work of the Organising committee.
The objective this seminar is to share and perceive the development of science, technology as well as human resources on hydrography in the world. Futhermore, workshop is intended to develop the capacity of human resources on the ability of Hydrography.
Our Seminar’s theme : “ the roles of Hydrography for marine Industry “ was selected partly due to the significant important for Indonesia which is an Archipelagic country, and has abundant marine resources.
I am sure that our Seminar and Workshop will constribute to a substantial progress in approaching the goals of sustainable development marine Industry in the local and global scale, one of the central problems of contemporary hydrography.
This event is organized by ISI and MHI incorporate with Geospatial Information Agency (BIG), Hydro-Oceanographic Office (DISHIDROS), Bandung Institute of Technology (ITB) and National Land Agency (BPN). Moreover, the constribution of KOSNBERG, CARIS, FUGRO, and other stakeholders who have provided significant assistance to run this seminar and workshop.
We sincerely this Seminar and workshop will be a forum for productive discussions and learning by all participations.
With the great success of seninar and workshop on Hydrography 2013, I sincerely wish that you have an enjoyable stay in Batam of Riau Islands Province and have nice time in this wonderful country
Samsul Bachri, Chair of the Organising Committee
vi
Dear All Participans,
First of all, I would like to thank to the Mighty God, Allah SWT and all supporting organizations and institutions which make this INTERNATIONAL SEMINAR AND WORKSHOP ON HYDROGRAPHY (ISWH 2013) happen. The event is organized by Indonesian Surveyor Association (ISI) and Indonesian Hydrographic Society (MHI) together with Geospatial Information Agency (BIG), Hydro-Oceanographic Office (DISHIDROS), Bandung Institute of Technology and National Land Agency (BPN). It is an honour for ISI and MHI to organize the first event of hydrographic-related seminar in Indonesia. The seminar is intended to identify development of science, technology as well as human resources in hydrography in the world, particularly Indonesia and ASEAN region to support sustainable development planning and maritime industry.
As it is defined by International Hydrographic Organization (IHO), hydrography is the branch of science which is dealing with measurement and description of the nature and configuration of seabed and the dynamics of water bodies. Hydrography plays an important role in any aspect of maritime and coastal development. It is related to basic knowledge of the geographical, geological and geophysical features of the seabed and coast, as well the currents, tides and certain physical properties of the sea water. In brief, Hydrography is the key to progress on all maritime activities, normally of great national economic importance.
In addition to supporting safe and efficient navigation of ships, hydrography underpins almost every other activity associated with the sea, including resource exploitation, environmental protection and management, maritime boundary delimitation, national marine spatial data infrastructures, recreational boating, maritime defence and security, tsunami flood and inundation modelling, coastal zone management, tourism and marine science.
Indonesia, with 17,508 islands, 81,000 km of coastline, and 3.1 million km2 of maritime area is the largest archipelagic country in the world. Based on the United Nations Convention on the Law of the Sea 1982, Indonesia has a sovereign right to utilize and manage the Exclusive Economic Zone (EEZ) as large as 2.7 million km2. Its coastal and marine area has a huge number of both renewable as well as unrenewable resources. In order to utilize and manage the marine and coastal resources properly, it is required to have an appropriate geospatial data infrastructure for planning, execution, and evaluation, which are regulated by law and public policy.
Bathymetry, seabed features, as well the currents, tides and certain physical properties of the sea water are types of marine and coastal geospatial information. Related to the Geospatial Information, Indonesian Government has produced a National Law Nr. 4/2011 about Geospatial Information to assure availability of and access to responsible and accurate geospatial information as well as to establish expediency of those geospatial information.
As the official Geospatial Information Agency in Indonesia, Geospatial Information Agency (Badan Informasi Geospasial-BIG) has deliver a National Act Planning through an inter-governmental agencies and departments coordination meeting to support efficient and effective spatial decision support system for national sustainable development planning.
In July 2002, the revised Chapter V of the IMO Safety of Life at Sea (SOLAS) Convention entered into force. Under the new Regulation 9, the Contracting Governments of SOLAS are now required to provide and maintain Hydrographic Services and products.
Many charts which were adequate a decade ago, may have to be recompiled using new survey data, collected to a higher degree of accuracy and providing improved coverage. This deficiency may not be limited to sparsely surveyed waters of developing nations, but may also apply to the coastal waters of major industrial states. The advent of accurate satellite navigation, has made poorly positioned historical data an even greater problem for navigators. Fortunately, new survey technologies have improved the precision to which modern hydrographic surveys can be conducted.
vii
Indonesian Surveyor Association (ISI) is a professional organization for surveyors which was established on 27 June 1972. It has a long history on supporting geodetic, surveying, mapping and geospatial information projects in Indonesia. ISI was created based on the same vision of surveying and mapping experts to place the human resources development as the key component for development of geospatial information science and technology. Since 2008, Indonesian’s hydrographer society created an official organization to support hydrographic science and technology development as well as an exchange and discussion media for all hydrographic survey experts and companies in Indonesia. This organization was initiated by Prof. Dr. Ing. Sjamsir Mira and is named as Masyarakat Hidrografi Indonesia (MHI) or Indonesian Hydrographic Society.
Finally, I would like to great all participants of ISWH2013. Citing the Indonesian Navy motto, Jalesveva Jayamahe, ON THE SEA WE ARE GLORIOUS, I wish you to have a very nice seminar and workshop event
Cibinong, 17 August 2013 Head of Indonesian Surveyor Association
ix
TABLE OF CONTENTS
Page
Ship Detection based on Synthetic Aperture Radar Technique Agustan
Rubby Sidik Agustino
1
Mapping of Coastal Vulnerability Index on Coastal Erotion In The Perspective of Eeconomy (Study Area: Kecamatan Muara Gembong, Kabupaten Bekasi)
Aldila Pradhana, S.T. Dr. rer. nat. Wiwin Windupranata, M.Si.
Dr. Ir. Dwi Wisayantono, M.T.
9
The Spatio Temporal Dynamic of Diffuse Attenuation Coefficient In The Tropical Berau Estuary, East Kalimantan Indonesia
Wiwin Ambarwulan Widiatmaka
21
Mapping Multi Coastlines With Multi-Tidal Imageries Fahmi Amhar Habib Subagio Tri Patmasari
29
Identification Problem of Marine Cadastrein Indonesian Archipelagic Perspective
Yackob Astor
Widyo Nugroho SULASDI S. Hendriatiningsih Dwi Wisayantono
33
The Comparison of Bathymetric Estimation from Three High Resolution Satellite Imagery
Samsul Bachri
Muhammad Banda Selamat Vincentius P Siregar Sam Wouthuyzen
43
The Progression of Multi-Dimensional Water Column Analysis in a Processing Environment
Corey M. Collins Andrew Hoggarth Matthew Holland
51
Variability of Sea Surface Temperature and Sea Surface Salinity in the Ambon Bay and its Relation to ENSO/IOD and Monsoon
Corry Corvianawatie* Mutiara Rachmat Putri Sri Yudawati Cahyarini Willem Merpy Tatipatta
55
The Calculation of Erosion and Sedimentation Rate in Coastal Zone Using Satellite Imageries (Case Study: Kecamatan Muara Gembong, Kabupaten Bekasi, West Java)
Dianlisa Ekaputri, S.T. Dr. rer. nat. Wiwin Windupranata, M.Si. Dr. Agung Budi Harto, M.Sc.
61
Reconstructing Disrupted Water Level Records in A Tide Dominated Region Using Data Mining Technique
Hidayat Fajar Setiawan Unggul Handoko
71
Initiative on Implementation of 3D Cadstre In Indonesia Sri Karina, ST, DEA Deni Santo, ST Dr. Trias Aditya Dr. Eka Djunarsjah, MT
77
Geomatics Roles In Capacity Building For Hydrographic Mapping at Prigi Beach
Khomsin Yuwono
Akbar Kurniawan
89
The Coastal Platform Morphodynamics Characteristics Belang Bay, North Sulawesi Province
Joyce Christian Kumaat Sontje Tonly Boy Kandoli Agnes Tenly Moningkey
93
Evaluation of Warm Water (thermal) dispersion using a numerical model at the Binceta Coast (North Sulawesi) in PLTU Development
Mahatma Lanuru 97
RV Baruna Jaya Marine Data Processing and Information Management
Imam Mudita Fineza Ilova Ratna Juwita
107
Study On The Other Possible Applications of The Aavailable Tie Points of The Basepoints In Indonesia
Rorim Panday Sri Handoyo
x Natural to anthropogenic influence of environmental change of
Jakarta Bay: seismic reflection and sediment coring studies
Haryadi Permana Rina Zuraida Susilohadi Kresna Tri Dewi Nugroho Dwi Hananto Mustaba Ari. Suryoko Nazar Nurdin Eko Saputro Adi C. Sinaga
Septriono Hary. Nugroho
125
Marine Geoscientific Survey for Possible Extend of Indonesia Legal Continental Shelf Beyond 200 M at North Papua – Indonesia : A Preliminary Results
Catur Purwanto Nugroho D. Hananto Mustafa Hanafi Hersenanto C. Widi Rahadian
Rainer A. Troa Tumpal Bernhard Bisma J. Zakaria Ronald D. Michel Andi Wisnu
LKI 2013 Expedition Team
131
20071Pseudo 3D Sesmic Methods Using 2D Seismic Multichannel Data Taken From Offshore Karawang, West Java
Trevi Jayanti Puspasari, SSi Dr. Udrekh
Sumirah, S.Si
135
Study The Changes of SSH Value Using Altimetry Satellite In The NKRI’S Outermost Islands
(Case Study: Fani Island)
Dika Ayu Safitri Muhammad Taufik Yuwono
139
The Study of Sea Bottom Morphology and Bathymetric Mapping Using Worldview-2 Imagery
Iwan E. Setiawan Doddy M. Yuwono Vincentius P. Siregar Gatot H. Pramono
143
People and The Environmental Change: Impact and Aadaption Model
Dewayany Sutrisno 151
Designing of Decission Support System For Maritime Boundary Management In South China Sea
Trismadi S. Sutisna K.B. Seminar Machfud
159
Hydrodynamic Condition of Kapuas Kecil River, Pontianak Based On Simulation Model
Iswiati Utamiputeri Mutiara Rachmat Putri Zainal Arifin