Factors Influencing Obesity on School-Aged Children
Soepardi Soedibyo, Tinuk Meilany
Abstrak
Anak usia sekolah 6-12 tahun, di kota besar mempunyai aktivitas fisik yang kurang dan gaya hidup yang santai. Fast food dan soft drink yang dikonsumsi mengandung kalori dan protein tinggi berasal dari protein dan karbohidrat. Obesitas mempunyai dampak terhadap tumbuh kembang anak terutama aspek psikososial. Faktor yang turut berperan mendukung terjadinya obesitas pada anak adalah keadaan sosial ekonomi, perilaku dan gaya hidup serta pola makan. Dilakukan penelitian deskriptif analitik secara seksi silang pada murid sekolah dasar di Jakarta, untuk mengidentifikasi faktor yang berperan pada obesitas anak usia sekolah. (Med J Indones 2006; 15:43-54)
Abstract
School-aged children of 6-12 year old in big cities have less physical activities and relax life style. Fast food and soft drink consumed contain high calorie and protein of protein and carbohydrate sources. Obesity has impact on children’s growth and development especially on psychosocial aspect. The factors that play a role in supporting the obesity occurrence in children include socio-economic condition, behavior and life style and diet. A cross sectional descriptive –analytic study was conducted on elementary school students in Jakarta, to identify factors that play roles on obesity of school-aged children. (Med J Indones 2006; 15:43-54)
Keywords: childhood obesity, weight shape index, body mass index
School-aged children of 6-12 year old indicated growth rate pattern that at first is slow but relatively stable and followed with the growth rate acceleration at adolescent age. In addition to developing and growing phase, the school-aged children also experience life environment shifting, i.e. from house to school environment. The external influence will affect the
children‟s attention and interest, including in diet and
nutrition.
Children usually go to school early in the morning so that they usually miss the breakfast. Similarly, they have no time to get lunch at home, so they have to buy out-home snack12. The types of snack they prefer easily/usually? are fast food and soft drink, which are available at school canteens. The foods contain high calorie and protein, originated from fat and carbo-hydrate. Fast food tends to contribute high calorie
since 40-50% of which are from fat, containing high level of sodium, but the level of calcium, iron, vitamin A is low.
Parents, teachers and friends of school-aged children have important roles in influencing the children‟s attitude, behavior, and emotion by influencing eating desire, which commonly have a good eating desire.4
By epidemiological measurement, the school-aged children in big cities have less physical activities but in contrary they have relax life style. They are used to spend their spare time by watching television for a long duration, and eat high calorie snack and soft drink, playing computer, play station or other electronic media games, and relatively have infrequent out-door activities such as walking, running and bicycling. Likewise for transportation toward their school, most of them using car than walking or bicycling.5 The factors of socio-economic, education and family per-ception on obesity need consideration, because most of parents still assume that fat children look cute and lovely, which has been interpreted as healthy.6 Among older children, especially among girls, they usually try Department of Child Health,Faculty of Medicine, University of
to decrease their weight by themselves by inappropriate measures, so that other nutritional problem is emerging, such as anemia, of deficiency of other macronutrient.7
Until now, childhood obesity is still a very difficult problem to overcome because it has multifactor etio-logies that have mutual interaction. Obesity has serious impact on child‟s growth and development, especially on psycho-social aspect. Beside that, childhood obesity is a high-risk factor for adulthood obesity and conse-quently caused hypertension, cardiovascular, metabolic and orthopedic disorder.8 The obesity prevalence in American children tends to increase, from 15% to almost 30% and it occurs in elementary school-aged children i.e. from 6-12 years old. Forty percent of childhood obesity may continue up to adolescence, and 75-80% obesity of that period may continue to adulthood period.9 In Indonesia, most of obesity occurs in childhood and adolesence.7
The priority in management of obesity is prevention, so that children will not get obese or obesity that has been occurred will not be more severe and they may avoid the complication of hypertension, cardiovascular disorder, hyperlipidemia, fatty liver, diabetes and etc. The therapeutic program of childhood obesity is by comprehensive approach i.e. on child as the obese patient and also on the family. The measures include behavior modification, enhancing activities and diet management.
The objective of such therapy is to prevent the risk of persistent obesity in adulthood period and risk of disease caused by obesity. Until now, the management of childhood obesity has not contributed any satisfied result, because changing behavior is a very hard problem, hence the compliance to therapy is still disappointing.
The above mentioned description of background become principles of defining problems as follows: How is the impact of risk factors which assumed having role on obesity of school-aged children, i.e. in students of elementary school at Elementary School of Tarakanita 5, Islamic Elementary School of Al Azhar 13, Rawamangun and Islamic Elementary School of Kelapa Gading in Special Capital District of Jakarta.
The aim of this study is to recognize factors that might play roles on childhood obesity i.e. effect of family, friends, teachers and obesity in the family.
We expect that this study maybe useful as principles of arranging integrated program regarding all related aspects on management of childhood obesity especially which is related to the environment.
METHODS
This study was an analytic-descriptive study with cross sectional design, to identify the factors deemed play role on obesity. This study was conducted in 254 elementary students of class I to V, whom has been diagnosed as obesity at Tarakanita 5 Elementary School, Islamic Elementary School of Al Azhar 13, Rawamangun and Islamic Elementary School of Kelapa Gading in North Jakarta. This study was began on May 1st 2001 and completed by June 30th 2001.
Target population was obese elementary students of class I to V.
Extent population was 254 obese students of class I-V at Tarakanita 5 Elementary School, Islamic Elementary School of Al Azhar 13, Rawamangun and Islamic Elementary School of Kelapa Gading in North Jakarta. The study subjects were obese students of class I-V who meet the study criteria‟s.
Estimation of sample size that minimally required in this study, which was calculated by Rule of thumb: 10 x 23 = 230. The estimation of drop out probability was 10%; hence the sample size was 254 children.
The inclusion criteria for this study was elementary students with obesity of three Elementary Schools that have been determined in Jakarta, starting from class I to V, and had informed consent from their parents to join the study.
The exclusion criteria were uncooperative patients, having endocrinology disorder or congenital syndrome. Children with any symptoms or attacks during
exami-nation that may distract the child‟s participation in
this study, were also excluded.
The Study Protocol
1. Screening Test
Screening test of previous study found 631 obese children and of 631 children 254 were studied to recognize factors that play a role on obesity.
2. Inform consent
All participants were asked for written permission to their parents or custody on informed consent form.
3. Invitation and dietary form
Direct explanation for the students and mailed explanation for the parents have been conducted. The explanation includes methods of dietary intake notes for 5 days on dietary form. The dietary form was given on (Day)-7 before data collection. On the Day, nutritional expert invited parents of study subject for interview and confirmation of dietary note using food model. If they were not present, then re-agreement was set for the next session, and if they still could not present, then the home visit was conducted.
4. Data collection
a. Physical and anthropometrics examination including: Body weight, Body Height, Upper Arm Circumference (UAC), Skin-Fold Thick-ness (SFT), waist circumference.
b. Interview for the subject. Questioner filling-up for the presence parents or mailed.
c. Interview of nutritional experts with subject and parents to confirm the dietary notes
5. Interpretation of measurement result
The parameter that has been used to evaluate childhood obesity was body mass index, which
was ≥ percentile (P) 95 and body mass index
against height was > 120%.
Operational Definition
1. Subject
The subjects of this study were 254 obese students of three Elementary Schools in Jakarta. They were recruited from previous study and appropriate to inclusion and exclusion criteria.
Subjects consist of 157 male and 97 female aged 6 to 12 years. The children age was obtained from birth-date note on questioner and supported by the school. Age was expressed in years; 5 years mean
5.00 – 5 years 11 months 29 days; 6 years = 6.00
– 6 years 11 months 29 days; 7 years= 7.00 – 7 years 11 months 29 days and etc. The year completion was conducted based on calculation and consideration by the formula in table (appendix). The age group was classified into 3 groups 5-7 years, 8-10 years and 11-13 years.
2. Measurement and intervention
Body weight was measured by Detecto scale, which has been standardized before with capacity up to 125 kg. The note was expressed in kg with decimal (sensitivity to 0.1 kg). All of subjects were weighted in bare foot and only use daily school uniform.10
Body height was measured by height scale, made of metal, with 1 mm calibration. The children height was measured in stood upright position and straight forward faces without any shoes. In order to see the result of height measurement, triangle ruler made of wood was placed, upright to the measures, precisely above the head.
The result of Body Height and Body Weight was
used to evaluate child‟s obesity status i.e. body
weight index to height is >120% and body mass index (BMI) based on age and sex P95.
Upper Arm Circumference was measured by specially–design equipment to measure the upper arm circumference by Child Health Department, Faculty of Medicine, University of Indonesia, Cipto Mangunkusumo Hospital.
The equipment made of plastic that unable to
“stretch”. The measuring tape was calibrated to 1 mm.
Measurement was conducted on half of left upper arm, superior to half olecranon and acromion in suspended hand.11 The result was presented in percentile in keeping with age and sex (Appendix)
The measurement of scapula SFT was conducted on lateral inferior of left arm.
The supra-iliac Skin Fold Thickness was measured on mid-axillary‟s line, slightly superior to the top of left iliac. By analysis of obesity assessment we used Triceps SFT in percentile.
The waist and hip circumference was measured by subject in stand upright position, both of arm besides, stomach relax, the location is at the level of half lowest rib to the top of iliac in
mid-axillary‟s line. The measurement of hip circum -ference was encircling at the level of maximum protuberance of the buttocks. The optimal comparison of waist to hip ratio was not over than 0.8. That index was related to morbidity risk. If the index is 0.8 than the risk of blood pressure elevation, cardiovascular disease and diabetes will also increase.1
The blood pressure measurement was conducted in quiet room and the child at quiet condition, using mercury-sphygmomanometer. The cuff measure was justified to age (6-12 years), i.e. 4 inches or 10 cm and for bigger child 5 inches or 12.5 cm cuff was provided. The patients were laid prone with straight-arm besides the body. The location for measurement was at right upper arm. Normal blood pressure for children age 6-12 years includes normal systolic (1st Korotkoff sound, the first-heard sound) 125 mm Hg (range 85-125), and normal diastolic (5th Korotkoff, diminished sound) 70 mm Hg (range 50-70).12
3. Obesity Classification
Classification of obesity based on BW/BH measure-ment result and was divided into three categories: - Mild Obesity / 1st degree 120 – 135% - Moderate Obesity / 2nd degree > 135 -150% - Severe Obesity / 3rd degree > 150 - 200% - Super Obesity (morbid) > 200%
4. Interview and questioner
The necessary additional data was obtained by inter-viewing subject/child and assigning questioner for the parents.
5. The Energy Intake
Variable of energy intake in this study were diet pattern and eating behavior (includes eating frequency, dining situation, other activities while
eating), and obesity-responsiveness. Data was
collected from the subject‟s dietary note, inter -view and diet analysis. Dietary note was obtained by 5 days - record method and food frequency daily consumption. Estimation about the amount of calorie and protein consumed was using household measurement, and then converted into caloric value. The calorie intake regarded as high intake if it was over 119% needs, and regarded as normal if it was between 90-119%, and regarded as low if it was below 90%.13
6. Energy expenditure.
In this study, we assessed the physical and exercise activities. Daily activities such as sleeping, playing, out-door playing, watching television and computer, transportation to school were evaluated for their type and duration and adjusted with expended calorie amount, and then it was compared to the standard on the appendix. Physical activity was categorized into mild, moderate and severe activity. The exercises at school such as swimming, running, bicycling, badminton, and football were calculated. The energy expenditure was categorized into mild, moderate and severe degree:
Severe : swimming for 30 minutes regularly 3x/week with an instructor, in-door/ out-door/ school activity (regular exercise 1 x / week)
Moderate : as above mentioned, but the exercise is conducted 1 x /week
Mild : never had any exercise, or occasionally exercise, and irregular without any instructor, including routine exercise at school, but no exercise at home.
7. The Role Factors
7.1. Attitude, eating behavior, and responsiveness of the obese children
7.2. Hereditary / parents‟ obesity
Parents who had obesity will be a predisposition for childhood obesity.14 The parents‟ obesity condition was divided into:
- High Risk (80%) : both of parents were obese - Moderate Risk (40%) : one of parents was obese - Low Risk (14%) : none of parents was obese
7.3. Family environment
Obese-Siblings
Obese siblings of obese family were divided into: No siblings or had no obese-siblings, had one or more obese-siblings.
The parents‟ education level
The parents‟ education level was obtained from highest education level among parents. The education level was divided into:
- High : academy/ university/ college - Moderate : Senior High School, Junior High
School or at same level
- Low : Elementary School, has not finished the elementary school
Family income level per capita
By calculating the amount of family income (father, mother and other family member divided with the amount of family burden), income level per capita was assessed. Income level per capita according to the World Development Bank Report 1994, and it was calculated by rupiah amount on March 22nd 1997, it was determined by using the criteria of:
- Low : income per capita < Rp 134,832.-/ month
- Moderate : income per capita between Rp 134,832 to Rp 1,664,733.-/ month - High : income per capita > Rp 1,664,737/
month
8. The Program of Data Preparation and Presentation We used the statistical program of SPSS version 10 to process and analyze data. The chosen significant level was < 0.05. To analyze the role factors, multi-variant test was conducted with multiple logistic regressions.
RESULTS
The Respondent Characteristics
The Elementary School of the study respondent was Tarakanita 5 (A) Elementary School, located at Jl. Pemuda No. 6, East jakarta, Islamic Elementary School of Al-Azhar 13, Rawamangun (B) at Jl Sunan Giri, East Jakarta and Islamic Elementary School of Al Azhar Kelapa Gading (C) at Jl. Boulevar Gading
Timur Kelapa Gading, North Jakarta. All of them are private schools, which have permanent school buildings, consist of three floors. The available exercise utilities were basket ball and volley ball court and at the C school there was swimming pool. The education of sport was conducted for 1 hour everytime, including running, gymnastic, basket ball, volley ball, - swimming and the self-defense sport as extra-curriculum course.
Every school had canteen which providing various dietary menu of food and drinks such as various dish of rice, noodles, potatoes, bread, meat ball, snacks, various drinks, soft drinks and candies. At those schools there were also cattering services for students.
The amount of students who meet the study criteria and participate in this study were 254 children, consist of 157 male and 97 female. The participants from School A were 75 children (29.5%), consist of 43 male and 32 female. From the School B, there were 97 children (38.2%), consist of 64 male and 33 female, and from the School C there were 82 children (32.3%), consist of 50 male and 32 female.
Subject Characteristics
Age and sex
Most of subjects consist of 8-10 years of age group (107 children), followed by 5-7 years of age group (74 children) and remaining 11-13 years of age group (73 children). The youngest age was 6 years old and the oldest was 12 years. Mean value of subject age for present study was 8 years, 6 months, with SD 1.50.
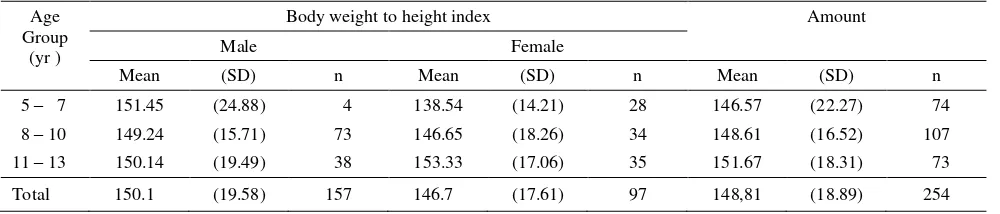
Body weight to height index
The lowest index of body weight to height was 122% and the highest index was 229%. In male subject, the mean value of body weight to height index was greater than female, i.e. 150.1 compare to 146.7. The mean value of body weight to height index was lowest in the age group of 8-10 years, and then increasing in the age group of 11-13 years. The highest value was for 5-7 years age group. While in female subjects, the lowest value was in 5-7 years age group, then increased on 8-10 years age group and the highest value was on 11-13 years. (Table 1)
Obesity Degree
children (27.5%) respectively, and the rest? was at super degree for 2 children (0.9%). Mild obesity? In moderate and severe obesity degree, there were greater amount increased in keeping with greater age, and the greatest was on 8-10 years of age group, then it was decreased on 11-13 years age group. In male, the sequential of greatest amount obesity was severe, moderate, mild and super degree, while in female was moderate, severe and mild obesity degree (Table 2).
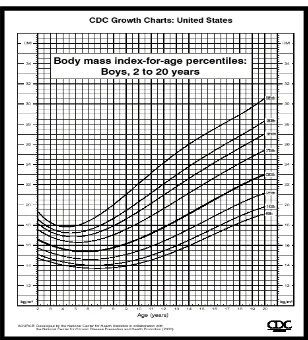
Body Mass Index
Body Mass Index (BMI) is one of measurement to determine the diagnosis of childhood obesity based on age and sex. BMI distribution of study participant started from 18.9 to 39.2 or with P95 to > P97. The greatest
number (73.2%) of both male or female were on percentile >P97, and increased in keeping with greater
age, but it decreased on 11-13 years group (Table 3)
Table 1. Distribution of mean value of body weight to height index based on sex and age group
Age Group
(yr )
Body weight to height index Amount
Male Female
Mean (SD) n Mean (SD) n Mean (SD) n
5 – 7 151.45 (24.88) 4 138.54 (14.21) 28 146.57 (22.27) 74
8 – 10 149.24 (15.71) 73 146.65 (18.26) 34 148.61 (16.52) 107
11 – 13 150.14 (19.49) 38 153.33 (17.06) 35 151.67 (18.31) 73
Total 150.1 (19.58) 157 146.7 (17.61) 97 148,81 (18.89) 254
Notes : The index of BW / BH is %BW compare to ideal BW consistent with BH: BW/BH – age group, Pearson correlation 0.103, with p 0.05;
BW/BH–sex, Pearson correlation 0.087 with p=0.08.
Table 2. The amount of subject according to obesity degree on the age group and sex
Age (years)
n BW/BH
Mild Moderate Severe Super
M F T M F T M F T M F T M F T
5 – 7 46 28 74 15 16 31 14 7 21 16 5 21 1 0 1
8 – 10 73 34 107 14 10 24 32 12 44 27 12 39 0 0 0
11 – 13 38 35 73 12 3 15 10 16 26 15 16 31 1 0 1
Total 157 97 254 41 29 70 56 35 91 58 33 91 2 0 2
Notes: BW, body weight (kg); BH, body height (m); M (male ); F(female); T(total); n= amount. BW/BH = obesity degree, in 4 level: Mi (mild): >120-35%, Mo (Moderate): >135-150%, Se (severe):>150-200%, Sp (super) >200%. Correlation: obesity degree-age x2 13.34 df=6 p=0.04. Obesity degree- male sex: x2 =7.07 df= 6, p=0.32 ; Female: x2 =17.7 df= 4 p=0.001
Table 3. The number of obesity students according to body mass index against age group and sex
Age (year)
BWBH2
n
P95 >P95-<P97 P97 >P97
M F T M F T M F T M F T M F T
5 – 7 1 1 2 5 7 13 1 2 3 39 20 59 46 28 74
8 – 10 4 1 5 7 8 17 1 1 2 61 24 85 73 34 107
11 – 13 4 2 6 9 11 24 3 2 5 22 20 42 38 35 73
Total 9 4 14 21 24 54 5 5 10 122 64 186 157 97 254
Figure 1. BMI distribution of female Figure 2. BMI distribution of male
Blood pressure
The result of systolic blood pressure examination ≤ P95 was 94.1% (239/254) and > P95 was 5.9% (15/254).
Diastolic blood pressure was 80.3% (204/254) on ≤ P95
and 19.7% (50/254) on > P95. The correlation of blood pressure elevation and BMI was not significant neither in systolic nor diastolic blood pressure. (table 4 and 5).
Table 4. The distribution of systolic blood pressure based on BMI
SBP
BMI
Total P95 > P95-97 P97 > P97
n % n % n % n % n %
≤ P 95 13 5 45 17.7 9 3.5 172 67.7 239 94
> P 95 0 0 1 0.4 1 0.4 13 5 15 6
total 13 5 46 18.1 10 3.9 185 72.7 254 100
SBP, systolic blood pressure X2 = 2.69 df = 3 P = 0.44
Table 5. The distribution of diastolic blood pressure based on BMI
BMI Amount
DBP P95 > P95-97 P97 > P97
n % n % n % n % n %
≤ P 95 11 4.2 42 16.5 9 3.5 142 35.5 204 80.3 > P 95 2 0.8 4 1.6 1 0.4 43 16.9 50 19.7 Total 13 5 46 18.1 10 3.9 185 52.4 254 100
DBP, diastolic blood pressure X2 = 5.74 df = 3 P = 0.13
Energy Intake
The mean energy intake of subject was 2272 calorie. Male subjects had energy intake exceed normal needs, and it was double amount of female subjects, the greatest number was on 8-10 years age group. Female
subjects with high energy intake was decreasing in keeping with greater number. In contrast, they consumed food with less calorie of normal needs, and the number was increasing in keeping with greater age. (Table 6)
Table 6. Caloric input of obesity students based on age group and sex
Age Group
Energy intake
Total amount
High Appropriate Low
M F T M F T M F T
5 – 7 36 19 55 4 4 8 6 5 11 74
8 – 10 51 18 69 22 9 31 0 7 7 107
11 – 13 28 12 40 9 14 23 1 9 10 73
Total 115 49 164 35 27 62 7 21 28 254
Notes: high energy intake: ≥120 %, appropriate: 90-119%, Low <90% of needs, consistent with daily recommended nutritional value / Widya Karya Nasional Pangan dan Gizi 1998
There was greater number of male subjects who consumed diet, which containing protein beyond normal needs compared to female subjects, and the number of subject consuming higher protein greater than appropriate or less than normal protein (Table 7).
Table 7. The subject‟s protein intake based on age group and sex
Age Group
Protein intake
Total amount
High Appropriate Low
M F T M F T M F T
5 – 7 41 23 64 4 2 6 1 3 4 74
8 – 10 55 17 72 13 8 21 5 9 14 107 11 – 13 25 12 37 11 11 22 2 12 14 73
Total 121 52 173 28 21 49 6 24 30 254
The recommended diet composition consists of 3 groups
i.e. carbohydrate, protein and lipid. The subject‟s diet
intake consists of: carbohydrate with range of 23-72% and mean value of 52.5%; protein with range of 7-31% and mean value of 11.8%; lipid with range of 17-52% and mean value of 35.03%.
The composition of subject‟s lipid intake, which was
> 30% greater than the ≤ 30%, were 183 compared to 71 subject. The chi square test on correlation of lipid intake percentage and obesity degree was not significant (p=0.71)
Physical Activity
50% of subject (127/254) had light physical-activity, 39.4% (100/254) had moderate physical activity and 10.6% (27/254) subject had heavy physical activity.
The correlation of physical activity and obesity degree
The subject who had heavy physical activity was decreasing in keeping with greater obesity degree, and in contrast, the subject with light physical activity was increasing in keeping with greater obestiy degree. The correlation was statistically significant (p < 0.05) (table 8).
Table 8. Physical activity level based on obesity degree
Activity level
Obesity Degree
Total Mild Moderate Severe Super
n % n % n % n % n %
Heavy 10 14.2 10 10.9 7 7.7 0 0 27 10.6 Appropriate 29 41.4 38 41.8 32 35.2 1 50 100 39.4 Light 31 44.4 43 47.3 52 57.1 1 50 127 50 Total 70 27.6 91 35.8 91 35.8 2 0.8 254 100
X2 = 3.826 df = 6 p = 0.008
The Influencing Factors
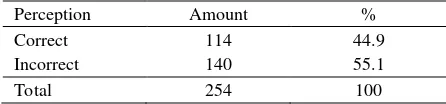
The subject’s attitude and behavior
Most of the subjects (55.1%) had incorrect perception about their obesity or other, and about 44.9% had correct perception. The correct perception deemed obesity harm the health. (Table 9)
Table 9. The subject‟s perception on obesity
Perception Amount %
Correct 114 44.9
Incorrect 140 55.1
Total 254 100
Eating behavior
70.5% subjects had bad behavior on their obesity, and 29.5% had good behavior. Bad behavior was regarding no effort of behavior of decreasing body weight such as over-eating, extra-diet, having snack while watching television. (Table 10).
Table 10. The subject‟s eating behavior
Eating behavior Amount %
Good 75 29.5
Bad 179 70.5
Total 254 100
There was greater number of bad eating behavior in 1, 2, 3, and 4 obesity degree compared to good eating behavior. The subject with 4th obesity degree had bad eating behavior. The eating behavior was significantly correlated to the obesity degree (p= 0.038), i.e the greater obesity degree, the worse eating-behavior. (Table 11)
Table 11. The correlation of obesity degree and eating behavior
Obesity Degree Eating behavior Good {n (%)} Bad {n (%)}
Mild 14 56
Moderate 33 58
Severe 28 63
Super 0 2
Amount 75 179
Chi-square test of correlation between obesity degree and eating behavior: X2=8.436 df=3 p=0.038
In present study, 55.9% of subjects still had bad responsiveness to overcome their obesity, such as some of them just occasionally or even never reduce their eating portion, extra-diet and never had any physical exercise. (Table 12).
Table 12. The subject‟s self-responsiveness of overcoming the obesity
Self-responsiveness of obesity Amount %
Good 112 44.1
Bad 142 55.9
Total 254 100
Table 13. The Correlation of responsiveness level and age
Age Responsiveness level Amount
Bad Good
6.00 – 6.999 10 6 16
7.00 - 7.999 35 23 58
8.00 - 8.999 32 26 58
9.00 - 9.999 30 20 49
10.00 – 10.999 21 16 38
11.00 - 11.999 13 21 34
12.00 - 12.999 1 1
142 112 254
Note: Bad responsiveness level if the score ≤ 5, good responsiveness level >5
The factor of family obesity
A. Parents
None of parents of 42.1% had any obesity, 32.7% subjects had both of parents with obesity and the remainder 25.2% had one of parents with obesity. (Table 14 ).
Table 14. Parents‟ obesity
Parents‟ Obesity Amount %
Both of parents 83 32.7
One of parents 64 25.2
None of parents had obesity 107 42.1
Total 254 100
B. Siblings
184 of 254 subjects had sibling with obesity, and the remainder had no obesity or had no sibling (Table 15)
Table 15. The Obesity in participant‟s sibling
The sibling‟s obesity Jumlah %
Had siblings with obesity 184 72.5 Had no siblings with obesity or
single-child
70 27.5
Total 254 100
The parents’ influence
33.1% subject got bad influence of obesity from their parents, 48% had moderate influence and 18.9% had good influence. (Table 16).
Table 16. The parents‟ influence
The influence level Amount %
Good 48 18.9
Moderate 122 48
Bad 84 33.1
Total 254 100
The parents’ education level
There was 74.5% subject‟s parents with high education
level (≥ Bachelor), 25.5% moderate education level
and there was no subject‟s parents with low education
level (completed Elementary School or uncompleted Elementary School)
Table 17. The parents‟ education level factor
Education level Amount %
High 190 74.5
Moderate 64 25.5
Low 0 0
Total 254 100
The parents’ income level
There were 51.8% subject‟s parents with high-income level (> Rp1,664,737,-), 48.2% with moderate-income level, and none of them had low-income level (< Rp 134,832.-) (Table 18)
Table 18. Factor of parents‟ income level
Income level per capita Amount %
High 132 51.8
Moderate 122 48.2
Low 0 0
Total 254 100
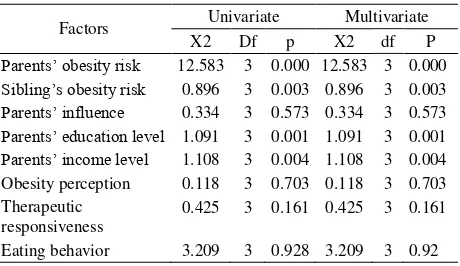
The deemed factors of obesity that were involved in
the management of subject‟s obesity were tested by uni-variant and multivariate test. We found that
parents‟ obesity risk, sibling‟s obesity, parents‟ high
education and income level were significantly correlated to BMI.
While the parents‟ influence, obesity perception,
obesity responsiveness and eating behavior were not statistically significant, p > 0.005.
Table 19. Factors on obesity against BMI
Factors Univariate Multivariate
X2 Df p X2 df P
Parents‟ obesity risk 12.583 3 0.000 12.583 3 0.000
Sibling‟s obesity risk 0.896 3 0.003 0.896 3 0.003
Parents‟ influence 0.334 3 0.573 0.334 3 0.573
Parents‟ education level 1.091 3 0.001 1.091 3 0.001
Parents‟ income level 1.108 3 0.004 1.108 3 0.004 Obesity perception 0.118 3 0.703 0.118 3 0.703 Therapeutic
responsiveness
0.425 3 0.161 0.425 3 0.161
DISCUSSION
The present study found greater number of obese male students compared to the female with comparison of 157 : 97. This result was different from SUSENAS result, i.e. obesity occurred more in female students. SUSENAS of 1989 found 4.6% obesity prevalence of male students and 5.9% in female students, while in 1992 there was increased number of male students 6.3% and female students 8%.15
The age of subjects in present study was ranging from 6 to 12 years old, with mean age value was 8 years and 6 months. This was consistent with the prevalence of obesity either in America1-3 or Indonesia, and it relatively occurred in children and adolescence.3 If we consider the school building of the studied elementary school, all of those private schools were represented students with middle-class to high-class socio economical status. Every school had canteen providing various dietary menu, such as rice, noodle, potato, various dishes, bread, meat ball, snack, and various drinks, soft drink and candies. This was consistent with the fact that most of the students prefer to having snack5,6 The selected diet was fast food and soft drink, which were available at the school canteen. Those diet contained high protein and calorie, which the calorie derived from lipid and carbohydrate. Fast food tends to give high calorie because 40-50% derived from lipid, has high sodium level, but low calcium, iron and vitamin A level.7 Tabel 1 indicated increasing obesity prevalence consistent with increasing age. Table 2 indicated that the most abundant obesity degree were moderate and severe degree, i.e. 91 children (35.8%) and 70 children (27.5%) respectively, and the remainder with super degree of 2 children (0.9%). In male subject, the sequential of greatest amount obesity was severe, moderate, mild and super degree, while in female was moderate, severe and mild obesity degree The diag-nosis of obesity in present study was based on Body Mass Index (BMI), BMI distribution, greatest parti-cipant number (73.2%) in percentile >P97. (Table 3).
While if it was correlated to blood pressure elevation, then there was no significant result between BMI and systolic or diastolic blood pressure, as indicated by table 4. It is very important because the long-period complication might occur related to the obesity such as hypertension, hemodynamic disorder, coronary heart disease risk.19,20
The present study indicated that the subject‟s food
intake had such composition: carbohydrate ranged from
23-72% and mean value of 52.5%, protein ranged from 7-31% with the mean value of 11.8%; lipid ranged from 17-52% with the mean value of 35.03%. These were not consistent with the recommended balanced diet of 50% carbohydrate, 30% lipid, and adequate protein for normal development and growth (20%).16,17 Based on other literature, the re-commended diet is food intake with low carbohydrate contain (48% of total energy), decreasing lipid intake (30% of total energy), with saturated lipid (10% of total energy), cholesterol below 300mg per day, and added high fiber diet.18 The composition of subject‟s lipid intake, which was greater for > 30% compared to the ≤ 30%, i.e. 183 compared to 71 subjects.
The chi-square test on correlation between percentage of lipid intake and obesity degree was not significant (p=0.71). This was not consistent with the literature that one of obesity etiology is high calorie with 40-50% of it derived from lipid.7
Fifty percent of subject (127/254) had light physical-activity, 39.4% (100/254) had moderate physical activity and 10.6% (27/254) subject had heavy physical activity. The subjects who had heavy physical activity were decreasing in keeping with greater obesity degree, and in contrast, the subjects with light physical activity were increasing in keeping with greater obestiy degree. The correlation was statistically significant (p < 0.05) (table 8). Other factors that also influenced obesity, such as incorrect obesity perception either to themselves or other (55.1%) and only 44.9% regard obesity harmful for health as described in Table 9.
Other factor was subject‟s behavior to their obesity,
that 70.5% subjects had bad behavior on their obesity, and 29.5% had good behavior. Bad behavior was regarding no effort of behavior of decreasing body weight such as over-eating, extra-diet, having snack while watching television. (Table 10).
Data indicated that children‟s physical activity tends to reduce, they had more in-door activity than out-door activity, they watched a lot of television program, including children program, apart from diet advertise-ment which influenced enhanced consumption of sweet diets or „extra-diet‟.16
Table 12 indicated that 55.9% of subject still had bad responsiveness to overcome their obesity, such as some of them just occasionally or even never reduce their eating portion, extra-diet and never had any physical exercise.
Subjects who had bad responsiveness were students of 6-10 years old, and decreased in keeping with greater age. From table 14 we found that only 32.7% subjects had both of parents with obesity and 25.2% had one of parents with obesity, while 42.1% subjects had none of parents with obesity.
Based on literature, we found that genetic factor plays important role as parental fatness, obese children usually came from obese family. If both of parents were obese, approximately 80% of their children will become obese. If one of parents, then the obesity occurrence is 40% and if none of parents was obese then the occurrence decreases to 14%. The increased risk of obesity might be caused by genetic or environment factor in the family.20,21
Considering the present percentage, environment factor in family also has important role beside the genetic factor causing childhood obesity. From table 15, we found that 184 of 254 subjects had sibling with obesity, and the remainder had no obesity or had no sibling. Thirty-three point one percent of subjects got bad influence of obesity from their parents, 48% had moderate influence and 18.9% had good influence as
noted on table 16. There was 74.5% subject‟s parents with high education level (≥ Bachelor), 25.5% moderate education level and there was no subject‟s
parents with low education level (completed Elementary School or uncompleted Elementary School). There
were 51.8% subject‟s parents with high-income level (> Rp. 1,664,737,-), 48.2% with moderate-income level, and none of them had low-income level (< Rp 134,832.-) (Table 18).
Those facts were consistent with literature which mentioned the factors supporting obesity occurrence are social, economic, ethnical and psychological factors. The alteration of knowledge, attitude, behavior, life style, diet pattern, and increment of income level, may affect the alteration type of food selection and its amount of consumption.22
For example, recently, in big cities we found the double-role mothers i.e. as housewife and carrier woman or working woman. This condition affected the diet pattern and the type of consumed diet. The
frequency of out-home dining tends to increase, primarily by school-aged children. The available snack frequently selected by parents or children is fast food or junk food.
The deemed factors of obesity that were involved in
the management of subject‟s obesity were tested by univariate and multivariate test. We found that
parents‟ obesity risk, sibling‟s obesity, parents‟ high
education and income level were significantly correlated to BMI. While the parents influence, obesity perception, obesity responsiveness and eating behavior were not statistically significant, p > 0.005.
CONCLUSION
Most of obese students with higher than standard energy intake were male students, and it was increasing consistent with greater age. In contrast, high-energy intake of female was decreasing consistent with greater age. The high protein intake in subject was consistent with high-energy intake.
Thirty percent of obese students had high adolescence obesity risk (both of parents were obese), and 25% had moderate risk (one of parents was obese). Most of obese students (70%) have obese siblings. Obese students have quite significant factors supporting more obesity and contrary, as negative factors of obesity treatment. Among them there was bad environment influence, i.e. obesity in the family, such as parents and siblings and lack of activity. The
positive factors on obesity were parents‟ education
level related to occupation and middle-class to high-class socio economic status.
REFERENCES
1. Polnay L, Hull D, editor. Eating well. School-age child. Community paediatrics. Tokyo: Churchill Livingstone; 1993. 2. Fong H. Fastfood: a matter of balance. In: Samsudin, Nasar SS, Sjarif DR, editors. Masalah gizi ganda dan tumbuh kembang anak. Jakarta; Bina Rupa Aksara 1995: 114- 8.
3. Nelson WE, Behrman RE, Kliegman RM, Arvin AM, editors. Early school years. Textbook of Pediatrics. Tokyo: WB Saunders Co; 1996.
4. Weaver KA, Piatek A. Childhood obesity. In: Samour PQ, Helm KK, Lang CE, editors. Handbook of Pediatric Nutrition. 2nd ed. Maryland: Aspen Publishers Inc; 1999. p. 173-89.
therapy. 2 nd ed. New York: Raven Press Ltd; 1993. p. 301-11.
6. Alemzadeh R, Lifshitz F. Childhood obesity. In: Lifhitz F, editor. Pediatric endocrinology. New York: Marcel Deccer, Inc; 1996. h. 753-74.
7. Samsudin, Soedibjo S. Penilaian keadaan gizi dan pertumbuhan: cara, kegunaan, dan keterbatasan. In: Samsudin, Nasar SS, Sjarif DR, editors. Masalah gizi ganda dan tumbuh kembang anak. Proceedings of the PKB IKA XXXV. Jakarta; 1995 .p. 49-58.
8. Rimm AA, Hartz AJ, Fischer ME. A weight shape index for assesing risk of disease. J C Clin Epidemiol 1988; 41 (5) :458-65.
9. Berkowitz RI. Obesity in childhood and adolescence. In: Walker WA, Watkins JB, editors. Nutrion in Pediatrics. Basic science and clinical applications. London: BC Decker inc; 1997. p. 716-23.
10. Harsha DW, Bray GA. Body composition and childhood obesity. Endocr Metab Clin 1996; 25:871-85.
11. Rosner B, Prineas R, Loggie J, Daniels SR. Percentiles for body mass index in U.S. children 5 to 17 years of age. J Pediatr 1998; 132:211-22.
12. CDC. Body mass index-for-age. BMI is used differently with children than it is with adults. CDC home/search/health topics A-Z 2 2001; Mar 16:1-6.
13. Karlberg J, He Q. Prevalence and definition of childhood obesity. JPOG 1999; 7:21-3.
14. Yap MA, Tan WL. Factors associated with obesity in primary-school children in Singapore. Asia Pacific J Clin Nutr 1994; 3:65-8.
15. Satoto, Karjati S, Darmojo B, Tjokroprawiro A, Kodyat BA. Kegemukan, obesitas dan penyakit degeneratif: epidemiologi dan strategi penanggulangan. Widyakarya
Nasional Pangan dan Gizi VI. Serpong 17-20 Februari 1998: 787- 808.
16. Gortmaker SL, Must A, Sobol AM, Peterson K. Television viewing as a cause of increasing obesity among children in the United States, 1986-1990. Arch Pediatr Adolesc Med 1996; 150:356-62.
17. Whitaker RC, Wright JA, Pepe MS, Siedel KD, Dietz WH. Predicting obesity in young adulthood from childhood and parental obesity. N Engl J Med 1997; 337:869-73.
18. Vanitallia TB. Predicting obesity in children. Nutrition Reviews 1998; 56: 154-5.
19. Dietz WH Critical periods in childhood for the development of obesity. Am J Clin Nutr 1994; 59: 955-9. 20. Latief A, Tumbelaka AR, Chair I, et all. Beberapa cara
pengukuran. In: Matondang CS, Wahidiyat I, Sastroasmoro S, editors. Diagnosis fisis pada anak. 2 nd ed . Jakarta. PT Sagung Seto 2000. p. 173-82.
21. Kodyat B, Minarto, Raoef R, Sianturi G, Iryanis. Status konsumsi gizi di Indonesia: Analisis data survei konsumsi gizi tahun 1995. Gizi Indon 1996. p. 40-50.
22. Reilly JJ, Dorosty AR. Epidemic of obesity in UK children. Lancet 1999;354:1874-5.
23. Maynard LM, Wisemandle W, Roche AF, et al. Childhood Body composition in relation to body mass index. Pediatrics 2001;107:344-50.
24. Hernandez, Gortmaker SL, Colditz GA, Peterson KE, Laird NM, Cabrera SP. Association of obesity with physical activity, television programs and other forms of video viewing among children in Mexico city. Int Journal of obesity 1999; 23:845-54.