611
SUPPLY CHAIN RISK MITIGATION USING SUPPLY CHAIN RISK MANAGEMENT (SCRM) APPROACH
Didik Achmadi1, Trisita Novianti2, Fitri Agustina3
1,2,3 Department of Industrial Engineering, University of Trunojoyo Madura Jl. Raya Telang, Po-Box 2 Kamal, Bangkalan 69162
Email: [email protected]
Abstract
Supply chain is an important factor in domestic and international trades, which determines the extent of the efficiency and effectiveness of the order, the production process until distribution of goods from production centers or import to the consumer level. PT. Barata Indonesia (Persero) uses Make To Order production strategies that has experienced problems in the supply of raw materials, especially non- acceptance by the target date. This research uses Supply Chain Risk Management (SCRM) approach, which identifies the impact of the risk event and probability of risk agents on the risk of supply, operational and demand. For identifying the risks, House of Risk (HOR) was used, which consists of two phases. The results of the first phase of risk assessment: there were 23 risk events and 17 risk agents covering 4 supply risk, 16 operational risk and 3 demand risk. From these results, the sequence of aggregate risk potential (ARP) is obtained, from the largest to the smallest. In second phase, the selected risk agents were correlated with the proposed of mitigation strategies, there were 9 supply chain risk mitigation strategies that were assessed level of relationship both of them, so mitigation strategy were selected.
Key word: SCRM, HOR, ARP, risk mitigation
1. INTRODUCTION
Supply Chain is the lifeblood of international and domestic trades, which determines the extent of the efficiency and effectiveness of the booking value, the production process to distribution of goods from centers of production or import to the consumer level. Supply chain that is effective and efficient allows the amount of procurement of goods, time, place, and the right quality and lowest cost.
PT. Barata Indonesia (Persero) is a company that uses Make To Order production strategies that has experienced problems in supply of raw materials, especially non- acceptance by the target date. The delay is caused by several factors, i.e. material stockout, payment systems and inappropriate specification orders. In addition, the production process also encounters some problems such as labor does not implement Standard Operational Procedure (SOP) and equipment (machine) that are old and have an impact on the next production process.
The result of deviations in arrival of raw materials will have an impact on the next production processes. It is certainly very detrimental to the company in terms of time and cost. Supply chain risk management is essential to be applied in any given company that does not rule out the possibility of risk event in the course of supply chain companies. The application of SCRM system needs team work in every line. In the process of handling disruption or risk, it is necessary to determine the priority of risks to be handled by varying amount of risk. Manuj and Mentzer (2008) in Global Supply Chain Risk Management explained that the only way to achive maximum profits in the supply chain is byseeking a balance between productivity (efficiency) and profit (effectiveness).
2. METHODS
This stage is divided into several steps which consist of field observations, formulation of the problem, determination of research and literatures. In this research methods the framework of previous studies is used. The data collected in this research include the form of supply chain activities, production processes, equipment or machine, materials used, type of work, historical data on the risks that have occurred and all data related to the research. Several stages of collection and processing data are as follows:
1. First phase; Risk Identification is to identify the symptoms of risk events. This stage is the
process of identifying risk events based on two things, namely risk event and risk agent.
2. Two phase; Risk Assessment is to measure the impact that would cause risk. Before processing
risk, the result of risk identification process requires validation of a questionnaire or risk assessment form.
3. Third Phase; Selecting the appropriate risk management by conducting risk analysis then
performing a risk priority which shows the order of handling the risk.
4. Fourth stage; Eliminate risk with mitigation strategies and monitor the existing objects.
3. RESULTS AND DISCUSSION
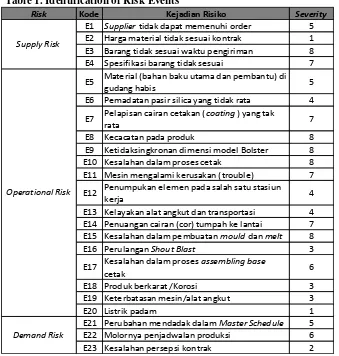
In this stage, the results that are obtained from this research are explained. The result of identification of risk events with degree of impact (severity) can be seen in Table 1 .
Table 1. Identification of Risk Events
Risk Kode Kejadian Risiko Severity
E1 Supplier tidak dapat memenuhi order 5 E2 Harga material tidak sesuai kontrak 1 E3 Barang tidak sesuai waktu pengiriman 8 E4 Spesifikasi barang tidak sesuai 7
E5 Material (bahan baku utama dan pembantu) di
gudang habis 5
E6 Pemadatan pasir silica yang tidak rata 4
E7 Pelapisan cairan cetakan (coating) yang tak
rata 7
E8 Kecacatan pada produk 8
E9 Ketidaksingkronan dimensi model Bolster 8
E10 Kesalahan dalam proses cetak 8
E11 Mesin mengalami kerusakan (trouble) 7
E12 Penumpukan elemen pada salah satu stasiun
kerja 4
E13 Kelayakan alat angkut dan transportasi 4 E14 Penuangan cairan (cor) tumpah ke lantai 7 E15 Kesalahan dalam pembuatan mould dan melt 8
E16 Perulangan Shout Blast 3
E17 Kesalahan dalam proses assembling base
cetak 6
E18 Produk berkarat /Korosi 3
E19 Keterbatasan mesin/alat angkut 3
E20 Listrik padam 1
E21 Perubahan mendadak dalam Master Schedule 5
E22 Molornya penjadwalan produksi 6
E23 Kesalahan persepsi kontrak 2
Supply Risk
Demand Risk Operational Risk
613
Table 2. Identification of Risk Agents
Kode Agen Risiko (Risk Agent) Occurance
A1 Kelangkaan Material/ Bahan Baku 7
A2 Usia Peralatan/Mesin 5
A3 Keterlambatan Barang 8
A4 Pekerja/ karyawan banyak yang kurang
berkompeten 3
A5 Kurangnya Koordinasi setiap divisi stasiun 6
A6 Pasokan listrik terhenti 4
A7 Kesalahan Prosedur 5
A8 Gangguan alam/ bencana alam, kebakaran 2
A9 Kurangnya perawatan mesin dan peralatan lain 3
A10 Perubahan rencana produksi 6
A11 Alat angkut/ transporter/ crane rusak 3
A12 Kualitas barang dari supplier tidak sesuai dengan
standar 4
A13 Referensi harga material tidak akurat 5
A14 Kesalahan dalam memilih Supplier 2
A15 Verifikasi permintaan barang kurang tepat 4
A16 Permintaan yang mendadak 3
A17 Kelemahan dalam nota kesepakatan dengan
supplier 3
3.1 First Phase of House of Risk
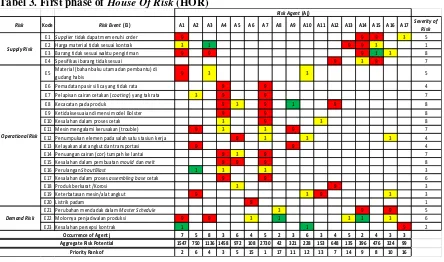
Identification results of severity (S) from risk event and occurance (O) of risk agent would be the input of the first phase of house of risk (HOR). At this phase it will be found the correlations between risk events and risk agents, thus the value of aggeragate risk potential (ARP) is obtained. The calculation of the first phase of HOR can be seen in Table 3.
Tabel 3. First phase of House Of Risk (HOR)
Risk Kode Risk Event (Ei) A1 A2 A3 A4 A5 A6 A7 A8 A9 A10 A11 A12 A13 A14 A15 A16 A17 Severity of Risk
E1 Supplier tidak dapat memenuhi order 9 9 9 3 5
E2 Harga material tidak sesuai kontrak 3 1 9 9 3 1
E3 Barang tidak sesuai waktu pengiriman 9 9 9 1 3 8
E4 Spesifikasi barang tidak sesuai 9 3 9 7
E5 Material (bahan baku utama dan pembantu) di
gudang habis 9 3 3 5
E6 Pemadatan pasir silica yang tidak rata 9 9 4
E7 Pelapisan cairan cetakan (coating) yang tak rata 3 9 9 7
E8 Kecacatan pada produk 9 3 9 1 9 8
E9 Ketidaksesuaian dimensi model Bolster 9 9 8
E10 Kesalahan dalam proses cetak 3 9 3 8
E11 Mesin mengalami kerusakan (trouble) 9 3 3 9 7
E12 Penumpukan elemen pada salah satu stasiun kerja 9 3 3 3 4
E13 Kelayakan alat angkut dan transportasi 9 9 4
E14 Penuangan cairan (cor) tumpah ke lantai 9 3 9 7 E15 Kesalahan dalam pembuatan mould dan melt 9 9 9 8
E16 Perulangan Shout Blast 1 3 3 3
E17 Kesalahan dalam proses assembling base cetak 9 9 6
E18 Produk berkarat /Korosi 3 9 3
E19 Keterbatasan mesin/alat angkut 9 3 9 3 3
E20 Listrik padam 9 1
E21 Perubahan mendadak dalam Master Schedule 3 9 9 5
E22 Molornya penjadwalan produksi 9 9 3 1 3 1 3 6
E23 Kesalahan persepsi kontrak 1 1 9 2
7 5 8 3 6 4 5 2 3 6 3 4 5 2 4 3 3
1547 750 1136 1458 972 108 2730 42 321 228 153 648 135 396 476 324 99 2 6 4 3 5 15 1 17 11 12 13 7 14 9 8 10 16
Risk Agent (Aj)
Priority Rank of Supply Risk
Operational Risk
Demand Risk
Occurrence of Agent j Aggregate Risk Potential
The following stages of solution of the first phase of the house of risk are:
1. Identify risks that may occur Ei (risk events) on each process. It is conducted by mapping risk
into supply risk, operational risk and demand risk.
2. Give assessment score with a scale of 1 to 10 to the severity Si (severity) as a result of risk
3. Identify the risk agents and give an assessment on the likelihood of the occurrence. Aj (risk agents) indicates risk agents and Oj (occurrence) demonstrates the possibility.
4. Find the matrix relationship (correlation) between each of risk agents and each risk. Rij
(relationship) {0,1,3,9} with a value of 0 indicates no correlation and a value of 1, 3 and 9 shows a low correlation, moderate and high, respectively.
5. Calculate the Aggregate Risk Potential Of Agent J (ARPj) which is the result of probability of
agent j.
6. Create priority of risk agents based on the potential risk with greater value.
After employing the first phase of house of risk (HOR), the results can be seen in Figure 1.
Aggregate Risk Potential (ARP) 2730154714581136972750648476396324321228537 Percent 24 13 13 10 8 7 6 4 3 3 3 2 5 Cum % 24 37 50 60 68 75 80 84 88 91 93 95100 Risk Agent Othe r A10 A9 A16 A14 A15 A12 A2 A5 A3 A4 A1 A7 12000 10000 8000 6000 4000 2000 0 100 80 60 40 20 0 A gg re ga te R is k Po te nt ia l ( A RP ) Pe rc en t
Pareto Chart of Risk Agent
Figure 1. Pareto Diagram of selected risk agents
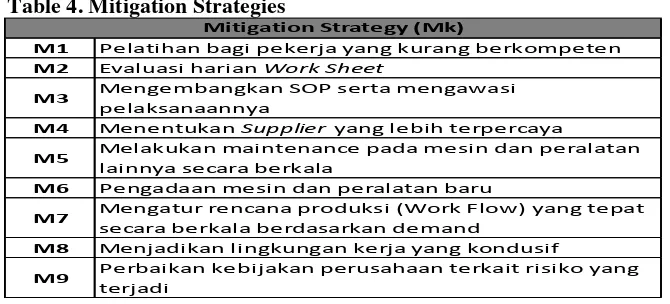
Based on the selected risk agents, then the strategies that are able to mitigate the risk sources according to the ability of the company are proposed. The selected risk agents are risk factors with highest value of aggregate risk potential (ARP). The selected risk agents will correlate with mitigation strategies that are needed. In linking risk agents with risk mitigation actions the same procedure as in the first phase of identification is used. The scale of correlation 9, 3 and 1 indicates strong correlation, medium correlation and weak correlation, respectively. The proposed strategies for risk mitigation can be seen in Table 4.
Table 4. Mitigation Strategies
M1 Pelatihan bagi pekerja yang kurang berkompeten
M2 Evaluasi harian Work Sheet
M3 Mengembangkan SOP serta mengawasi
pelaksanaannya
M4 Menentukan Supplier yang lebih terpercaya
M5 Melakukan maintenance pada mesin dan peralatan
lainnya secara berkala
M6 Pengadaan mesin dan peralatan baru
M7 Mengatur rencana produksi (Work Flow) yang tepat
secara berkala berdasarkan demand
M8 Menjadikan lingkungan kerja yang kondusif
M9 Perbaikan kebijakan perusahaan terkait risiko yang
terjadi
Mitigation Strategy (Mk)
615
the difficulty level of the assessed company. Therefore, grading scale levels of difficulty in the implementation of the proposal using a Likert scale can be used as a measure.
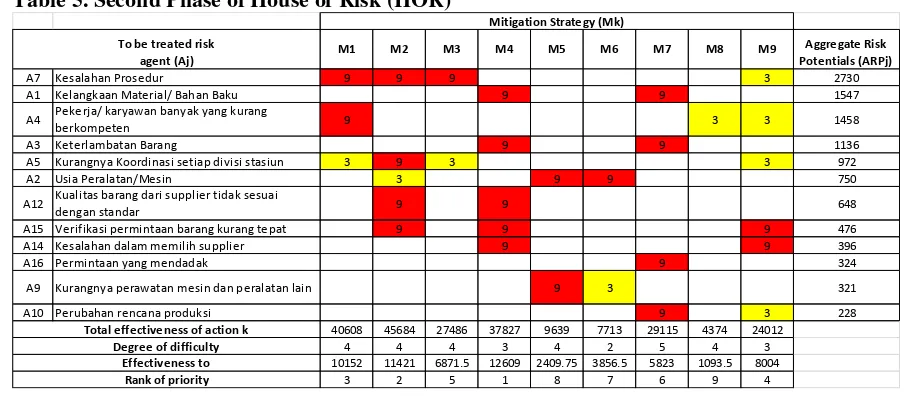
3.2 Second Phase of House of Risk (HOR)
The selected risk agents are the highest value of the aggregate risk potential (ARP). The highest aggregate score will be the input of the second phase of house of risk (HOR) namely the treatment phaseThe second phase of House of risk (HOR) can be seen in Table 5.
Table 5. Second Phase of House of Risk (HOR)
M1 M2 M3 M4 M5 M6 M7 M8 M9 Aggregate Risk Potentials (ARPj)
A7 Kesalahan Prosedur 9 9 9 3 2730
A1 Kelangkaan Material/ Bahan Baku 9 9 1547
A4 Pekerja/ karyawan banyak yang kurang
berkompeten 9 3 3 1458
A3 Keterlambatan Barang 9 9 1136
A5 Kurangnya Koordinasi setiap divisi stasiun 3 9 3 3 972
A2 Usia Peralatan/Mesin 3 9 9 750
A12 Kualitas barang dari supplier tidak sesuai
dengan standar 9 9 648
A15 Verifikasi permintaan barang kurang tepat 9 9 9 476
A14 Kesalahan dalam memilih supplier 9 9 396
A16 Permintaan yang mendadak 9 324
A9 Kurangnya perawatan mesin dan peralatan lain 9 3 321
A10 Perubahan rencana produksi 9 3 228
40608 45684 27486 37827 9639 7713 29115 4374 24012
4 4 4 3 4 2 5 4 3
10152 11421 6871.5 12609 2409.75 3856.5 5823 1093.5 8004
3 2 5 1 8 7 6 9 4
Mitigation Strategy (Mk)
Degree of difficulty Effectiveness to
Rank of priority Total effectiveness of action k
To be treated risk agent (Aj)
The stages of selection in the treatment phase of House of Risk (HOR) are:
1. Sort risk agents with the highest aggregate score using pareto diagram (ARPj) which will be
followed up on HOR2.
2. Identify any possible strategies to prevent the emergence of risk (Mitigation Strategy Mk).
3. Determine the correlation between preventive action and each of risk agents (Ejk). Ejk
{0,1,3,9} with a value of 0 indicates no correlation and value of 1,3 and 9 show low, medium and high correlations. (Ejk) also demonstrates the effectiveness of mitigation actions to reduce the likelihood of risk agents.
4. Calculate the Total Effectiveness (TEK) of each action using the formula:
5. Give assessment of the degree of difficulty in performing mitigation actions (Difficulty Dk)
using a Likert scale or other scales that describe funds or other resources required for mitigation actions.
6. Calculate the ratio of Total Effectiveness (TEK) with Difficulty (Difficulty Dk) using the
formula:
7. Determine the priority rating of each action (Rk), the first rank shows action with highest ETD.
4. CONCLUSION
Based on brainstorming process, forum group discussion (FGD), observation and questionnaires, the results of this research are; from supply chain risk identification based on three categories namely supply risk, operational risk and demand risk it is found that there are 23 risk events and 17 risk agents that covering 4 supply risk, 16 operational risk and 3 demand risk. From the first phase, it is revealed that several risk events can be caused by a single agency.
Based on the proposals that are processed in the second phase of house of risk, it can be stated that company must implement risk avoidance to mitigate the potential risks. Mitigation strategies proposed in this study are 9, they are conducting training for workers who are less competent, preparing work sheets, developing standard operational procedure (SOP) as well as overseeing in implementation, developing reliable suppliers, maintaining the machines, improving the procurement of machinery, organizing the work flow, creating the work environments that are conducive and comfortable and improving the company policies.
5. RECOMMENDATION
Some suggestions that can be considered in this study for next research is to calculate the probability of each risk events and agents to reduce the supply chain risk in company. Risk assessment can be developed according to the needs and ability of company in reducing the supply chain risk.
REFERENCES
Aflakha, N., Suparno. (2010). Analisis Dan Mitigasi Risiko Rantai Supply Pada Perusahaan Jasa
Penyedia Layanan Data Dan Internet (Studi Kasus : Produk Speedy Pada Pt Telkom Dcs
Timur). Tugas Akhir. Institut Teknologi Sepuluh Nopember (ITS) Surabaya
Alijoyo, A. (2006). Enterprise Risk Management. Jakarta : PT. Ray Indonesia.
Anggraini, M. (2006). Analisis dan Evaluasi Risiko Supply Chain di Lamp Component Factory PT.
Philips Lighting Surabaya.Tugas Akhir , Institut Teknologi SepuluhNopember, Surabaya.
Anonim1. (2004). Risk Management AS/NZS 4360:1999. Strathfield NSW: Standards Association
of Australia.
Badariah, N, Surjasa, D, Trinugraha, Y. (2011). Analisa Supply Chain Risk Management
Berdasarkan Metode Failure Mode And Effect Analysis (FMEA) Pada PT. Jakarta
Pertamina Unit Produksi Pelumas Jakarta (UPPJ). Universitas Trisakti.
Devi, S.S. (2010). Analisis Risiko Portofolio Dengan Metode Varians Kovarians (Studi Kasus:
Harga penutupan saham harian PT Astra International dan PT Indosat Bulan Juli –
Desember 2009). Skripsi. Jurusan Pendidikan Matematika Fakultas Matematika Dan Ilmu
Pengetahuan Alam. Universitas Negeri Yogyakarta
Fendi, A, Yuliawati, E. (2012). Analisis Strategi Mitigasi Risiko Pada Supply Chain Pt. Pal
Indonesia Prosiding Seminar Nasional Aplikasi Sains & Teknologi (SNAST) Periode III.
Yogyakarta : Institut Teknologi Adhi Tama Surabaya.
Gaspersz, V. (2012). Production and Inventory Management. Bogor: Vinchristo Publication.
Geraldin, L, Pujawan, I.N, Dewi, D. (2007). Manajemen Risiko dan Aksi Mitigasi untuk
Menciptakan Rantai Pasok yang Robust. Jurnal Teknologi Dan Rekayasa Teknik Sipil
“Torsi” / Maret 2007 / 53
Hidayati, L.N. (2012). Mengukur Risiko Perbankan Dengan Var (Value At Risk). Jurnal Ilmu
Manajemen.
Manuj, Mentzer (2008). Global Supply Chain Risk Management. Jurnal Bisnis Logistik, Volume
29. No. 1.
Paramasivan, C., Subramanian, T. (2009). Financial Management. New Age International (P)
Limited, Publisher
Purwandono, Dewi, K. (2010). Aplikasi Model House Of Risk (HOR) Untuk Mitigasi Risiko
Proyek Pembangunan Jalan Tol Gempol-Pasuruan, Laporan Thesis, Jurusan Teknik Industri ITS.
617
Sari, D.P, Purwanggono, B, Umiyatun, S. (2010). Pemenuhan Kualitas Menggunakan Pendekatan
Quality Risk Management (Studi Kasus : PT. Asrindo Indty Jaya). Jurnal Ekonomi Bisnis
No. 2, Volume 15. Universitas Diponegoro.
Suharjo. (2010). Analisa Perencanaan Dan Manajemen Risiko Pada Proyek Pembangunan Bts