49
BAB V
PENUTUP
5.1
Kesimpulan
Penelitian ini menguji secara empiris pengaruh struktur kepemilikan
institusional dan ukuran perusahaan terhadap manajemen laba efisien atau
oportunistik.
Beberapa hal yang dapat disimpulkan dari hasil penelitian ini adalah:
1.
Hasil dari pengujian Ha1 diterima dan pengaruh positif hal ini menunjukkan
bahwa manajemen laba berpengaruh positif terhadap arus kas operasi operasi
satu tahun ke depan. Dengan kata lain, manajemen laba akan meningkatkan
kualitas informasi sehingga semakin bermanfaat bagi para pengguna dan
memberikan bukti bahwa tipe manajemen laba pada perusahaan manufaktur
yang terdaftar dalam Bursa Efek Indonesia periode 2009-2011 adalah
manajemen laba efisien.
50
3.
Hasil dari pengujian Ha3 diterima dan pengaruh positif menunjukkan bahwa
ukuran perusahaan memperkuat pengaruh positif manjemen laba terhadap
arus kas operasi satu tahun ke depan. Dengan kata lain, semakin besar ukuran
perusahaan berpengaruh terhadap tindakan manajer dalam melakukan
manajemen laba sehingga tipe manajemen laba semakin efisien pada
perusahaan manufaktur yang terdaftar dalam Bursa Efek Indonesia periode
2009-2011.
5.2 Keterbatasan
Penelitian
DAFTAR PUSTAKA
Ardi Murdoko Sudarmadji dan Lana Sularto, 2007. “Pengaruh Ukuran
Perusahaan, Profitabilitas, leverage, dan Tipe Kepemilikan Perusahaan
Terhadap Luas Voluntary Disclosure Laporan Keuangan Tahunan”,
Proceeding PESAT, Volume 2.
Brigham, Eugene F and Joel F.Houston, 2006. Dasar-Dasar Manajemen
Keuangan, alih bahasa Ali Akbar Yulianto, Buku satu,Edisi sepuluh, PT.
Salemba Empat, Jakarta.
Chin, C.L., Yu J.C, dan Tsun J.H. 2009. International Diversification, Ownership
Structure, Legal Origin, and Earnings Management: Evidence from Taiwan.
Journal of Accounting, Auditing and Finance (Spring). 24 (2): 233-362.
Ernamawati, Laily. (2009). ”Pengaruh Kebijakan Dividen, Kebijakan Utang dan
Kepemilikan Manajerial Terhadap Agency Costs Pada Perusahaan
Manufaktur Yang Terdaftar di Bursa Efek Indonesia Periode
2004-2008”.Skripsi.Fakultas Ekonomi Universitas Negeri Yogyakarta.
Ghozali, Imam. 2005. Aplikasi Analisis Multivariate dengan program SPSS,
Badan Penerbit Universitas Diponegoro, Semarang.
Gujarati, D. 2003. Basic Econometrics. McGraw-Hill International Edition. 4th
edition.
Healy, P.M. 1985. The Effect of Bonus Schemes on Accounting Decisions.
Journal of Accounting and Economics Vol. 7:85-107
Healy, P.M dan James M. Wahlen .,1999. A Review of the Earnings Management
Literature and Its Implications for Standard Setting. Accounting Horizons:
December 1999, Vol. 13, No. 4, pp. 365-383.
Holthausen, R., D., Larcker, dan Sloan. (1995). “Anual Bonus Schemes and
Manipulation of Earnings: Additional Evidence on Bonus Plans and Income
Management”. Journal of Accounting and Economics, 29—74.
Ikatan Akuntan Indonesia. (2012).
Kerangka Dasar Penyusunan dan Penyajian
Laporan Keuangan :
Tujuan Penyajian Laporan Keuangan
Ikatan Akuntan Indonesia. (2012).
Kerangka Dasar Penyusunan dan Penyajian
Iturriaga dan Sanz. 2001. Ownership Structure, Corporate Value and Firm
Investment: A Simultaneous Equations Analysis of Spanish Companies.
Journal of Management and Governance Vol. 5 No. 2 pp. 179-204.
Jensen dan Meckling. 1976. The Agency Theory of The Firm: Managerial
Behavior, Agency Cost and Owneship Structure. Journal of Financial
Economics 3, pp 305-360.
Jones, C.P, Utama S., Frensidy B., Ekaputra I.A., Budiman R.U. 2009.
Investment: Analysis and Management, An Indonesia Adoptation. Jakarta.
Penerbit Salemba Empat dan John Willey.
Kasznik, R. 1999. On the Association Between Voluntary Disclosure and
Earnings Management. Journal of Accounting Research 37 (1): 57-81.
Kim, Y., Liu, C., & Rhee, S. G. (2003). The Effect of Firm Size on Earnings
Management. Journal College of Business Administration University of
Hawai’I Vol. 6 pp. 1-30.
Michaelson, S. E., James, J. W., & Charles, W. 1995. A Market Based Analysis of
Income Smoothing. Journal of Business Finance and Accounting 8(4):
1179
−
1195.
Moh’d, M.A., Perry, L.G, dan James R., 1998. The Impact of Owneship Structure
on Corporate Debt Policy: A Time Series Cross-Sectional Analysis, Financial
Review 33, pp. 85-99
R. Scott, William.2003. Financial Accounting Theory Sixth Edition. Toronto,
Ontario: Pearson Canada Inc.
Rezaei, F. 2012. Efficient or opportunistic earnings management with regards to
the role of firm size and corporate governance practices. Interdisciplinary
Journal of Contemporary Research Business January Vol. 3 No. 9
pp.1312-1322.
Sanjaya. 2010. Entrenchment and Alignment Effect on Earnings Management.
The Indonesian Journal of Accounting Research, 13(2): 247-264.
Scott, William R. (2000). Financial accounting Theory. Second edition. Canada:
Prentice Hall
Scott, W.R. 2003. Financial Accounting Theory 3th Edition. Prentice Hall Inc. A
Simon &Schuter Company, Upper Saddle River. New Jersey, USA.
Simanjuntak, R.S., 2011. Perbedaan Profitabilitas Wajib Pajak Perdagangan
Dengan dan Tanpa Undang-Undang No. 36 Tahun 2008 Tentang Pajak
Penghasilan. Universitas Udayana. Denpasar: Thesis S2
Siregar, Baldric. 2006. Determinan Risiko Ekspropriasi. Jurnal Akuntansi
Manajemen, 18 (3): 269-282.
Siregar, S.V dan Utama, S. 2008. Type of Earnings Management and The Effect
of Owneship Structure, firm size, and corporate-governance practices:
Evidence from Indonesia. The Internasional Journal of Accounting 43 pp
1-27.
Sulistiawan D., Yeni J., dan Liza A., 2011. Creative Accounting. Jakarta :Salemba
Empat
Subramanyam, K.R. 1996. The Pricing of Discretionary Accruals. Journal of
Accounting and Economics 22 pp. 249-281.
Wang, L., 2009. Ownership, Size, and The Formal Structure of Organizations:
Evidence From US Public and Private Firms, 1992–2002. Industrial and
Corporate Change, Vol. 18, No. 4, pp. 595–636.
Watt, R.L., dan Zimmerman, J.L., 1986. Positive Accounting Theory.
Prentice-Hall Inc., Englewood Cliff, New Jersey, USA.
Zimmerman, J.L. dan Andrew A. Criestie. 1994. “Efficient and Opportunistic
Choices of Accounting Procedures: Corporate Control Contests”. The
Accounting Review Vol. 69. No. 4 (October): 539—566.
Lampiran 1
Model Manajemen Laba
1.
Uji Normalitas
(Sebelum Trimming)
One-Sample Kolmogorov-Smirnov Test
Accrual
Drev_Drec
PPE
DCFO
N
117
117
117
117
Normal Parameters
aMean
-2.27E10
4.11E11
2.20E12
1.07E10
Std. Deviation
6.261E11
9.006E11 3.719E12
5.716E11
Most Extreme Differences
Absolute
.324
.266
.314
.301
Positive
.324
.250
.314
.301
Negative
-.277
-.266
-.284
-.268
Kolmogorov-Smirnov Z
3.504
2.880
3.393
3.258
Asymp. Sig. (2-tailed)
.000
.000
.000
.000
a. Test distribution is Normal.
(Sesudah
Trimming)
One-Sample Kolmogorov-Smirnov Test
Accrual
Drev_Drec
PPE
DCFO
N
79
79
79
79
Normal Parameters
aMean
-1.50E10
2.09E11
8.98E11
2.36E10
Std. Deviation
9.098E10
2.585E11 5.441E11
1.050E11
Most Extreme Differences
Absolute
.131
.143
.142
.149
Positive
.121
.143
.142
.149
Negative
-.131
-.123
-.122
-.147
Kolmogorov-Smirnov Z
1.163
1.271
1.264
1.322
Asymp. Sig. (2-tailed)
.133
.079
.082
.061
2. Uji Asumsi Klasik
Autokorelasi
Model Summary
bModel
R
R Square
Adjusted R
Square
Std. Error of the
Estimate
Durbin-Watson
1
.646
a.417
.394
7.084E10
1.986
a. Predictors: (Constant), DCFO, PPE, DRev_Drec
b. Dependent Variable: Accrual
Multikolinearitas
Coefficients
aModel
Unstandardized
Coefficients
Standardized
Coefficients
t
Sig.
Collinearity
Statistics
B
Std. Error
Beta
Tolerance
VIF
1
(Constant)
1.087E8 1.679E10
.006
.995
DRev_Drec
.067
.031
.190
2.144
.035
.993
1.007
PPE
-.019
.015
-.114
-1.288
.202
.996
1.004
DCFO
-.506
.077
-.584
-6.586
.000
.989
1.012
a. Dependent Variable:
Accrual
Heteroskedastisitas
Correlations
Unstandardized
Residual
DRev_Drec
PPE
DCFO
Unstandardized
Residual
Pearson
Correlation
1.000
.000
.000
.000
Sig.
(2-tailed)
1.000
1.000
1.000
N
79.000
79
79
79
DRev_Drec
Pearson
Correlation
.000
1.000
.007
-.084
Sig.
(2-tailed)
1.000
.948
.460
N
79
79.000
79
79
PPE
Pearson
Correlation
.000
.007
1.000
.065
Sig.
(2-tailed)
1.000
.948
.567
N
79
79
79.000
79
DCFO
Pearson
Correlation
.000
-.084
.065
1.000
Sig.
(2-tailed)
1.000
.460
.567
N
79
79
79
79.000
Lampiran 2
Model Hipotesis 1
1. Uji Normalitas
(Sebelum Trimming)
One-Sample Kolmogorov-Smirnov Test
Yit
DAC
N
79
79
Normal Parameters
aMean
9.41E10
-.0000022
Std. Deviation
1.568E11
6.94671125E10
Most Extreme Differences
Absolute
.209
.143
Positive
.209
.143
Negative
-.174
-.138
Kolmogorov-Smirnov Z
1.859
1.267
Asymp. Sig. (2-tailed)
.002
.081
a. Test distribution is Normal.
(Sesudah Trimming)
One-Sample Kolmogorov-Smirnov Test
Yit
DAC
N
59
59
Normal Parameters
aMean
4.72E10
-4.4683571E8
Std. Deviation
7.873E10
6.10181043E10
Most Extreme Differences
Absolute
.160
.161
Positive
.160
.161
Negative
-.115
-.136
Kolmogorov-Smirnov Z
1.325
1.338
Asymp. Sig. (2-tailed)
.060
.056
2. Statistik Deskriptif
Descriptive Statistics
N
Minimum
Maximum
Mean
Std. Deviation
Yit
59
-2.E11
2.E11
4.09E10
6.722E10
DAC
59 -1.60566E11 2.30447E11 9.6812091E9 6.07722004E10
Valid N (listwise)
59
3. Asumsi Klasik
Autokorelasi
Model Summary
bModel
R
R Square
Adjusted R
Square
Std. Error of the
Estimate
Durbin-Watson
1
.161
a.026
.010
6.892E10
1.722
a. Predictors: (Constant), Unstandardized Residual
b. Dependent Variable: Yit
Heteroskedastisitas
Correlations
Unstandardized
Residual
DAC
Spearman's rho Unstandardized
Residual
Correlation Coefficient
1.000
-.091
Sig. (2-tailed)
.
.470
N
59
59
DAC
Correlation Coefficient
-.091
1.000
Sig. (2-tailed)
.470
.
N
59
59
4. Hasil Regresi
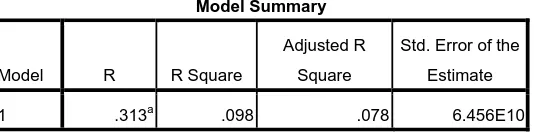
Koefisien Determinasi
Model Summary
Model
R
R Square
Adjusted R
Square
Std. Error of the
Estimate
1
.313
a.098
.078
6.456E10
[image:12.612.134.401.164.231.2]a. Predictors: (Constant), DAC
Tabel Uji F
ANOVA
bModel
Sum of Squares
df
Mean Square
F
Sig.
1
Regression
1.993E22
1
1.993E22
4.782
.034
aResidual
1.834E23
57
4.168E21
Total
2.033E23
58
a. Predictors: (Constant), DAC
b. Dependent Variable: Yit
Uji Regresi
Coefficients
aModel
Unstandardized
Coefficients
Standardized
Coefficients
t
Sig.
B
Std. Error
Beta
1
(Constant)
3.759E10
9.642E9
3.899
.000
DAC
.346
.158
.313
2.187
.034
a. Dependent Variable: Yit
Lampiran 3
Model Hipotesis 2 dan 3
1. Uji Normalitas
(Sesudah Trimming)
One-Sample Kolmogorov-Smirnov Test
Yit
DAC
LN_TAset
Dummi
_Inst
DAC_LnTAs
et
DAC_Dumm
iInst
N
59
59
59
59
59
59
Normal
Parameters
aMean
3.75E10
-1.0311667E9
27.4154
.44 -2.8723E11
-1.65E9
Std.
Deviation
5.346E10
3.15618380E10
.54719
.502 2.03817E12
2.274E10
Most
Extreme
Differences
Absolute
.213
.153
.096
.371
.097
.381
Positive
.213
.153
.096
.371
.058
.227
Negative
-.141
-.104
-.084
-.305
-.097
-.381
Kolmogorov-Smirnov Z
1.329
.958
.598
2.319
.607
2.379
Asymp. Sig. (2-tailed)
.059
.318
.867
.000
.854
.000
a. Test distribution is
Normal.
2. Statistik Deskriptif
Descriptive Statistics
N
Minimum
Maximum
Mean
Std. Deviation
Yit
59
-2.E10
3.E11
3.75E10
5.346E10
DAC
59
-7.29731E10
7.93619E10
-1.0311667
E9
3.15618380E10
Dummi_Inst
59
0
1
.44
.502
LN_TAset
59
26.43
28.35
27.4154
.54719
DAC_DummiInst
59
-7.E10 57202727395
-1.65E9
2.274E10
DAC_LnTAset
59
-6.16E12
3.70E12 -2.8723E11
2.03817E12
Valid N (listwise)
59
3. Asumsi Klasik
Autokorelasi
Model Summary
bModel
R
R Square
Adjusted R
Square
Std. Error of the
Estimate
Durbin-Watson
1
.619
a.384
.290
4.504E10
1.718
a. Predictors: (Constant), Transformasi, LN_TAset, Dummi_Inst, DAC_DUMMIINST,
Unstandardized Residual
Heteroskedastisitas
Correlations
DAC
Dummi_In
st
LN_TAset
DAC_LnT
Aset
DAC_Dumm
iInst
Unstandardized
Residual
DAC
Pearson
Correlation
1.000
-.078
.210
-.326
*.722
**.000
Sig.
(2-tailed)
.638
.200
.043
.000
1.000
N
59.000
59
59
59
59
59
Dummi_I
nst
Pearson
Correlation
-.078
1.000
.053
-.122
-.084
.000
Sig.
(2-tailed)
.638
.747
.461
.612
1.000
N
59
59.000
59
59
59
59
LN_TAse
t
Pearson
Correlation
.210
.053
1.000
-.020
-.069
.000
Sig.
(2-tailed)
.200
.747
.902
.675
1.000
N
59
59
59.000
59
59
59
DAC_Ln
TAset
Pearson
Correlation
-.326
*-.122
-.020
1.000
-.247
.000
Sig.
(2-tailed)
.043
.461
.902
.129
1.000
N
59
59
59
59.000
59
59
DAC_Du
mmiInst
Pearson
Correlation
.722
**-.084
-.069
-.247
1.000
.000
Sig.
(2-tailed)
.000
.612
.675
.129
1.000
N
59
59
59
59
59.000
59
Unstand
ardized
Residual
Pearson
Correlation
.000
.000
.000
.000
.000
1.000
Sig.
(2-tailed)
1.000
1.000
1.000
1.000
1.000
N
59
59
59
59
59
59.000
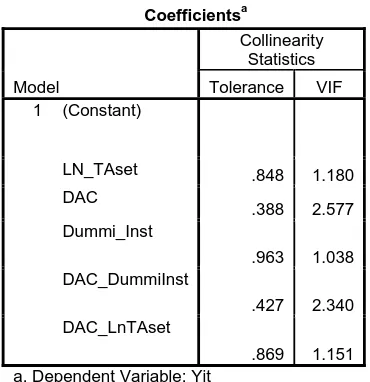
Multikolinearitas
Coefficients
aModel
Collinearity
Statistics
Tolerance
VIF
1
(Constant)
LN_TAset
.848
1.180
DAC
.388
2.577
Dummi_Inst
.963
1.038
DAC_DummiInst
.427
2.340
DAC_LnTAset
.869
1.151
a. Dependent Variable: Yit
4. Hasil Regresi
Koefisien Determinasi
Model Summary
bModel
R
R Square
Adjusted R
Square
Std. Error of the
Estimate
1
.619
a.384
.290
4.504E10
a. Predictors: (Constant), DAC_LnTAset, LN_TAset, Dummi_Inst,
DAC_DummiInst, DAC
[image:16.612.126.311.130.321.2]b. Dependent Variable: Yit
Tabel Uji F
ANOVA
bModel
Sum of Squares
df
Mean Square
F
Sig.
1
Regression
4.165E22
5
8.330E21
4.107
.005
aResidual
6.694E22
53
2.028E21
Total
1.086E23
58
Uji Regresi
Coefficients
aModel
Unstandardized Coefficients
Standardized
Coefficients
t
Sig.
B
Std. Error
Beta
1
(Constant)
-1.121E12
3.972E11
-2.822
.008
DAC
-.742
.372
-.438
-1.996
.154
Dummi_Inst
-1.289E10
1.482E10
-.121
-.870
.391
LN_TAset
4.260E10
1.450E10
.436
2.938
.006
DAC_DummiInst
1.567
.491
.667
3.188
.003
DAC_LnTAset
.008
.004
.309
2.104
.043
a. Dependent Variable: Yit
Lampiran 4
Daftar Perusahaan Sampel
No Kode
Nama
Perusahaan
Tahun
1 ADES Akasha Wira International Tbk.
2011
2 AISA Tiga Pilar Sejahtera Food Tbk.
2011
3 AKPI Argha Karya Prima Industry Tbk
2011
4 ALMI Alumindo Light Metal Industry
2011
5 APLI Asiaplast Industries Tbk.
2011
6 ARGO Argo Pantes Tbk
2011
7 ARNA Arwana Citramulia Tbk.
2011
8 BATA Sepatu Bata Tbk.
2011
9 BRNA Berlina Tbk.
2011
10 CEKA Wilmar Cahaya Indonesia Tbk.
2011
11 CTBN Citra Tubindo Tbk.
2011
12 DAVO Davomas Abadi Tbk
2011
13 ESTI Ever Shine Tex Tbk.
2011
14 FAST Fast Food Indonesia Tbk.
2011
15 GDST Gunawan Dianjaya Steel Tbk
2011
16 GGRM Gudang Garam Tbk.
2011
17 GJTL Gajah Tunggal Tbk.
2011
18 HDTX Panasia Indo Resources Tbk.
2011
19 IKAI Intikeramik Alamasri Industri
2011
20 INDF Indofood Sukses Makmur Tbk.
2011
21 INDR Indo-Rama Synthetics Tbk.
2011
22 INDS Indospring Tbk.
2011
23 JECC Jembo Cable Company Tbk.
2011
24 KBLI KMI Wire & Cable Tbk.
2011
25 KBLM Kabelindo Murni Tbk.
2011
26 KBRI Kertas Basuki Rachmat Indonesia Tbk.
2011
27 KIAS Keramika Indonesia Assosiasi T
2011
28 LMPI Langgeng Makmur Industri Tbk.
2011
29 MASA Multistrada Arah Sarana Tbk.
2011
30 MLBI Multi Bintang Indonesia Tbk.
2011
31 PBRX Pan Brothers Tbk.
2011
32 RMBA Bentoel Internasional Investam
2011
33 SIPD Sierad Produce Tbk.
2011
34 SPMA Suparma Tbk.
2011
35 SRSN Indo Acidatama Tbk
2011
36 SULI SLJ Global Tbk.
2011
37 TRST Trias Sentosa Tbk.
2011
38 ULTJ Ultra Jaya Milk Industry & Tra
2011
40 ADES Akasha Wira International Tbk.
2010
41 AISA Tiga Pilar Sejahtera Food Tbk.
2010
42 AKPI Argha Karya Prima Industry Tbk
2010
43 ALMI Alumindo Light Metal Industry
2010
44 APLI Asiaplast Industries Tbk.
2010
45 ARGO Argo Pantes Tbk
2010
46 ARNA Arwana Citramulia Tbk.
2010
47 BATA Sepatu Bata Tbk.
2010
48 BRNA Berlina Tbk.
2010
49 CEKA Wilmar Cahaya Indonesia Tbk.
2010
50 CTBN Citra Tubindo Tbk.
2010
51 DAVO Davomas Abadi Tbk
2010
52 ESTI Ever Shine Tex Tbk.
2010
53 FAST Fast Food Indonesia Tbk.
2010
54 GDST Gunawan Dianjaya Steel Tbk
2010
55 GGRM Gudang Garam Tbk.
2010
56 GJTL Gajah Tunggal Tbk.
2010
57 HDTX Panasia Indo Resources Tbk.
2010
58 IKAI Intikeramik Alamasri Industri
2010
59 INDF Indofood Sukses Makmur Tbk.
2010
60 INDR Indo-Rama Synthetics Tbk.
2010
61 INDS Indospring Tbk.
2010
62 JECC Jembo Cable Company Tbk.
2010
63 KBLI KMI Wire & Cable Tbk.
2010
64 KBLM Kabelindo Murni Tbk.
2010
65 KBRI Kertas Basuki Rachmat Indonesia Tbk.
2010
66 KIAS Keramika Indonesia Assosiasi T
2010
67 LMPI Langgeng Makmur Industri Tbk.
2010
68 MASA Multistrada Arah Sarana Tbk.
2010
69 MLBI Multi Bintang Indonesia Tbk.
2010
70 PBRX Pan Brothers Tbk.
2010
71 RMBA Bentoel Internasional Investam
2010
72 SIPD Sierad Produce Tbk.
2010
73 SPMA Suparma Tbk.
2010
74 SRSN Indo Acidatama Tbk
2010
75 SULI SLJ Global Tbk.
2010
76 TRST Trias Sentosa Tbk.
2010
77 ULTJ Ultra Jaya Milk Industry & Tra
2010
78 VOKS Voksel Electric Tbk.
2010
79 ADES Akasha Wira International Tbk.
2009
80 AISA Tiga Pilar Sejahtera Food Tbk.
2009
81 AKPI Argha Karya Prima Industry Tbk
2009
82 ALMI Alumindo Light Metal Industry
2009
84 ARGO Argo Pantes Tbk
2009
85 ARNA Arwana Citramulia Tbk.
2009
86 BATA Sepatu Bata Tbk.
2009
87 BRNA Berlina Tbk.
2009
88 CEKA Wilmar Cahaya Indonesia Tbk.
2009
89 CTBN Citra Tubindo Tbk.
2009
90 DAVO Davomas Abadi Tbk
2009
91 ESTI Ever Shine Tex Tbk.
2009
92 FAST Fast Food Indonesia Tbk.
2009
93 GDST Gunawan Dianjaya Steel Tbk
2009
94 GGRM Gudang Garam Tbk.
2009
95 GJTL Gajah Tunggal Tbk.
2009
96 HDTX Panasia Indo Resources Tbk.
2009
97 IKAI Intikeramik Alamasri Industri
2009
98 INDF Indofood Sukses Makmur Tbk.
2009
99 INDR Indo-Rama Synthetics Tbk.
2009
100 INDS Indospring Tbk.
2009
101 JECC Jembo Cable Company Tbk.
2009
102 KBLI KMI Wire & Cable Tbk.
2009
103 KBLM Kabelindo Murni Tbk.
2009
104 KBRI Kertas Basuki Rachmat Indonesia Tbk.
2009
105 KIAS Keramika Indonesia Assosiasi T
2009
106 LMPI Langgeng Makmur Industri Tbk.
2009
107 MASA Multistrada Arah Sarana Tbk.
2009
108 MLBI Multi Bintang Indonesia Tbk.
2009
109 PBRX Pan Brothers Tbk.
2009
110 RMBA Bentoel Internasional Investam
2009
111 SIPD Sierad Produce Tbk.
2009
112 SPMA Suparma Tbk.
2009
113 SRSN Indo Acidatama Tbk
2009
114 SULI SLJ Global Tbk.
2009
115 TRST Trias Sentosa Tbk.
2009
116 ULTJ Ultra Jaya Milk Industry & Tra
2009
No Kode Tahun Accrual Drev_Drec PPE DCFO DAC INST Dinst LNAst DAC*INST DAC*LNAset 1 ADES 2011 -31,360,000,000 56,529,000,000 253,163,000,000 86,976,000,000
2 AISA 2011 120,289,000,000 736,058,000,000 1,302,998,000,000 52,787,000,000 122,539,216,530 5.20 0 28.91 637,203,925,957 3,542,517,995,771 3 AKPI 2011 -82,102,762,000 316,358,406,000 1,902,957,252,000 138,676,077,000 3,076,783,109 44.70 1 28.07 137,532,204,984 86,376,149,448 4 ALMI 2011 -179,511,628,220 492,171,779,098 1,385,872,559,327 285,832,178,429 -41,433,805,296 81.04 1 28.25 -3,357,795,581,188 -1,170,637,212,281 5 APLI 2011 4,269,230,487 13,358,675,256 337,863,709,498 -13,216,627,401 3,010,292,853 26.66 1 26.54 80,254,407,474 79,882,659,753 6 ARGO 2011 -157,647,813,000 7,496,140,000 3,074,125,724,000 57,534,435,000
7 ARNA 2011 -47,903,192,388 89,314,720,913 856,774,878,568 28,361,209,886 -23,311,898,209
8 BATA 2011 -14,008,584,000 27,758,977,000 290,004,364,000 -35,710,479,000 -28,526,104,241 5.90 0 26.97 -168,304,015,022 -769,367,007,229 9 BRNA 2011 -52,974,168,000 109,378,126 646,964,250,000 36,390,388,672 -22,354,433,330 9.31 0 27.19 -208,119,774,302 -607,837,347,934 10 CEKA 2011 -29,927,807,233 474,006,186,230 309,168,177,200 332,933,085,646 112,707,201,481
11 CTBN 2011 152,643,997,218 -59,016,251,684 1,168,753,253,808 134,897,484,508 247,007,192,151 12 DAVO 2011 -243,497,805,506 -310,625,492,800 3,731,344,958,266 171,664,181,288
13 ESTI 2011 -11,422,658,188 94,939,415,463 905,238,234,096 13,853,039,602 6,371,981,846 13.61 0 27.35 86,722,672,924 174,281,226,400 14 FAST 2011 -445,074,138,000 371,145,734,000 483,748,988,000 187,450,790,000
15 GDST 2011 79,088,981,578 358,367,194,696 706,389,390,344 55,580,992,930 96,623,757,333 16 GGRM 2011 5,048,409,000,000 3,387,581,000,000 14,960,265,000,000 -2,962,905,000,000
17 GJTL 2011 379,806,000,000 1,675,998,000,000 8,586,646,000,000 -707,157,000,000
18 HDTX 2011 9,268,996,386 310,770,296,278 1,218,426,392,196 -16,697,004,690 3,145,920,949 45.15 1 27.64 142,038,330,843 86,967,427,049 19 IKAI 2011 -72,374,435,942 -2,981,815,394 103,175,490,253 13,154,936,320
20 INDF 2011 -77,318,000,000 5,945,864,000,000 20,905,762,000,000 -1,940,959,000,000 21 INDR 2011 -358,570,571,778 1,385,122,314,442 7,480,753,736,130 -107,361,971,206
22 INDS 2011 -933,498,023 146,970,092,639 544,714,110,213 113,978,742,230 57,202,727,395 87.46 1 27.76 5,002,950,537,968 1,588,050,652,933
Lampiran 5
23 JECC 2011 19,148,719,000 342,704,187,873 316,840,758,000 2,783,673,000 3,589,720,241 17.58 0 27.16 63,107,281,840 97,512,140,188 24 KBLI 2011 16,483,335,004 557,765,836,017 771,425,432,881 10,014,498,787 -1,126,863,098 71.72 1 27.71 -80,818,621,390 -31,226,773,169 25 KBLM 2011 -28,217,304,160 244,758,193,610 447,462,371,880 41,565,354,461 -15,117,401,417 17.86 0 27.19 -269,996,789,311 -411,032,170,285 26 KBRI 2011 10,299,471,461 43,221,691,826 712,776,410,365 -17,184,936,825 12,174,366,037 22.70 1 27.34 276,358,109,047 332,799,535,022 27 KIAS 2011 -59,520,506,801 40,983,641,825 1,845,619,062,018 2,423,321,620 -26,005,330,046 3.42 0 28.35 -88,938,228,757 -737,216,827,603 28 LMPI 2011 8,951,921,677 -60,060,412,143 486,230,464,729 -23,313,934,718 10,310,540,127 11.90 0 27.25 122,695,427,515 281,003,370,873 29 MASA 2011 47,356,330,214 688,142,000,000 4,338,121,379,964 -408,897,330,214
30 MLBI 2011 -164,373,000,000 25,357,000,000 1,122,424,000,000 351,699,000,000 33,210,062,418
31 PBRX 2011 30,730,099,475 562,235,443,632 605,973,912,445 38,394,860,717 24,036,850,692 7.60 0 28.05 182,680,065,262 674,148,617,797 32 RMBA 2011 162,779,000,000 1,075,105,000,000 2,635,107,000,000 -420,644,000,000
33 SIPD 2011 987,598,157 350,449,929,205 1,874,820,640,087 -2,377,705,811 11,957,740,893 15.77 0 28.60 188,573,573,887 342,020,172,071 34 SPMA 2011 -133,252,826,009 -12,166,540,731 1,911,236,966,011 83,344,334,742 -53,978,857,872 40.70 1 28.07 -2,196,939,515,397 -1,515,209,325,171 35 SRSN 2011 -5,725,990,000 13,034,805,000 262,696,113,000 21,923,742,000 9,392,609,835 20.94 1 26.61 196,681,249,942 249,962,222,436 36 SULI 2011 -339,180,351,225 137,106,282,194 2,025,362,969,119 108,071,040,296
37 TRST 2011 12,271,371,341 269,696,439,344 2,660,621,078,895 -3,436,405,942
38 ULTJ 2011 -302,636,887,949 139,994,248,388 1,750,720,242,279 140,078,859,114 -207,865,158,865
39 VOKS 2011 -27,393,290,376 619,972,969,376 486,643,270,944 23,092,707,616 -47,960,230,346 27.69 1 28.08 -1,328,018,778,288 -1,346,916,578,364 40 ADES 2010 61,407,000,000 8,748,000,000 226,513,000,000 -46,636,000,000
41 AISA 2010 173,076,000,000 1,027,738,000,000 930,286,000,000 -73,939,639,259 84,603,454,481 5.20 0 28.29 439,937,963,299 2,393,612,413,747 42 AKPI 2010 66,149,381,000 377,906,252,000 1,593,755,211,000 -211,232,763,000 -35,780,345,958
43 ALMI 2010 117,668,371,726 1,251,047,359,658 956,759,521,459 -259,915,739,207
44 APLI 2010 -6,210,358,985 142,650,140 330,532,023,690 -2,730,068,117 -1,418,164,072 13.33 0 26.54 -18,904,127,086 -37,634,172,750 45 ARGO 2010 133,384,288,000 86,552,305,000 2,306,701,059,000 46,068,921,000
46 ARNA 2010 -36,451,534,419 78,197,198,532 956,759,521,459 27,505,839,625 -9,647,210,932
50 CTBN 2010 -2,181,459,460 206,012,107,320 1,484,857,838,760 -69,042,000,200 -22,730,442,953
51 DAVO 2010 173,384,813,834 1,071,859,453,000 1,484,857,838,760 -192,597,700,320 32,461,802,944 37.47 1 28.68 1,216,343,756,320 931,032,583,247 52 ESTI 2010 -508,325,098 47,526,398,385 1,040,434,428,830 -30,095,240,395 781,857,380 13.61 0 27.27 10,641,078,938 21,321,551,821 53 FAST 2010 -93,975,455,000 441,280,103,000 426,665,640,000 -74,112,019,000 -152,950,101,315
54 GDST 2010 206,422,640,173 -40,729,934,484 661,972,929,700 17,407,056,824 230,447,241,283 55 GGRM 2010 1,273,684,000,000 4,594,963,000,000 13,314,355,000,000 -392,603,000,000
56 GJTL 2010 -180,356,000,000 1,098,863,000,000 7,680,751,000,000 -126,425,000,000
57 HDTX 2010 -23,522,450,666 201,172,185,065 951,851,593,362 5,292,817,669 -16,269,157,656 45.15 1 27.65 -734,552,468,146 -449,764,494,044 58 IKAI 2010 -12,126,116,071 107,608,795 78,919,921,558 -26,587,413,072
59 INDF 2010 -3,957,092,000,000 616,242,000,000 18,845,983,000,000 4,595,443,000,000 60 INDR 2010 -318,244,202,000 825,061,702,650 6,909,411,324,680 -253,247,142,930
61 INDS 2010 63,739,478,899 234,171,387,000 368,268,414,075 -115,468,337,539 -3,446,185,708 87.46 1 27.37 -301,403,402,038 -94,320,093,398 62 JECC 2010 -8,787,452,000 35,151,008,000 302,088,582,000 -20,054,922,000 -15,644,367,911 17.58 0 27.05 -275,027,987,873 -423,251,807,762 63 KBLI 2010 11,109,781,395 238,713,438,000 757,637,547,778 -10,283,006,000 4,274,327,707 81.44 1 27.07 348,101,248,432 115,719,600,051 64 KBLM 2010 -1,733,300,471 190,561,104,989 387,272,114,316 -2,520,397,728 -8,473,839,535 71.72 1 26.72 -607,743,771,421 -226,443,748,408 65 KBRI 2010 -473,721,887,023 25,179,457,256 751,588,929,327 7,276,005,644
66 KIAS 2010 -22,284,431,765 187,530,426,752 1,260,891,647,167 76,744,116,527 27,929,429,013 3.42 0 27.87 95,518,647,226 778,308,840,273 67 LMPI 2010 -16,992,231,619 -7,309,349,898 419,015,078,319 6,876,725,676 -5,155,208,912 11.90 0 27.13 -61,346,986,053 -139,886,351,033 68 MASA 2010 -328,198,000,000 303,168,000,000 2,663,300,700,000 323,551,000,000
69 MLBI 2010 122,860,000,000 47,012,000,000 1,044,062,000,000 -206,834,000,000 34,794,454,553
70 PBRX 2010 32,612,899,367 153,269,722,942 416,296,310,433 -127,672,973,679 -34,432,204,075 7.27 0 27.51 -250,322,123,628 -947,279,208,950 71 RMBA 2010 -345,241,000,000 1,643,987,000,000 2,339,824,000,000 510,290,000,000
72 SIPD 2010 36,305,932,052 -23,507,186,489 1,336,285,327,137 31,917,996,027 79,361,867,598 15.77 0 28.35 1,251,536,652,020 2,250,040,572,446 73 SPMA 2010 -53,363,647,190 127,733,902,824 1,803,534,410,532 3,653,040,260 -25,821,678,090
74 SRSN 2010 2,040,205,000 8,500,209,000 260,129,301,000 34,370,987,000
77 ULTJ 2010 -156,758,058,593 251,061,816,547 1,377,215,313,972 248,193,365,887 -21,791,570,512 78 VOKS 2010 -104,855,380,597 351,639,844,415 481,652,288,366 87,614,444,866 -74,935,294,936
79 ADES 2009 -567,000,000 845,000,000 895,488,062,873 65,402,000,000 49,419,400,143 2.59 0 25.91 127,996,246,369 1,280,291,619,055 80 AISA 2009 -13,027,863,807 -17,198,842,971 757,873,593,752 6,918,029,596 5,941,434,518 19.65 1 27.93 116,749,188,288 165,937,897,461 81 AKPI 2009 -112,919,420,000 94,541,982,000 1,941,900,022,000 51,556,306,000 -56,279,345,661 52.51 1 28.09 -2,955,228,440,679 -1,581,070,692,703 82 ALMI 2009 -159,749,114,222 -37,727,201,335 895,488,062,873 -40,057,043,255 -160,566,059,405
83 APLI 2009 -8,940,427,102 15,590,259,982 328,484,820,541 -4,235,302,648 -5,980,927,220 13.33 0 26.43 -79,725,759,841 -158,105,536,022 84 ARGO 2009 179,453,209,000 332,237,063,000 2,306,701,059,000 3,266,540,000
85 ARNA 2009 -24,097,133,764 52,356,618,859 813,588,824,952 -3,184,716,807 -13,826,821,380 86 BATA 2009 -27,905,858,000 39,001,916,000 241,286,695,000 44,213,479,000
87 BRNA 2009 7,677,607,684 11,264,195,674 449,590,968,115 11,213,676,454 21,051,294,622 - 0 26.95 0 567,379,193,303 88 CEKA 2009 -55,189,485,466 675,755,260,186 264,128,402,667 63,658,331,090 -63,185,452,442 92.01 1 27.07 -5,813,693,479,219 -1,710,179,100,536 89 CTBN 2009 -63,692,454,200 1,235,561,800,700 1,387,344,928,400 134,412,089,200
90 DAVO 2009 -219,475,988,715 2,880,657,037,500 3,586,848,174,666 -272,421,841,606
91 ESTI 2009 -24,404,178,610 13,484,398,952 671,463,622,445 -27,274,692,744 -26,436,535,850 13.61 0 26.97 -359,801,252,922 -713,122,774,720 92 FAST 2009 -185,688,067,000 430,564,206,000 364,818,562,000 142,101,807,000 -135,684,238,085 0.32 0 27.67
93 GDST 2009 -97,653,039,359 1,306,695,000,000 643,041,680,503 -266,276,283,870 94 GGRM 2009 190,501,000,000 1,661,797,000,000 12,131,004,000,000 1,004,306,000,000 95 GJTL 2009 -232,075,000,000 -34,197,000,000 6,843,080,000,000 566,313,000,000
96 HDTX 2009 -18,859,250,992 218,250,968,095 1,365,173,653,467 -32,409,663,032 -23,962,097,990 22.85 1 27.72 -547,533,939,079 -664,155,929,244 97 IKAI 2009 -70,777,224,353 -4,842,711,733 945,052,365,255 33,055,986,228 -35,839,816,037 28.90 1 27.36 -1,035,770,683,463 -980,685,419,850 98 INDF 2009 -238,646,000,000 1,166,725,000,000 17,052,803,000,000 -370,299,000,000
99 INDR 2009 -697,761,107,000 -2,824,684,663,800 7,084,064,443,800 153,893,591,800
104 KBRI 2009 39,964,597,987 50,546,848,624 1,228,118,487,935 8,692,247,006 64,258,848,985 18.00 0 27.72 1,156,659,281,728 1,781,574,464,218 105 KIAS 2009 67,215,396,721 -98,655,317,648 1,236,463,294,588 -28,945,945,965 82,583,304,012 3.42 0 27.91 282,434,899,721 2,304,821,026,711 106 LMPI 2009 -6,917,893,359 35,522,282,707 376,896,349,905 22,498,831,136 9,163,757,353 11.90 0 27.02 109,048,712,498 247,566,106,301 107 MASA 2009 -5,869,000,000 337,196,000,000 2,074,922,000,000 54,449,000,000 38,559,484,341
108 MLBI 2009 -186,432,000,000 -125,727,261,936 845,322,000,000 111,677,000,000 -105,523,370,219
109 PBRX 2009 -97,386,912,742 142,537,282,658 393,407,099,493 188,134,956,842 -4,299,654,792 7.27 0 27.43 -31,258,490,339 -117,948,301,589 110 RMBA 2009 -201,515,000,000 135,668,999,753 2,065,095,000,000 108,669,907,586 -116,367,801,984
111 SIPD 2009 44,291,113,956 900,216,248,433 1,090,707,191,158 43,888,968,026 27,031,138,442 15.67 0 28.13 423,577,939,386 760,291,498,271 112 SPMA 2009 -52,398,966,300 6,962,908,343 1,633,738,090,006 56,652,885,205 6,804,240,416 40.70 1 27.99 276,932,584,913 190,454,351,684 113 SRSN 2009 51,961,170,000 33,523,043,000 257,438,402,000 -50,635,438,000
114 SULI 2009 -47,082,543,560 320,521,258,995 2,512,742,348,605 -56,343,644,610 115 TRST 2009 -171,490,510,101 211,587,206,787 2,396,651,676,894 186,011,533,961