On: 23 August 2015, At : 12: 40 Publisher: Rout ledge
I nform a Lt d Regist ered in England and Wales Regist ered Num ber: 1072954 Regist ered office: 5 How ick Place, London, SW1P 1WG
Click for updates
Child Neuropsychology: A Journal on
Normal and Abnormal Development in
Childhood and Adolescence
Publicat ion det ails, including inst ruct ions f or aut hors and subscript ion inf ormat ion: Andersone, Brandon A. Zielinskif, Andrew Alexanderdgh, Nicholas Langeij & Janet E. Lainhartdh
a
Depart ment of Psychology, Brigham Young Universit y, Provo, UT, USA
b
Neuroscience Cent er, Brigham Young Universit y, Provo, UT, USA c
Depart ment of Psychiat ry, Universit y of Ut ah, Salt Lake Cit y, UT, USA
d
Waisman Laborat ory f or Brain Imaging and Behavior, Universit y of Wisconsin, Madison, WI, USA
e
Depart ment of Radiology, Universit y of Ut ah, Salt Lake Cit y, UT, USA
f
Depart ment of Pediat rics and Neurology, School of Medicine, Universit y of Ut ah, Salt Lake Cit y, UT, USA
g
Depart ment of Medical Physics, Universit y of Wisconsin, Madison, WI, USA
h
Depart ment of Psychiat ry, Universit y of Wisconsin, Madison, WI, USA
i
Depart ment s of Psychiat ry and Biost at ist ics, Harvard Universit y, Bost on, MA, USA
j
Neurost at ist ics Laborat ory, McLean Hospit al, Belmont , MA, USA Published online: 21 Aug 2015.
PLEASE SCROLL DOWN FOR ARTI CLE
Taylor & Francis m akes every effort t o ensure t he accuracy of all t he inform at ion ( t he “ Cont ent ” ) cont ained in t he publicat ions on our plat form . How ever, Taylor & Francis, our agent s, and our licensors m ake no represent at ions or warrant ies w hat soever as t o t he accuracy, com plet eness, or suit abilit y for any purpose of t he Cont ent . Any opinions and view s expressed in t his publicat ion are t he opinions and view s of t he aut hors, and are not t he view s of or endorsed by Taylor & Francis. The accuracy of t he Cont ent should not be relied upon and should be independent ly verified w it h prim ary sources of inform at ion. Taylor and Francis shall not be liable for any losses, act ions, claim s, proceedings, dem ands, cost s, expenses, dam ages, and ot her liabilit ies w hat soever or how soever caused arising direct ly or indirect ly in connect ion w it h, in relat ion t o or arising out of t he use of t he Cont ent .
This art icle m ay be used for research, t eaching, and privat e st udy purposes. Any subst ant ial or syst em at ic reproduct ion, redist ribut ion, reselling, loan, sub- licensing, syst em at ic supply, or dist ribut ion in any form t o anyone is expressly forbidden. Term s & Condit ions of access and use can be found at ht t p: / / w w w.t andfonline.com / page/ t erm s-and- condit ions
Beery VMI performance in autism spectrum disorder
Ryan R. Green
1, Erin D. Bigler
1,2,3, Alyson Froehlich
3,
Molly B. D. Prigge
3, Brittany G. Travers
4, Annahir N. Cariello
3,
Jeffrey S. Anderson
5, Brandon A. Zielinski
6, Andrew Alexander
4,7,8,
Nicholas Lange
9,10, and Janet E. Lainhart
4,81
Department of Psychology, Brigham Young University, Provo, UT, USA
2
Neuroscience Center, Brigham Young University, Provo, UT, USA
3Department of Psychiatry, University of Utah, Salt Lake City, UT, USA 4
Waisman Laboratory for Brain Imaging and Behavior, University of Wisconsin, Madison, WI, USA
5
Department of Radiology, University of Utah, Salt Lake City, UT, USA
6
Department of Pediatrics and Neurology, School of Medicine, University of Utah, Salt Lake City, UT, USA
7
Department of Medical Physics, University of Wisconsin, Madison, WI, USA
8
Department of Psychiatry, University of Wisconsin, Madison, WI, USA
9
Departments of Psychiatry and Biostatistics, Harvard University, Boston, MA, USA
10Neurostatistics Laboratory, McLean Hospital, Belmont, MA, USA
Few studies have examined the visuomotor integration (VMI) abilities of individuals with autism spectrum disorder (ASD). An all-male sample consisting of 56 ASD participants (ages 3–23 years) and 36 typically developing (TD) participants (ages 4–26 years) completed the Beery-Buktenica Developmental Test of Visual-Motor Integration (Beery VMI) as part of a larger neuropsychological battery. Participants were also administered standardized measures of intellectual functioning and the Social Responsiveness Scale (SRS), which assesses autism and autism-like traits. The ASD group performed significantly lower on the Beery VMI and on all IQ measures compared to the TD group. VMI performance was significantly correlated with full scale IQ (FSIQ), performance IQ (PIQ), and verbal IQ (VIQ) in the TD group only. However, when FSIQ was taken into account, no significant Beery VMI differences between groups were observed. Only one TD participant scored 1.5 standard deviations (SDs) below the Beery VMI normative sample mean, in comparison to 21% of the ASD sample. As expected, the ASD group was rated as having significantly higher levels of social impairment on the SRS compared to the TD group across all major domains. However, level of functioning on the SRS was not associated with Berry VMI performance. These findings demonstrate that a substantial number of individuals with ASD experience difficulties compared to TD in performing VMI-related tasks, and that VMI is likely affected by general cognitive ability. The fact that lowered Beery VMI performance occurred only within a subset of individuals with ASD and did not correlate with SRS would indicate that visuomotor deficits are not a core feature of ASD, even though they present at a higher rate of impairment than observed in TD participants.
Keywords: Beery-Buktenica Developmental Test of Visual-Motor Integration; Autism, Spectrum Disorder; Visuomotor; Intellectual Ability; Social Responsiveness Scale (SRS).
No potential conflict of interest was reported by the authors.
Address correspondence to Erin D. Bigler, Ph.D., Department of Psychology & Neuroscience Center, Brigham Young University, 1001 SWKT, Provo, UT 84602 USA. E-mail:[email protected]
http://dx.doi.org/10.1080/09297049.2015.1056131
© 2015 Taylor & Francis
Autism spectrum disorder (ASD) is a complex neurodevelopmental disorder typified by impairments in social communication and stereotyped behaviors Diagnostic and Statistical Manual of Mental Disorders – 5th Edition (DSM‐5; American Psychiatric
Association, 2013). Additionally, individuals with ASD often present with an array of developmental delays which may affect multiple cognitive domains (Duffield et al.,
2013; Geschwind, 2009; Gidley-Larson & Mostofsky, 2008; Gilbert, Meuwese, Towgood, Frith, & Burgess, 2008; Keary et al., 2009; Minshew, Goldstein, & Siegel, 1997; Polšek, Jagatic, Cepanec, Hof, & Šimić, 2011; Southwick et al., 2011; Takarae, Luna, Minshew, & Sweeney, 2008). Problems with sensory sensitivity and responsivity in the form of hypo- or hyper-reactivity for tactile, visual, and/or auditory information is now considered another core feature of ASD (DSM-5; American Psychiatric Association, 2013; Minshew & Hobson, 2008; Occelli, Esposito, Venuti, Arduino, & Zampini, 2013; O’Riordan & Passetti, 2006; Simmons et al., 2009). Deficits with temporal integration of multisensory information in ASD have been considered as potential explanations for sensory and motor disturbances in autism (Stevenson et al., 2014).
Children with ASD have increased difficulty with visuomotor integration (VMI; Dowd, McGinley, Taffe, & Rinehart, 2012), including problems with handwriting (Fuentes, Mostofsky, & Bastian, 2010; Johnson et al., 2013; Kushki, Chau, & Anagnostou, 2011). Combined with motor skills, visual control over motor function is requisite in tasks such as copying (Braddick & Atkinson, 2013). The degree to which visuomotor impairments in ASD are influenced by motor impairments is not known, but various deficits in motor functioning such as stereotyped/repetitive behaviors, abnormal gait and posture, diminished fine motor coordination, catching and balance, as well as deficits in imitative movements such as facial expressions or waving goodbye, have been well documented (Ament et al., 2014; Chukoskie, Townsend, & Westerfield, 2013; Dawson & Watling, 2000; Duffield et al., 2013; Hardan, Kilpatrick, Keshavan, & Minshew,2003; Hilton, Zhang, Whilte, Klohr, & Constantino, 2012; McPhillips, Finlay, Bejerot, & Hanley, 2014; Mostofsky et al., 2009; Soper, Wolfson, & Canavan, 2007). Indeed, Libertus, Sheperd, Ross, and Landa (2014) have shown that fine motor and grasping skills at six months in infants at high risk for autism are below matched infants without a family history of ASD.
Assessment of visuomotor functioning has long been a standard part of neu-ropsychological testing (Lezak, Howieson, Bigler, & Tranel, 2012). Tasks that assess VMI are assumed to evaluate the “ability to integrate the visual images of letters or shapes with the appropriate motor response” (Tseng & Cermak, 1993, p. 923). Wolynski, Schott, Kanowski, and Hoffmann (2009, p. 1313) stated that “[v]isual information is of crucial importance for the preparation, initiation and guidance of motor actions and a key aspect of behavioral neuroscience”. These authors go on to state that a general agreement has been established that VMI processes are accom-plished by a cortical network involving posterior parietal and premotor areas of the frontal lobe—the traditional sensory-motor systems of the brain. Integrating a sen-sory input with a behavioral output is a more complex neurological process than performing either on its own and requires intra- as well as inter-hemispheric transfer of information. Additionally, recent developments in the understanding of the cere-bellum and its relation to coordinating cognitive tasks and motor function suggest cerebellar involvement in VMI (O’Halloran, Kinsella, & Storey,2012; Rogers et al.,
2013). Moreover, producing a written product also necessitates complex cognitive
processes such as planning, goal orientation, and sustaining attention throughout the task (Jones & Christensen, 1999). VMI thus requires higher-order assimilation of multidimensional sensory input (visual), behavioral output (motor), and a variety of cognitive processing demands that coordinate guided eye-hand movements (Bertone, Mottron, Jelenic, & Faubert, 2005; Takarae, Minshew, Luna, & Sweeney, 2007).
The above evidence suggests that VMI deficits are expected in individuals with ASD, given the multiple, complex neurological processes that must be integrated in order to perform a VMI task and given the fact that deficits have been observed in various neurocognitive processes in ASD—yet published VMI studies in ASD have resulted in inconsistent findings.
An early study by Fulkerson and Freeman (1980) demonstrated reduced per-formance on the Beery-Buktenica Developmental Test of Visual-Motor Integration (Beery VMI) in a sample of individuals with autism. A more recent study by Reinvall, Voutilainen, Kujala, and Korkman (2013) found deficits in visuomotor precision and design copying on the Finnish version of the Developmental Neuropsychology Assessment – Second Edition (NEPSY-II; Korkman, Kirk, & Kemp, 2008) in individuals with Asperger’s syndrome. Also using the NEPSY-II, Narzisi, Muratori, Calderoni, Fabbro, and Urgesi (2013) found deficits in design copy and line orientation compared to controls, in a group which consisted of individuals with Pervasive Developmental Disorder – Not Otherwise Specified (PDD-NOS) and individuals with ASD, both of which exhibited full scale IQs (FSIQs) above 80. Additionally, Mayes and Calhoun (2007) found significant differ-ences between autism and control groups on the Developmental Test of Visual Motor Integration (DTVMI).
In contrast, Minshew et al. (1997) did not observe VMI deficits in an ASD sample that included children and adults (IQ > 80). However, consistent with the previously mentioned potential for motor deficits in individuals with ASD, these authors found significant differences in performances on Grooved Pegboard and Trail Making A, but not in Finger Tapping. A follow-up study of children with ASD (IQ > 80) compared to adults with ASD by Williams, Goldstein, and Minshew (2006) also did not find the visuospatial domain to significantly exemplify the ASD neuropsychological profile for either children or adults. They did however demonstrate that deficits in grip strength and the Wechsler Intelligence Scale for Children-III Coding (Wechsler,1991), but not Finger Tapping or Grooved Pegboard (see Lezak et al.,2012), were associated with the neurop-sychological profile of adults and children with ASD.
Visuomotor integration is likely a composite brain function that requires visual attention, visual feature detection and identification, anticipatory judgment, motor planning and motor execution. The small amount of literature on functional imaging to date has generally not observed deficits in visual perception and feature detection in autism. For example, in four separate studies using an embedded figure task, autism participants exhibited normal or increased activation of visual cortex and lateral occipital regions, and relatively normal activation of visual attentional regions along the medial intraparietal sulcus (Lee et al., 2007; Malisza et al., 2011; Manjaly et al.,
2007; Ring et al., 1999). More complex tasks requiring mental rotation have shown decreased activation in autism in the anterior cingulate cortex, frontal eye fields, and caudate nuclei (Silk et al.,2006).
Although both gross and fine motor skills may be impaired in autism (Fournier, Hass, Naik, Lodha, & Cauraugh,2010), functional imaging of motor responses has been
mixed. A button-pressing task demonstrated increased cerebellar activation for continuous pressing, but decreased cerebellar activation when buttons were pressed in response to attentional cues (Allen & Courchesne, 2003). In another study examining appositional finger tapping, autism subjects showed reduced activation of the ipsilateral cerebellum but greater activation in the supplementary motor area (Mostofsky et al.,2009). Furthermore, Nebel, Eloyan, Barber, and Mostofsky (2014) have shown differences in frontal connec-tivity involving the precentral gyrus in individuals with autism.
One of the most commonly used standardized measures of VMI is the Beery VMI (Beery,1989,1996; Beery & Beery,2004; Lezak et al.,2012). Although the Beery VMI has a rich tradition in assessing children and adults with various developmental disorders and acquired brain injuries (Bloch et al., 2011; Sutton et al., 2011), remarkably few studies have examined Beery VMI findings in ASD. The current study sought to add to the VMI literature in ASD by examining Beery VMI performance in a large ASD group whose ages ranged from childhood through young adulthood.
The specific aims of the study were to provide a descriptive analysis of the relation between VMI performance, IQ, and ASD in an attempt to clarify previous discrepant findings. Although cross-sectional, we felt that is was important to assess a broad age-range of ASD participants and typically developed controls, since it is well established that VMI performance is in part age-dependent. Furthermore, since visuo-motor abilities positively correlate with IQ measures (Baron et al.,2014; Bolen,2003), the only restriction on IQ was a lower limit, which ensured some ability to comply with the demands of neuropsychological testing. To explore ASD severity issues, we examined Beery VMI findings in relation to scores on the Social Responsiveness Scale (SRS; Constantino, 2002), where the SRS is used to specify the severity of the ASD symptoms (see Constantino et al., 2003). Although not using the SRS, MacDonald, Lord, and Ulrich (2014) have shown that ASD children with reduced motor skill have greater social communicative skill deficits. Since motor activities required to perform VMI tasks are but a subset of overall motor functioning, we wanted to explore if relations are present between SRS findings and Beery VMI findings. Furthermore, we hypothesized that individuals with ASD would perform more poorly on a VMI task compared to individuals in the typical development (TD) group and that individuals with more severe forms of ASD would perform more poorly on both IQ and VMI measures.
There are major participant ascertainment issues for both those assessed with ASD as well as TD controls (see Howe, Yatchmink, Viscidi, & Morrow, 2014; Idring et al.,
2012; Tager-Flusberg, 2004). For the current study we elected to examine a broad age-range (3–26 years) of only male participants recruited to be part of a longitudinal study focused on brain maturation from early childhood to early adulthood (see Lange et al.,
2014; Travers et al.,2014; Zielinski et al.,2014). The advantage of such a design is that it mimics clinical reality for a large age-span of individuals with ASD but the disadvantage is that because of the greater likelihood for lower levels of intellectual ability in the ASD sample, it becomes impossible to truly match on that dimension. For neurodevelopmental disorders where intellectual ability may directly relate to the disorder, some argue that minimal to no front-end control should be imposed on the TD sample (see Dennis et al.,
2009). Therefore, for the current study ASD participants with a much broader range of intellectual ability were recruited than was the case for the TD sample. Accordingly, analyses initially statistically controlled for age and intellectual differences between the ASD and TD samples.
METHOD
Subjects and Assessment
Ascertainment. ASD and TD participants were recruited over a 10-year period (1997–2007), predominantly from community sources. The subset for this investigation was selected from the larger sample based on age within the reference norms of the Beery VMI, having complete Beery VMI data from the time of initial assessment and closeness of matching on age and handedness. All facets of this investigation were undertaken with the understanding and written consent of each subject or legal guardian, with the approval of the University of Utah and Brigham Young University Institutional Review Boards, where testing was performed, and in compliance with national legislation and the Code of Ethical Principles for Medical Research Involving Human Subjects of the World Medical Association. Additional details regarding participants have been previously published (Alexander et al.,2007; Bigler et al.,2003).
Participant Groups. All participants were male and 3 to 26 years of age, thus precluding analysis of potential sex differences. A total of 56 participants comprised the ASD group and 36 participants comprised the TD group.
Idiopathic Autism Sample. Autism was rigorously diagnosed for all 56 ASD participants using the Autism Diagnostic Interview – Revised (ADI-R; Lord, Rutter, & LeCouteur, 1994), a semi-structured, investigator-based interview with good reliability and validity, and the Autism Diagnostic Observation Schedule–Generic (ADOS-G; Lord et al.,2000), a semi-structured play and interview session also with good reliability and validity, designed to elicit social, communication, and stereotyped repetitive behaviors characteristic of autism. Of the subjects, 48 met ADI-R, ADOS-G, and theDiagnostic and Statistical Manual of Mental Disorders–Fourth Edition(DSM-IV; American Psychiatric
Association, 1994) criteria for autistic disorder and 8 met the criteria for PDD-NOS. History, physical exam, fragile-X gene testing, and karyotype performed on all subjects excluded medical and genetic causes of autism.
Control Sample. The 36 control subjects had no developmental, neurological, or clinical history for major psychiatric disorders. All control subjects completed an assess-ment with the ADOS-G and were rigorously assessed to demonstrate that they did not have an autism spectrum disorder.
Measures
Visuomotor Integration. VMI was measured using the Beery VMI (Beery,
1989,1996; Beery & Beery,2004). Given the longitudinal nature of the parent project, the third to fifth editions of the Beery VMI were used during the various stages of data collection. The stimuli in the various editions did not change. The Beery VMI is comprised of drawings of geometric forms that increase in difficulty. The forms are copied with paper and pencil, and scored based on objective scoring criteria outlined in the test manuals according to how accurately they have been copied compared to the original. The Beery VMI has been demonstrated to have good reliability and
validity as reported in the manual. Raw scores were converted to age-appropriate standard scores based on the standardization sample reported for the corresponding version of Beery VMI used. No significant group differences were observed between the three versions for either the ASD or TD samples.
IQ. Various measures of intellectual functioning were utilized given the age range of participants in the study and because of changes in IQ test instruments over the 10 years of recruiting subjects for the parent project. For the present investiga-tion, FSIQ, performance IQ (PIQ), and verbal IQ (VIQ) were measured using the Wechsler Intelligence Scale for Children – Third Edition (WISC-III; Wechsler,
1991), the WISC – Fourth Edition (WISC-IV; Wechsler, 2003), the Wechsler Adult Intelligence Scale – Third Edition (WAIS-III; Wechsler, 1997), or the Differential Ability Scales (DAS; Elliott, 1990). A VIQ minus PIQ comparison was made between ASD and TD participants because some have suggested that IQ profile analyses may be predictive of phenotypic differences in development (Margolis et al., 2013). For example, lower VIQ may reflect greater language impairment, whereas lower PIQ may reflect greater perceptual-motor impairment (Charman et al., 2011). It should be noted that the most up-to-date, age-specific norms were used.
Social Responsiveness Scale (SRS). To determine the severity of autism spectrum characteristics, the SRS was utilized (Constantino, 2002). The SRS is a 65-item other-report rating scale that provides an understanding of an individual’s social impairments, including social awareness, social information processing, ability to reci-procate social communication, anxiety/avoidance, and preoccupations. Higher scores indicate more severe impairments. The SRS was normed on individuals whose ages ranged from 4 to 18 years.
Handedness. Handedness was measured using the Edinburgh Handedness Inventory (Oldfield, 1971). A score of +100 signifies complete right handedness and −100 indicates complete left handedness.
STATISTICAL ANALYSES
Independent samples t tests were conducted to derive descriptive statistics using group means. Pearson correlations were computed along with analysis of covariance (ANCOVA) to better understand the relation between Beery VMI perfor-mance and IQ variables. Pearson correlations of Beery VMI and SRS were also computed.
Clinical impairment on standardized neuropsychological measures is often con-servatively defined as falling two standard deviations (SDs) below the mean of a normative sample and less conservatively defined as falling 1.5 SDs below the mean of a normative sample (Lezak et al., 2012; Strauss, Sherman, & Spreen, 2006). A frequency count was used to determine how many participants in each group per-formed at or below these two levels of impairment based on normative data derived from the Beery VMI manuals.
RESULTS
Sample Characteristics
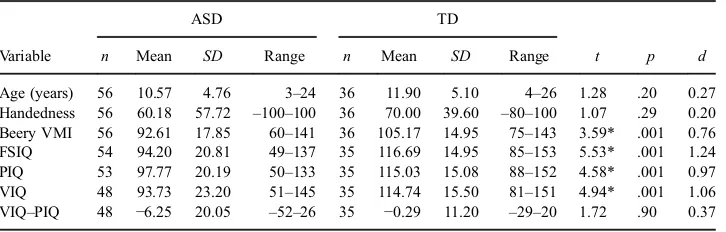
During sample characteristics analyses, pairwise deletion was used to maximize power in the overall sample. No significant differences between ASD and TD groups were observed in age or handedness. As expected, and indicated in Table 1, significant differences were observed between groups in VMI, FSIQ, PIQ, and VIQ. No significant differences were found for the computed variable VIQ–PIQ across groups.
VMI and IQ Relationships
Results for Beery VMI performance are summarized inTable 1. The ASD group performed significantly below the TD group (p ≤ .001), resulting in a large effect size difference (Cohen’sd= 0.76). Additionally, the ASD group displayed a greater number of Beery VMI scores toward the lower end of the range of scores. For instance, 6 of the 56 (11%) ASD participants scored at or below the conservatively defined impaired range (i.e.,≥2SDs below the normative sample mean; standard score < 71) whereas none of the TD participants scored 2SDs or more below the mean of the normative sample. When the impaired range was defined less conservatively (< 1.5SDs; standard score < 78), 12 of the 56 (21%) ASD participants and 1 of the 36 (3%) TD participants scored at or below the impaired range.
Pearson correlations for VMI performance and IQ are summarized inTable 2, while
Table 3summarizes the frequencies of the IQ tests used in the study. All IQ variables in both the ASD and the TD groups were correlated with one another, as expected. Interestingly, none of the IQ variables were significantly correlated with Beery VMI performance in the ASD group, whereas FSIQ and PIQ were significantly correlated with VMI performance in the TD group, and the VIQ correlation trended toward sig-nificance (p= .06).
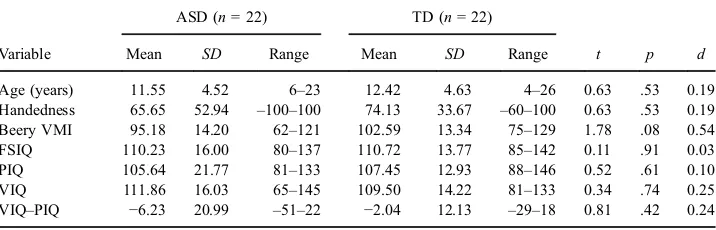
Of the participants, 12 ASD and 0 TD exhibited FSIQ standard scores below 80. Analyses were repeated (see Table 4) with these 12 ASD participants removed and included only the participants with matching FSIQ scores within ±5 points (ASD, n= 22; TD,n= 22). This FSIQ-restricted analysis resulted in a non-significant difference
Table 1 Sample Characteristics Using Pairwise Deletion.
ASD TD
Variable n Mean SD Range n Mean SD Range t p d
Age (years) 56 10.57 4.76 3–24 36 11.90 5.10 4–26 1.28 .20 0.27 Handedness 56 60.18 57.72 –100–100 36 70.00 39.60 –80–100 1.07 .29 0.20 Beery VMI 56 92.61 17.85 60–141 36 105.17 14.95 75–143 3.59* .001 0.76 FSIQ 54 94.20 20.81 49–137 35 116.69 14.95 85–153 5.53* .001 1.24 PIQ 53 97.77 20.19 50–133 35 115.03 15.08 88–152 4.58* .001 0.97 VIQ 48 93.73 23.20 51–145 35 114.74 15.50 81–151 4.94* .001 1.06 VIQ–PIQ 48 −6.25 20.05 –52–26 35 −0.29 11.20 –29–20 1.72 .90 0.37
Note. *p< .001; ASD = autism spectrum disorder; TD = typically developing; Handedness = Edinburgh Handedness Inventory based on a scale from−100 (left-handed) to 100 (right-handed); FSIQ = full scale IQ; PIQ = performance IQ; VIQ = verbal IQ.
between groups on Beery VMI performance (VMI restricted FSIQ, d = 0.54). The difference between the non-restricted and restricted FSIQ effect sizes was 0.22. Additionally, no significant differences were observed in the group of participants with restricted FSIQ scores in FSIQ, PIQ, VIQ, or VIQ–PIQ, whereas in the original, non-FSIQ-restricted analysis, all IQ variables but the VIQ–PIQ variable were significantly different.
Table 3 Frequencies of IQ Tests.
ASD TD
Test n n
DAS 46 29
WISC-III 2 1
WISC-IV 1 0
WAIS-III 5 5
Note. ASD = autism spectrum disorder; TD = typically devel-oping; DAS = Differential Ability Scales; WISC-III = Wechsler Intelligence Scale for Children – Third Edition; WISC-IV = WISC – Fourth Edition; WAIS-III = Wechsler Adult Intelligence Scale–Third Edition.
Table 4 Sample Characteristics of Groups Matched on FSIQ Standard Scores > 79.
ASD (n= 22) TD (n= 22)
Variable Mean SD Range Mean SD Range t p d
Age (years) 11.55 4.52 6–23 12.42 4.63 4–26 0.63 .53 0.19 Handedness 65.65 52.94 –100–100 74.13 33.67 –60–100 0.63 .53 0.19 Beery VMI 95.18 14.20 62–121 102.59 13.34 75–129 1.78 .08 0.54 FSIQ 110.23 16.00 80–137 110.72 13.77 85–142 0.11 .91 0.03 PIQ 105.64 21.77 81–133 107.45 12.93 88–146 0.52 .61 0.10 VIQ 111.86 16.03 65–145 109.50 14.22 81–133 0.34 .74 0.25 VIQ–PIQ −6.23 20.99 –51–22 −2.04 12.13 –29–18 0.81 .42 0.24
Note. ASD = autism spectrum disorder; TD = typically developing; Handedness = Edinburgh Handedness Inventory based on a scale from−100 (left-handed) to 100 (right-handed); Beery VMI = Beery-Buktenica Developmental Test of Visual-Motor Integration; FSIQ = full scale IQ; PIQ = performance IQ; VIQ = verbal IQ. Table 2 Correlation Matrix of Beery VMI and IQ Using Listwise Deletion.
ASD (n= 48) TD (n= 35)
Variable FSIQ PIQ VIQ FSIQ PIQ VIQ
Beery VMI .25 .21 .11 .49* .48* .32
FSIQ – .85* .88* – .89* .83*
PIQ – – .57* – – .73*
Note. *p < .003; Beery VMI = Beery-Buktenica Developmental Test of Visual-Motor Integration; ASD = autism spectrum disorder; TD = typically developing; FSIQ = full scale IQ; PIQ = performance IQ; VIQ = verbal IQ.
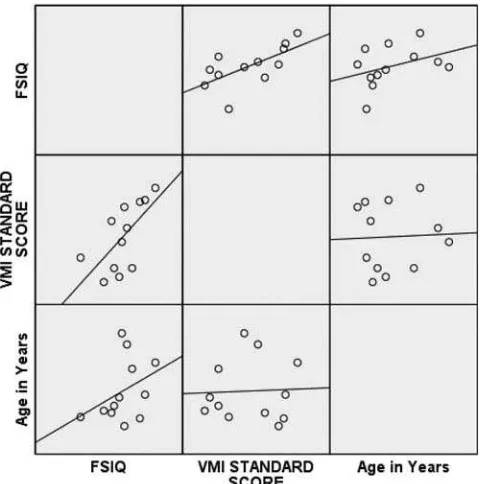
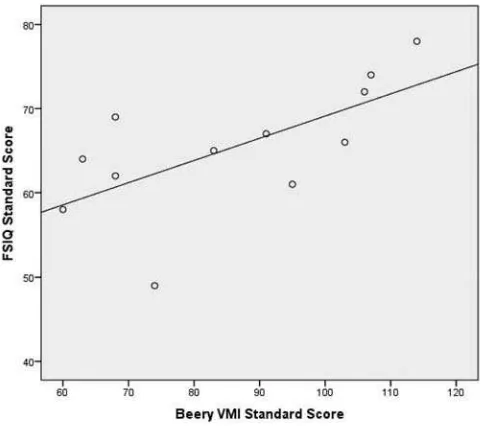
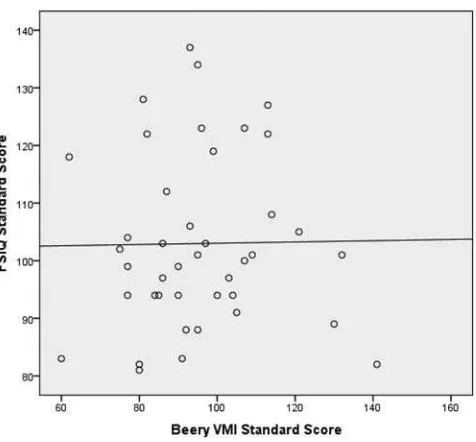
Pearson correlations were then performed on the subset of 12 ASD participants with FSIQ below 80 and the subset of ASD participants with a FSIQ above 79 (seeFigures 1
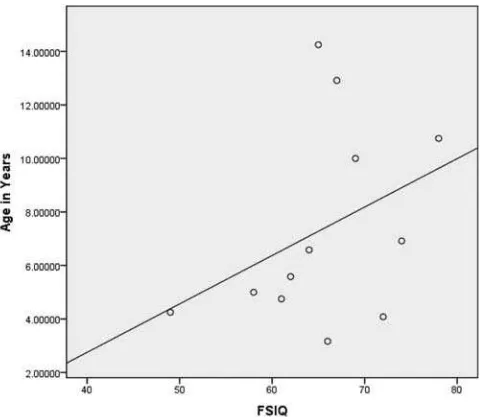
and 2 for a broad graphic representation of all data, and Figures 3–6 for specific representations of age, Beery VMI, and FSIQ relationships). Interestingly, significant correlations were observed between Beery VMI, FSIQ, and PIQ but not VIQ for those with a FSIQ below 80, but no significant correlations between Beery VMI and IQ variables were observed for those with a FSIQ above 79 (see Table 5). Although the ages in the two groups were considerably different, the age-specific normative data used in the study limit any potential age-related confounds. To further test this, partial correla-tions controlling for age were undertaken, with no meaningful changes observed.
As indicated above, Figures 1–6 and Table 5 illustrate the relationships between data. Of specific interest is that in the ASD group with FSIQ < 80, relatively strong correlations were observed in VMI performance such that the higher the FSIQ the higher the VMI scores. In contrast, no such correlation was observed in the ASD group with FSIQ > 79, suggesting that FSIQ is a predictor of VMI performance only in the lower functioning group. Similarly, age in the ASD group with FSIQ < 80 appears to be associated with FSIQ such that the older the individual, the higher the FSIQ score, whereas this relationship was not observed in the ASD group with FSIQ > 79. It should be noted, however, that the sample size in the FSIQ group was somewhat small and thus this trend may be overturned if a larger sample is observed. Interestingly, it can be seen in Figures 1 and 2 that in the ASD group with FSIQ < 80 there is no relationship between age and VMI score, whereas in the ASD group with FSIQ > 79 there appears to be a trend such that the older the individual is, the lower they tend to score on the VMI tasks.
Figure 1 Scatterplot matrix of ASD participants with FSIQ standard score below 80.
Figure 2 Scatterplot matrix of ASD participants with FSIQ standard score above 79.
Figure 3 Scatterplot of ASD participants with FSIQ standard score below 80 by age.
An ANCOVA was performed on a listwise subset of participants (ASD,n= 54; TD, n = 35) to further understand the relation between IQ variables and VMI performance. The interaction between group and covariate was not statistically significant; therefore, the ANCOVA reported here excludes the interaction term. When FSIQ was statistically Figure 5 Scatterplot of ASD participants with FSIQ standard score below 80 by Beery VMI standard score.
Figure 4 Scatterplot of ASD participants with FSIQ standard score above 79 by age.
controlled, the main effect for group Beery VMI performance was non-significant [F(1, 86) = 2.34,p= .13,ƞp2= .027].
SRS and VMI Relationships
SRS t-scores in the Awareness, Cognition, Communication, Motivation, Mannerisms, and SRS Total domains were analyzed (see Table 6). All SRS scores for the ASD group were normally distributed, showing no skewness or kurtosis. As expected, all SRS scores for the TD group, with the exception of the Awareness scale, were skewed left and leptokurtic. This skewness and kurtosis was expected given the higher level of functioning across the SRS domains in the TD group. As expected, all SRS variables were significantly different between groups, with ASD participants’level of functioning being rated consistently poorer across all variables.
Figure 6 Scatterplot of ASD participants with FSIQ standard score above 79 by Beery VMI standard score.
Table 5 Correlation Matrix of Beery VMI and IQ for ASD Participants with FSIQ < 80 and > 79.
ASD: FSIQ < 80 (n= 12) ASD: FSIQ > 79 (n= 41)
Variable FSIQ PIQ VIQ FSIQ PIQ VIQ
Beery VMI 0.66* 0.61* −0.05 0.02 −0.04 −0.25
FSIQ – 0.92** 0.48 – 0.73** 0.84**
PIQ – – 0.25 – – 0.36*
Note. *p< .05; **p =< .01; Beery VMI = Beery-Buktenica Developmental Test of Visual-Motor Integration; ASD = autism spectrum disorder; FSIQ = full scale IQ; PIQ = performance IQ; VIQ = verbal IQ.
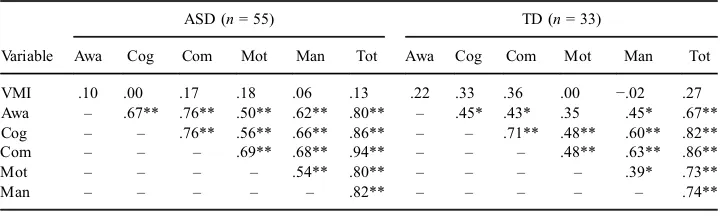
Partial correlations between SRS domains and Beery VMI were performed. All SRS domains were significantly correlated with each other in both groups, with the exception of the correlation between Awareness and Motivation in the TD group. None of the SRS domains were significantly correlated with Beery VMI performance in either group (see Table 7). However, correlations between Beery VMI and the Cognition and the Communication domains trended toward significance in the TD group (respectively: r = .33, p = .073; r = .36, p = .053).
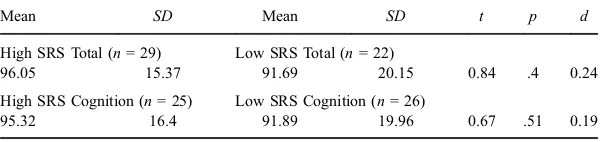
Additional independent-samples t-tests were performed to determine if level of functioning per the SRS Total Scale and Cognition domains were associated with significant differences in Beery VMI scores within the ASD group. Lower level of function on the SRS Total Scale and Cognition domains was defined conservatively as being 3 SDs above the mean (with higher scores indicating lower levels of functioning). This allowed for a good split between the ASD participants who scored > 3 SDs above the mean and those who scored < 3 SDs below the mean (see
Table 8). No significant differences between higher and lower functioning ASD participants based on the SRS Total Score were observed in Beery VMI perfor-mance. Similarly, no significant differences between higher and lower functioning ASD participants based on the SRS Cognition domain were observed in Beery VMI performance.
Table 6 SRS Characteristics.
ASD (n= 50) TD (n= 30)
Variable Mean SD Range Mean SD Range t p d
Awareness 73.40 12.43 46–94 42.90 7.57 30–59 13.64* .001 2.96 Cognition 79.54 13.52 43–103 41.30 5.13 36–54 17.97* .001 3.74 Communication 80.14 10.93 53–107 41.40 4.84 36–56 21.76* .001 4.58 Motivation 73.26 17.24 42–106 43.43 6.98 37–63 10.84* .001 2.27 Mannerisms 84.68 13.37 55–117 42.53 3.64 40–51 21.03* .001 4.30 Total 83.20 12.91 51–109 40.97 4.81 34–53 20.85* .001 4.33
Note. *p< .001; ASD = autism spectrum disorder; TD = typically developing; SRS = Social Responsiveness Scale.
Table 7 Pearson Correlation Matrix of Beery VMI and SRS Domains.
ASD (n= 55) TD (n= 33)
Variable Awa Cog Com Mot Man Tot Awa Cog Com Mot Man Tot
VMI .10 .00 .17 .18 .06 .13 .22 .33 .36 .00 −.02 .27
Awa – .67** .76** .50** .62** .80** – .45* .43* .35 .45* .67** Cog – – .76** .56** .66** .86** – – .71** .48** .60** .82**
Com – – – .69** .68** .94** – – – .48** .63** .86**
Mot – – – – .54** .80** – – – – .39* .73**
Man – – – – – .82** – – – – – .74**
Note. *p < .05; **p < .01; Beery VMI = Beery-Buktenica Developmental Test of Visual-Motor Integration; SRS = Social Responsiveness Scale; ASD = autism spectrum disorder; TD = typically developing; Awa = Awareness; Cog = Cognition; Com = Communication; Mot = Motivation; Man = Mannerisms; Tot = Total.
DISCUSSION
The objectives of the current study were to examine and describe the visuomotor performance in an all-male ASD sample with ages that ranged from childhood to early adulthood and to better understand how these findings relate to IQ and level of function-ing. At a group level, the ASD sample exhibited an overall attenuation in VMI perfor-mance associated with reduced FSIQ, VIQ, and PIQ when compared to age-matched TD controls. Our sample purposefully included a large range of intellectual abilities which reflected the broad range of cognitive phenotypes observed in autism (Dissanayake, Bui, Bulhak-Paterson, Huggins, & Loesch,2009). A large effect size difference in Beery VMI performance suggested decreased VMI in the ASD subjects; however, this appeared to be driven by a subgroup of ASD participants with overall lower intellectual ability. Only 1 TD participant had a Beery VMI score < 1.5 SDs below the normative sample mean, whereas 12 individuals (21%) in the ASD sample did. The differences in VMI perfor-mance appeared to be driven by a subset of ASD participants with lower FSIQ such that when those with FSIQ scores < 80 were removed from the analysis, the effect size was decreased by d = 0.22 and a significant difference between ASD and TD Beery VMI performance was no longer observed. Additional support for the notion that FSIQ con-tributes considerably to Beery VMI performance was seen when significant differences were no longer observed in the entire sample after statistically controlling for FSIQ. It should be noted that four different IQ measures were used in the current study. However, the DAS was the most frequently used IQ test administered in both groups (i.e., 46 of 54 in the ASD group, and 29 of 35 in the TD group). Therefore, it is unlikely that differences in visual-spatial emphasis between IQ measures considerably impacted the results.
The relation between IQ as a marker of general cognitive ability and Beery VMI performance in ASD is complex. There is a substantial literature demonstrating that ASD individuals perform more poorly than controls on a wide variety of neuropsychological measures (see Duffield et al.,2013; Geschwind,2009; Gidley-Larson & Mostofsky,2008; Gilbert et al., 2008; Keary et al., 2009; Minshew et al., 1997; Polšek et al., 2011; Southwick et al.,2011; Takarae et al.,2008). All areas of cognitive functioning, including VMI-derived metrics, are likely related under the umbrella of what has been referred to as
“general intelligence” or “g” (Deary, 2012). The design of this investigation was not intended to explore how performance on VMI measures relates to “g”, other than reporting VMI-IQ correlations. How motor abilities, and in particular VMI abilities, may be separated from general cognitive ability needs to be addressed in future studies. Since those with lower intellectual ability performed worse on VMI measures, whether their visuomotor impairment was truly a reduction in perceptual-motor functioning or
Table 8 Comparisons of High and Low ASD Scorers on SRS Total and SRS Cognition.
Mean SD Mean SD t p d
High SRS Total (n= 29) Low SRS Total (n= 22)
96.05 15.37 91.69 20.15 0.84 .4 0.24
High SRS Cognition (n= 25) Low SRS Cognition (n= 26)
95.32 16.4 91.89 19.96 0.67 .51 0.19
Note. SRS = Social Responsiveness Scale; ASD = autism spectrum disorder.
simply a byproduct of lowered “g” cannot be answered. How to separate VMI perfor-mance from some aspect of “g”awaits further investigation. When the entirety of the current sample was considered, FSIQ correlated positively with Beery VMI in both the ASD and TD groups, yet was only significant within the TD group. This suggests a divergence between ASD and TD in the interrelation of cognitive and perceptual-motor abilities, likely reflecting a difference in cerebral organization. However, when correla-tions between Beery VMI and IQ variables were performed in the subset of 12 ASD participants with FSIQ scores below 80, significant correlations were observed between Beery VMI, FSIQ, and PIQ, while no significant correlations were observed in Beery VMI and IQ variables in the remaining 42 ASD participants who exhibited FSIQ scores at or above 80. This finding suggests a further complexity in the phenotypic relationship in ASD individuals who exhibit lower levels of overall cognitive abilities and those with higher levels of overall cognitive functioning.
Interestingly, within ASD participants age was related to VMI performance such that older age was associated with lower VMI scores. Recently, we have shown that cortical volume and thickness have different developmental trajectories between TD and ASD groups (Lange et al.,2014; Zielinski et al.,2014). Factors related to cellular pruning and issues of neural connectivity are major discussion points involving the origins of ASD (see Thomas, Davis, Karmiloff-Smith, Knowland, & Charman, 2015). Indeed, Courchesne, Campbell, and Solso (2011) have shown some age-related accelerated brain volume loss in autism after adolescence, but how such factors may influence VMI performance has not been examined.
To further add to the complexity, the relation of Beery VMI performance to core ASD symptoms based on SRS findings was not significant. That is, increased levels of social impairment as reflected in SRS scores was not an indicator of worse Beery VMI scores. Of course, VMI is but a subset of a larger repertoire of motor skills which may relate to severity of social impairment (MacDonald et al., 2014). For example, Reiersen, Constantino, and Todd (2008) found that the combination of ASD and motor problems associated with comorbid attention-deficit hyperactivity disorder was associated with higher SRS findings. The notion that motor impairment and by extension VMI may affect social functioning may be appreciated in the context that observable motor skill deficits could relate to social rejection. Social rejection has been the topic of studies in individuals with impaired motor skills within the autism spectrum as well as disorders of motor development or acquired motor impairment (see Emck, Bosscher, Beek, & Doreleijers, 2009; Lubans, Morgan, Cliff, Barnett, & Okely, 2010; Samson, Huber, & Ruch, 2011; Sigmundsson, 2005). Despite these possible associations, in the current study VMI and SRS were not significantly associated. Nonetheless, future investigations should examine how VMI performance in ASD relates to other motor skill levels and whether motor ability in a broader sense relates to emotional and social functioning.
Given the above discussion on intellectual findings with Beery VMI yet no relation with level of social impairment, it appears that the lowered visuomotor ability in ASD occurs primarily as a function of lower FSIQ below 80. Thus, the lower Beery VMI scores observed when the entire ASD group was compared to the TD participants was driven by those with FSIQ < 80. As with the study by Wilson et al. (2014), once intellectual abilities are controlled in individuals characterized as“high-functioning”, differences in cognitive functioning with TD samples are either minimalized or eliminated.
Reinvall et al. (2013) found deficits in ASD in Visuomotor Precision and Design Copying on the Finnish version of the NEPSY-II, while Mayes and Calhoun (2003,2007) obtained similar findings using the DTVMI. As shown in the present study, VMI performance was attenuated at the group level. However, more than three quarters of the ASD participants in the current ASD cohort did not exhibit VMI performance deficits (i.e., performance within 1.5 SDs of the normative sample), which is consistent with Minshew et al.’s (1997) observations in their ASD sample.
Methodological differences also highlight potential similarities and distinctions across different ASD and VMI studies. The Minshew et al. (1997) and Williams et al. (2006) studies restricted FSIQ to be 80 or above as an inclusion criterion. In the current study, when post hoc analyses were conducted restricting FSIQ to above 80, the pattern of results changed considerably, suggesting that significant differ-ences are primarily related to overall cognitive ability. This was further supported when statistically controlling for FSIQ resulted in non-significant differences in VMI performance. Both the Minshew et al. and the Williams et al. studies used male and female participants (12% females in both the autism and control group in the Minshew et al. investigation; 18% females in the autism group and 30% females in the control group in the Williams et al. study). Since potential differences in cognitive performance have been observed between males and females with ASD (Holtmann, Bölte, & Poustka, 2007; Zwaigenbaum et al.,2012), it is plausible that sample differences may have affected findings. In both the Minshew et al. and the Williams et al. studies, the samples were well matched on FSIQ, PIQ, and VIQ, and thus no significant differences between groups were found on these variables. In the current study, all subjects were male and matched on age, whereas IQ was free to vary for initial analyses and then restricted and matched to sample in post hoc analyses.
Differences in network functioning and neural organization have been associated with ASD (Nielsen et al., 2013; Zielinski et al., 2012) and specifically within motor circuits relevant to motor integration (Müller, Kleinhans, Kemmotsu, Pierce, & Courchesne, 2003); therefore, it was not unexpected that differences in between-group and within-between-group patterns in IQ–Beery-VMI performance would be present. Future studies linking VMI performance with neuroimaging variables and network analyses could potentially reveal other differences between ASD and TD groups. For example, several studies have demonstrated neuroimaging abnormalities in ASD involving the structural and functional relations of several brain regions likely critical for VMI performance. These include the corpus callosum (Alexander et al., 2007; Prigge et al., 2013), frontal-parietal dysconnectivity (Just, Keller, Malave, Kana, & Varma, 2012), atypical white matter microstructure development (Cheng et al., 2010; Wolff et al., 2012), cerebellar connectivity (Mostofsky et al., 2009), medial prefrontal cortical abnormalities (Gilbert et al., 2008) and a distributed specificity of cortical structural abnormalities including many of these implicated brain regions (Zielinski et al.,2012,2014). Investigating these regions with multimodal neuroimaging methods may yield additional insight into why VMI ability appears to be attenuated in at least a subset of individuals with ASD and whether this may reflect differences in white matter microstructure and/or abnormalities within motor and perceptual networks.
There are limitations to the current investigation. For example, the sample did not include females and so generalizability is limited. Additionally, although the role of visuomotor impairment in lower functioning ASD as a function of FSIQ and social
ratings was explored in a subset of ASD participants, the relationship between these variables needs to be more clearly understood. How to investigate the heterogeneity of cognitive phenotypes in ASD and deal with intellectual disparities between TD and ASD samples represents a major experimental design and statistical debate.
In summary, the findings of the current study suggest that VMI performance is attenuated in ASD at the group level compared to controls. However, this group difference was driven by a minority subset within the ASD group such that 79% of the participants with ASD had Beery VMI performance that was comparable to controls. The current study also suggests that visuomotor impairment found in ASD is not associated with overall level of autism symptom severity as measured with the SRS. Given that some level of visuomotor impairment was present in more than 20% of our sample, there is a need for further research to explore the clinical significance and neurobiological under-pinnings of visuomotor impairment in ASD. Moreover, future research may clarify whether these measures can be useful in ASD subset phenotyping and selection for therapeutic intervention.
Original manuscript received 12 May 2014 Revised manuscript accepted 9 May 2015 First published online 18 August 2015
REFERENCES
Alexander, A. L., Lee, J. E., Lazar, M., Boudos, R., DuBray, M. B., Oakes, T. R., & Lainhart, J. E. (2007). Diffusion tensor imaging of the corpus callosum in autism.NeuroImage,34, 61–73. doi:10.1016/j.neuroimage.2006.08.032
Allen, G., & Courchesne, E. (2003). Differential effects of developmental cerebellar abnormality on cognitive and motor functions in the cerebellum: An fMRI study of autism.American Journal of Psychiatry,160(2), 262–273. doi:10.1176/appi.ajp.160.2.262
Ament, K., Mejia, A., Buhlman, R., Erklin, S., Caffo, B., Mostofsky, S., & Wodka, E. (2014). Evidence for specificity of motor impairments in catching and balance in children with autism.
Journal of Autism and Developmental Disorders,45(3), 742–751.
American Psychiatric Association. (1994).Diagnostic and statistical manual of mental disorders
(4th ed.). Washington, DC: Author.
American Psychiatric Association. (2013).Diagnostic and statistical manual of mental disorders
(5th ed.). Arlington, VA: American Psychiatric Publishing.
Baron, I. S., Weiss, B. A., Baker, R., Khoury, A., Remsburg, I., Thermolice, J. W., . . . Ahronovich, M. D. (2014). Subtle adverse effects of late preterm birth: A cautionary note.Neuropsychology,
28(1), 11–18. doi:10.1037/neu0000018
Beery, K. E. (1989).Developmental test of visual motor integration: Administration, scoring, and teaching manual (3rdrev.). Cleveland, OH: Modern Curriculum Press.
Beery, K. E. (1996). The Beery-Buktenica developmental test of visual motor integration: Administration, scoring, and teaching manual(4th ed.). Cleveland, OH: Modern Curriculum Press.
Beery, K. E., & Beery, N. A. (2004). The Beery-Buktenica developmental test of visual motor integration: Administration, scoring, and teaching manual(5th ed.). Cleveland, OH: Modern Curriculum Press.
Bertone, A., Mottron, L., Jelenic, P., & Faubert, J. (2005). Enhanced and diminished visuo-spatial information processing in autism depends on stimulus complexity. Brain: A Journal of Neurology,128(10), 2430–2441. doi:10.1093/brain/awh561
Bigler, E. D., Tate, D. F., Neeley, E. S., Wolfson, L. J., Miller, M. J., Rice, S. A., & Lainhart, J. E. (2003). Temporal lobe, autism, and macrocephaly.American Journal of Neuroradiology,24, 2066–2076.
Bloch, M. H., Sukhodolsky, D. G., Dombrowski, P. A., Panza, K. E., Craiglow, B. G., Landeros-Weisenberger, A., & Schultz, R. T. (2011). Poor fine-motor and visuospatial skills predict persistence of pediatric-onset obsessive-compulsive disorder into adulthood.Journal of Child Psychology and Psychiatry,52(9), 974–983. doi:10.1111/j.1469-7610.2010.02366.x
Bolen, L. M. (2003). Constructing local age norms based on ability for the Bender-Gestalt test.
Perceptual and Motor Skills,97(2), 467–476. doi:10.2466/pms.2003.97.2.467
Braddick, O., & Atkinson, J. (2013). Visual control of manual actions: Brain mechanisms in typical development and developmental disorders.Developmental Medicine & Child Neurology,55, 13–18. doi:10.1111/dmcn.12300
Charman, T., Pickles, A., Simonoff, E., Chandler, S., Loucas, T., & Baird, G. (2011). IQ in children with autism spectrum disorders: Data from the Special Needs and Autism Project (SNAP).
Psychological Medicine,41(3), 619–627. doi:10.1017/S0033291710000991
Cheng, Y., Chou, K.-H., Chen, I. Y., Fan, Y.-T., Decety, J., & Lin, C.-P. (2010). Atypical develop-ment of white matter microstructure in adolescents with autism spectrum disorders.
NeuroImage,50(3), 873–882. doi:10.1016/j.neuroimage.2010.01.011
Chukoskie, L., Townsend, J., & Westerfield, M. (2013). Motor skill in autism spectrum disorders: A subcortical view. International Review of Neurobiology. doi: 10.1016/B978-0-12-418700-9.00007-1
Constantino, J. (2002).The social responsiveness scale. Los Angeles, CA: Western Psychological Services.
Constantino, J. N., Davis, S. A., Todd, R. D., Schindler, M. K., Gross, M. M., Brophy, S. L., . . . Reich, W. (2003). Validation of a brief quantitative measure of autistic traits: Comparison of the social responsiveness scale with the autism diagnostic interview-revised.Journal of Autism and Developmental Disorders,33(4), 427–433. doi:10.1023/A:1025014929212
Courchesne, E., Campbell, K., & Solso, S. (2011). Brain growth across the life span in autism: Age-specific changes in anatomical pathology. Brain Research, 1380, 138–145. doi:10.1016/j. brainres.2010.09.101
Dawson, G., & Watling, R. (2000). Interventions to facilitate auditory, visual, and motor integration in autism: A review of the evidence.Journal of Autism and Developmental Disorders,30(5), 415–421. doi:10.1023/a:1005547422749
Deary, I. J. (2012). Intelligence.Annual Review of Psychology,63, 453–482. doi: 10.1146/annurev-psych-120710-100353
Dennis, M., Francis, D. J., Cirino, P. T., Schachar, R., Barnes, M. A., & Fletcher, J. M. (2009). Why IQ is not a covariate in cognitive studies of neurodevelopmental disorders.Journal of the International Neuropsychological Society,15(3), 331–343. doi:10.1017/S1355617709090481
Dissanayake, C., Bui, Q., Bulhak-Paterson, D., Huggins, R., & Loesch, D. Z. (2009). Behavioural and cognitive phenotypes in idiopathic autism versus autism associated with fragile X syn-drome.The Journal of Child Psychology and Psychiatry,50(3), 290–299. doi: 10.1111/j.1469-7610.2008.01988.x
Dowd, A. M., McGinley, J. L., Taffe, J. R., & Rinehart, N. J. (2012). Do planning and visual integration difficulties underpin motor dysfunction in autism? A kinematic study of young children with autism. Journal of Autism and Developmental Disorders, 42(8), 1539–1548. doi:10.1007/s10803-011-1385-8
Duffield, T. C., Trontel, H. G., Bigler, E. D., Froehlich, A., Prigge, M. B., Travers, B., & Lainhart, J. (2013). Neuropsychological investigation of motor impairments in autism.Journal of Clinical and Experimental Neuropsychology. doi:10.1080/13803395.2013.827156
Elliott, C. D. (1990).Differential ability scales. San Antonio, TX: The Psychological Corporation. Emck, C., Bosscher, R., Beek, P., & Doreleijers, T. (2009). Gross motor performance and self-perceived motor competence in children with emotional, behavioural, and pervasive
developmental disorders: A review.Developmental Medicine & Child Neurology, 2009 Jul51
(7), 501–517.10.1111/j.1469-8749.2009.03337.x
Fournier, K. A., Hass, C. J., Naik, S. K., Lodha, N., & Cauraugh, J. H. (2010). Motor coordination in autism spectrum disorders: A synthesis and meta-analysis. Journal of Autism and Developmental Disorders,40(10), 1227–1240. doi:10.1007/s10803-010-0981-3
Fuentes, C. T., Mostofsky, S. H., & Bastian, A. J. (2010). Perceptual reasoning predicts handwriting impairments in adolescents with autism. Neurology, 75(20), 1825–1829. doi:10.1212/ WNL.0b013e3181fd633d
Fulkerson, S. C., & Freeman, W. M. (1980). Perceptual-motor deficiency in autistic children.
Perceptual and Motor Skills,50(1), 331–336. doi:10.2466/pms.1980.50.1.331
Geschwind, D. H. (2009). Advances in autism. Annual Review of Medicine, 60, 367–380. doi:10.1146/annurev.med.60.053107.121225
Gidley-Larson, J. C., & Mostofsky, S. H. (2008). Evidence that the pattern of visuomotor sequence learning is altered in children with autism.Autism Research,1(6), 341–353. doi:10.1002/aur.54
Gilbert, S. J., Meuwese, J. D. I., Towgood, K. J., Frith, C. D., & Burgess, P. W. (2008). Abnormal functional specialization within medial prefrontal cortex in high-functioning autism: A multi-voxel similarity analysis.Brain: A Journal of Neurology,132(4), 869–878. doi:10.1093/brain/ awn365
Hardan, A. Y., Kilpatrick, M., Keshavan, M. S., & Minshew, N. J. (2003). Motor Performance and Anatomic Magnetic Resonance Imaging (MRI) of the Basal Ganglia in Autism.Journal of Child Neurology,18(5), 317–324. doi:10.1177/08830738030180050801
Hilton, C. L., Zhang, Y., Whilte, M. R., Klohr, C. L., & Constantino, J. (2012). Motor impairment in sibling pairs concordant and discordant for autism spectrum disorders.Autism,16(4), 430–441. doi:10.1177/1362361311423018
Holtmann, M., Bölte, S., & Poustka, F. (2007). Autism spectrum disorders: Sex differences in autistic behaviour domains and coexisting psychopathology. Developmental Medicine and Child Neurology,49(5), 361–366. doi:10.1111/j.1469-8749.2007.00361.x
Howe, Y. J., Yatchmink, Y., Viscidi, E. W., & Morrow, E. M. (2014). Ascertainment and gender in autism spectrum disorders. Journal of the American Academy of Child and Adolescent Psychiatry,53(6), 698–700. doi:10.1016/j.jaac.2014.04.003
Idring, S., Rai, D., Dal, H., Dalman, C., Sturm, H., Zander, E., & Magnusson, C. (2012). Autism spectrum disorders in the Stockholm youth cohort: Design, prevalence and validity. Public Library of Science One. doi:10.1371/journal.pone.0041280
Johnson, B. P., Phillips, J. G., Papadopoulos, N., Fielding, J., Tonge, B., & Rinehart, N. J. (2013). Understanding macrographia in children with autism spectrum disorders. Research in Developmental Disabilities,34(9), 2917–2926. doi:10.1016/j.ridd.2013.06.003
Jones, D., & Christensen, C. (1999). Relationship between automaticity in handwriting and students’
ability to generate written text.Journal of Educational Psychology,91(1), 44–49. doi:10.1037/ 0022-0663.91.1.44
Just, M. A., Keller, T. A., Malave, V. L., Kana, R. K., & Varma, S. (2012). Autism as a neural systems disorder: A theory of frontal-posterior underconnectivity. Neuroscience and Biobehavioral Reviews,36(4), 1292–1313. doi:10.1016/j.neubiorev.2012.02.007
Keary, C. J., Minshew, N. J., Bansal, R., Goradia, D., Fedorov, S., Keshavan, M. S., & Hardan, A. Y. (2009). Corpus callosum volume and neurocognition in autism. Journal of Autism and Developmental Disorders,39(6), 834–841. doi:10.1007/s10803-009-0689-4
Korkman, M., Kirk, U., & Kemp, S. L. (2008).NEPSY-II: Lasten neuropsykologinen tutkimus– second edition. Helsinki: Psykologien Kustannus.
Kushki, A., Chau, T., & Anagnostou, E. (2011). Handwriting difficulties in children with autism spectrum disorders: A scoping review.Journal of Autism and Developmental Disorders,41
(12), 1717. doi:10.1007/s10803-011-1335-5
Lange, N., Travers, B. G., Bigler, E. D., Prigge, M. B., Froehlich, A. L., Nielsen, J. A., & Lainhart, J. E. (2014). Longitudinal volumetric brain changes in autism spectrum disorder ages 6-35 years.Autism Research. doi:10.1002/aur.1427
Lee, P. S., Foss-Feig, J., Henderson, J. G., Kenworthy, L. E., Gilotty, L., Gaillard, W. D., & Vaidya, C. J. (2007). Atypical neural substrates of Embedded Figures Task performance in children with autism spectrum disorder. Neuroimage, 38(1), 184–193. doi:10.1016/j. neuroimage.2007.07.013
Lezak, M. D., Howieson, D. B., Bigler, E. D., & Tranel, D. (2012).Neuropsychological assessment
(5th ed.). New York, NY: Oxford University Press.
Libertus, K., Sheperd, K. A., Ross, S. W., & Landa, R. J. (2014). Limited fine motor and grasping skills in 6-month-old infants at risk for autism. Child Development, 85(6), 2218–2231. doi:10.1111/cdev.12262
Lord, C., Risi, S., Lambrecht, L., Cook, E. H. J., Leventhal, B. L., DiLavore, P. C., & Rutter, M. (2000). The Autism Diagnostic Observation Schedule-Generic (ADOS-G): A standard measure of social and communication deficits associated with the spectrum of autism.Journal of Autism and Developmental Disorders,30, 205–223. doi:10.1023/A:1005592401947
Lord, C., Rutter, M., & LeCouteur, A. (1994). Autism Diagnostic Interview-Revised (ADI–R): A revised version of a diagnostic interview for caregivers of individuals with possible pervasive developmental disorders. Journal of Autism and Developmental Disorders, 24, 659–685. doi:10.1007/BF02172145
Lubans, D. R., Morgan, P. J., Cliff, D. P., Barnett, L. M., & Okely, A. D. (2010). Fundamental movement skills in children and adolescents: Review of associated health benefits. Sports Medicine,40(12), 1019–1035. doi:10.2165/11536850-000000000-00000
MacDonald, M., Lord, C., & Ulrich, D. A. (2014). Motor skills and calibrated autism severity in young children with autism spectrum disorder.Adapted Physical Activity Quarterly,31(2), 95– 105. doi:10.1123/apaq.2013-0068
Malisza, K. L., Clancy, C., Shiloff, D., Foreman, D., Holden, J., Jones, C., . . . Chudley, A. E. (2011). Functional evaluation of hidden figures object analysis in children with autistic disorder. Journal of Autism and Developmental Disorders, 41(1), 13–22. doi:10.1007/ s10803-010-1013-z
Manjaly, Z. M., Bruning, N., Neufang, S., Stephan, K. E., Brieber, S., Marshall, J. C., . . . Fink, G. R. (2007). Neurophysiological correlates of relatively enhanced local visual search in autistic adolescents.Neuroimage,35(1), 283–291. doi:10.1016/j.neuroimage.2006.11.036
Margolis, A., Bansal, R., Hao, X., Algermissen, M., Erickson, C., Klahr, K. W., & Peterson, B. S. (2013). Using IQ discrepancy scores to examine the neural correlates of specific cognitive abilities.The Journal of Neuroscience,33(35), 14135–14145. doi: 10.1523/JNEUROSCI.0775-13.2013
Mayes, S., & Calhoun, S. (2003). Ability profiles in children with autism: Influence of age and IQ.
Autism,7(1), 65–80. doi:10.1177/1362361303007001006
Mayes, S., & Calhoun, S. (2007). Learning, attention, writing, and processing speed in typical children and children with ADHD, autism, anxiety, depression, and oppositional-defiant dis-order.Child Neuropsychology (Neuropsychology, Development and Cognition: Section C),13
(6), 469–493. doi:10.1080/09297040601112773
McPhillips, M., Finlay, J., Bejerot, S., & Hanley, M. (2014). Motor deficits in children with autism spectrum disorder: A cross-syndrome study. Autism Research, 7(6), 664–676. doi:10.1002/ aur.2014.7.issue-6
Minshew, N. J., Goldstein, G., & Siegel, D. J. (1997). Neuropsychologic functioning in autism: Profile of a complex information processing disorder. Journal of the International Neuropsychological Society,3(4), 303–316.
Minshew, N. J., & Hobson, J. A. (2008). Sensory sensitivities and performance on sensory perceptual tasks in high-functioning individuals with autism. Journal of Autism and Developmental Disorders,38(8), 1485–1498. doi:10.1007/s10803-007-0528-4
Mostofsky, S. H., Powell, S. K., Simmonds, D. J., Goldberg, M. C., Caffo, B., & Pekar, J. J. (2009). Decreased connectivity and cerebellar activity in autism during motor task performance.Brain,
132(9), 2413–2425. doi:10.1093/brain/awp088
Müller, R. A., Kleinhans, N., Kemmotsu, N., Pierce, K., & Courchesne, E. (2003). Abnormal variability and distribution of functional maps in autism: An FMRI study of visuomotor learning. American Journal of Psychiatry, 160(10), 1847–1862. doi:10.1176/appi. ajp.160.10.1847
Narzisi, A., Muratori, F., Calderoni, S., Fabbro, F., & Urgesi, C. (2013). Neuropsychological profile in high functioning autism spectrum disorders. Journal of Autism and Developmental Disorders,43(8), 1895–1909. doi:10.1007/s10803-012-1736-0
Nebel, M. B., Eloyan, A., Barber, A. D., & Mostofsky, S. H. (2014). Precentral gyrus functional connectivity signatures of autism. Frontiers in Systems Neuroscience, 14, 8. doi:10.3389/ fnsys.2014.00080
Nielsen, J. A., Zielinski, B. A., Fletcher, P. T., Alexander, A. L., Lange, N., Bigler, E. D., . . . Anderson, J. S. (2013). Multisite functional connectivity MRI classification of autism: ABIDE results.Frontiers in Human Neuroscience,25(7), 599. doi:10.3389/fnhum.2013.00599
Occelli, V., Esposito, G., Venuti, P., Arduino, G. M., & Zampini, M. (2013). Attentional shifts between audition and vision in autism spectrum disorders. Research in Autism Spectrum Disorders,7(4), 517–525. doi:10.1016/j.rasd.2012.12.003
O’Halloran, C. J., Kinsella, G. J., & Storey, E. (2012). The cerebellum and neuropsychological functioning: A critical review.Journal of Clinical and Experimental Neuropsychology,34(1), 35–56. doi:10.1080/13803395.2011.614599
Oldfield, R. C. (1971). The assessment and analysis of handedness: The Edinburgh inventory.
Neuropsychologia,9, 97–113. doi:10.1016/0028-3932(71)90067-4
O’Riordan, M., & Passetti, F. (2006). Discrimination in autism within different sensory modalities.
Journal of Autism and Developmental Disorders, 36(5), 665–675. doi: 10.1007/s10803-006-0106-1
Polšek, D., Jagatic, T., Cepanec, M., Hof, P., & Šimić, G. (2011). Recent developments in neuropathology of autism spectrum disorders. Translational Neuroscience, 2, 256–264. doi:10.2478/s13380-011-0024-3
Prigge, M. B., Lange, N., Bigler, E. D., Merkley, T. L., Neeley, E. S., Abildskov, T. J., & Lainhart, J. E. (2013). Corpus Callosum Area in Children and Adults with Autism. Research in Autism Spectrum Disorders,7(2), 221–234. doi:10.1016/j.rasd.2012.09.007
Reiersen, A. M., Constantino, J. N., & Todd, R. D. (2008). Co-occurrence of motor problems and autistic symptoms in attention-deficit/hyperactivity disorder. Journal of the American Academy of Child and Adolescent Psychiatry, 47(6), 662–672. doi:10.1097/ CHI.0b013e31816bff88
Reinvall, O., Voutilainen, A., Kujala, T., & Korkman, M. (2013). Neurocognitive functioning in adolescents with autism spectrum disorder.Journal of Autism and Developmental Disorders,
43(6), 1367–1379. doi:10.1007/s10803-012-1692-8
Ring, H. A., Baron-Cohen, S., Wheelwright, S., Williams, S. C., Brammer, M., Andrew, C., & Bullmore, E. T. (1999). Cerebral correlates of preserved cognitive skills in autism: A functional MRI study of embedded figures task performance.Brain,122, 1305–1315. doi:10.1093/brain/ 122.7.1305
Rogers, T. D., McKimm, E., Dickson, P. E., Goldowitz, D., Blaha, C. D., & Mittleman, G. (2013). Is autism a disease of the cerebellum? An integration of clinical and pre-clinical research.
Frontiers in Systems Neuroscience. doi:10.3389/fnsys.2013.00015
Samson, A. C., Huber, O., & Ruch, W. J. (2011). Teasing, ridiculing and the relation to the fear of being laughed at in individuals with Asperger’s syndrome. Journal of Autism and Developmental Disorder,41(4), 475–483. doi:10.1007/s10803-010-1071-2
Sigmundsson, H. (2005). Disorders of motor development (clumsy child syndrome). Journal of Neural Transmission,69(Suppl.), 51–68.
Silk, T. J., Rinehart, N., Bradshaw, J. L., Tonge, B., Egan, G., O’Boyle, M. W., & Cunnington, R. (2006). Visuospatial processing and the function of prefrontal-parietal networks in autism spectrum disorders: A functional MRI study.American Journal of Psychiatry,163(8), 1440–
1443. doi:10.1176/ajp.2006.163.8.1440
Simmons, D. R., Robertson, A. E., McKay, L. S., Toal, E., McAleer, P., & Pollick, F. E. (2009). Vision in autism spectrum disorders. Vision Research, 49(22), 2705–2739. doi:10.1016/j. visres.2009.08.005
Soper, H. V., Wolfson, S., & Canavan, F. (2007). Neuropsychology of autism spectrum disorders. In A. Horton & D. Wedding (Eds.),The neuropsychology handbook(3rd ed., pp. 681–703). New York, NY: Springer Publishing Company.
Southwick, J. S., Bigler, E. D., Froehlich, A., DuBray, M. B., Alexander, A. L., Lange, N., & Lainhart, J. E. (2011). Memory functioning in children and adolescents with autism.
Neuropsychology,25(6), 702–710. doi:10.1037/a0024935
Stevenson, R. A., Siemann, J. K., Schneider, B. C., Eberly, H. E., Woynaroski, T. G., Camarata, S. M., & Wallace, M. T. (2014). Multisensory temporal integration in autism spectrum disorders.
Journal of Neuroscience,34(3), 691–697. doi:10.1523/JNEUROSCI.3615-13.2014
Strauss, E., Sherman, E. S., & Spreen, O. (2006). A compendium of neuropsychological tests: Administration, norms, and commentary(3rd ed.). New York, NY: Oxford University Press. Sutton, G. P., Barchard, K. A., Bello, D. T., Thaler, N. S., Ringdahl, E., Mayfield, J., & Allen, D. N.
(2011). Beery-buktenica developmental test of visual-motor integration performance in children with traumatic brain injury and attention-deficit/hyperactivity disorder. Psychological Assessment,23(3), 805–809. doi:10.1037/a0023370
Tager-Flusberg, H. (2004). Strategies for conducting research on language in autism.Journal of Autism and Developmental Disorders, 34(1), 75–80. doi:10.1023/B: JADD.0000018077.64617.5a
Takarae, Y., Luna, B., Minshew, N. J., & Sweeney, J. A. (2008). Patterns of visual sensory and sensorimotor abnormalities in autism vary in relation to history of early language delay.
Journal of the International Neuropsychological Society, 14(6), 980–989. doi:10.1017/ s1355617708081277
Takarae, Y., Minshew, N. J., Luna, B., & Sweeney, J. A. (2007). Atypical involvement of frontos-triatal systems during sensorimotor control in autism.Psychiatry Research: Neuroimaging,156
(2), 117–127. doi:10.1016/j.pscychresns.2007.03.008
Thomas, M. S., Davis, R., Karmiloff-Smith, A., Knowland, V. C., & Charman, T. (2015). The over-prunning hypothesis of autism.Developmental Science, In press. doi:10.1111/desc.12303
Travers, B. G., Bigler, E. D., Tromp do, P. M., Adluru, N., Froehlich, A. L., Ennis, C., & Lainhart, J. E. (2014). Longitudinal processing speed impairments in males with autism and the effects of white matter microstructure. Neuropsychologia, 53, 137–145. doi:10.1016/j. neuropsychologia.2013.11.008
Tseng, M., & Cermak, S. (1993). The influence of ergonomic factors and perceptual-motor abilities on handwriting performance. American Journal of Occupational Therapy, 47(10), 919–926. doi:10.5014/ajot.47.10.919
Wechsler, D. (1991). Wechsler Intelligence Scale for Children(3rd ed.). San Antonio, TX: The Psychological Corporation.
Wechsler, D. (1997). Wechsler Adult Intelligence Scale (3rd ed.). San Antonia, TX: The Psychological Corporation.
Wechsler, D. (2003). Wechsler Intelligence Scale for Children (4th ed.). San Antonio, TX: The Psychological Corporation.
Williams, D. L., Goldstein, G., & Minshew, N. J. (2006). Neuropsychologic functioning in children with autism: Further evidence for disordered complex information-processing. Child Neuropsychology,12(4–5), 279–298. doi:10.1080/09297040600681190
Wilson, C. E., Happé, F., Wheelwright, S. J., Ecker, C., Lombardo, M. V., Johnston, P., & Murphy, D. G. (2014). The neuropsychology of male adults with high-functioning autism or Asperger syndrome.Autism Research,7(5), 568–581. doi:10.1002/aur.1394
Wolff, J. J., Gu, H., Gerig, G., Elison, J. T., Styner, M., Gouttard, S., & Piven, J. (2012). Differences in white matter fiber tract development present from 6 to 24 months in infants with autism.The American Journal of Psychiatry,169(6), 589–600. doi:10.1176/appi.ajp.2011.11091447
Wolynski, B., Schott, B. H., Kanowski, M., & Hoffmann, M. B. (2009). Visuo-motor integration in humans: Cortical patterns of response lateralisation and functional connectivity.
Neuropsychologia,47(5), 1313–1322. doi:10.1016/j.neuropsychologia.2009.01.027
Zielinski, B. A., Anderson, J. S., Froehlich, A. L., Prigge, M. B., Nielsen, J. A., Cooperrider, J., & Lainhart, J. E. (2012). scMRI reveals large-scale brain network abnormalities in autism.PLoS One,7(11). doi:10.1371/journal.pone.0049172
Zielinski, B. A., Prigge, M. B., Nielsen, J. A., Froehlich, A. L., Abildskov, T. J., Anderson, J. S., & Lainhart, J. E. (2014). Longitudinal changes in cortical thickness in autism and typical development.Brain,137, 1799–1812. Epub 2014 Apr 22. doi:10.1093/brain/awu083
Zwaigenbaum, L., Bryson, S. E., Szatmari, P., Brian, J., Smith, I. M., Roberts, W., . . . Roncadin, C. (2012). Sex differences in children with autism spectrum disorder identified within a high-risk infant cohort. The Journal of Autism and Developmental Disorders, 42(12), 2585–2596. doi:10.1007/s10803-012-1515-y