ANALYSIS OF CLIMATE AND POPULATION DYNAMICS OF
WHITE STEM BORER
SCIRPOPHAGA INNOTATA
(WALKER)
IN SUMBAWA REGENCY
HIJJAZ SUTRIADI
DEPARTMENT OF GEOPHYSICS AND METEOROLOGY FACULTY OF MATHEMATICS AND NATURAL SCIENCES
BOGOR AGRICULTURAL UNIVERSITY BOGOR
STATEMENT OF SOURCES AND COPY RIGHT TRASNFER
AGREEMENT
Hereby I state that this scientific writing titled Analysis of Climate and Population Dynamics of White Stem Borer Scirpopagha innotata (Walker) in Sumbawa Regency is truly my own work under guidance by the due supervisor and never been published in any higher education institution. The sources originating from published and unpublished works are appropriately cited and listed in References.
I hereby transfer the copyright of this scientific writing to Bogor Agricultural University.
ABSTRACT
HIJJAZ SUTRIADI. Analysis of Climate and Population Dynamics of White Stem Borer Scirpopagha innotata (Walker) in Sumbawa Regency. Supervised by YONNY KOESMARYONO.
Preliminary selection is conducted in order to choose which pest that will be presented in this research. Four consecutive years from 2009 to 2012 is selected as time range to measure rice harvest losses due to infectious pest outbreak. The white stem borer (Scirpophaga innotata) has been one of major pests that cause farmer worries over years in Sumbawa Regency. The climate dynamics as hypothesized one of important factors to drive pest development is the underlying to be concerned. Australia CSIRO’s DYMEX agroclimatic software is employed in constructing a pest dynamics model provided with biological cycle (egg, larva, pupa and adult) with approach using quantitative climate parameter. Therefore, the output will be subject for analysis of white stem borer dynamic population in the regency from 2009 to September 2012. The result shows that fluctuating involved climate parameters give influence on white stem borer development at every stage. Meanwhile heat and cold stress, humid stress, and washing, simultaneously act as limiting factor for each life stage development. Larva stage as deemed the most perilous stage causing rice plant damage, lives within considerably suitable range of temperature (23.8ºC – 31.6ºC), relative humidity (65% - 77%), rainfall (0 mm – 30 mm), thus Sumbawa climate circumstance comforts the pest development. Meanwhile, most intensifying larva infestation occurs on February 2010, September 2011, and September 2012 respectively.
Undergraduate Thesis
as one of requirements to obtain Bachelor of Science degree from the Department of Geophysics and Meteorology
ANALYSIS OF CLIMATE AND POPULATION DYNAMICS OF
WHITE STEM BORER
SCIRPOPHAGA INNOTATA
(WALKER)
IN SUMBAWA REGENCY
HIJJAZ SUTRIADI
DEPARTMENT OF GEOPHYSICS AND METEOROLOGY FACULTY OF MATHEMATICS AND NATURAL SCIENCES
BOGOR AGRICULTURAL UNIVERSITY BOGOR
Title : Analysis of Climate and Population Dynamics of White Stem Borer Scirpopagha innotata (Walker) in Sumbawa Regency
Name : Hijjaz Sutriadi
ID : G24090004
Approved by
Prof. Yonny Koesmaryono Research Supervisor
Approved by
Dr. Tania June
Head of Department of Geophysics and Meteorology
PREFACE
This research presents climate impact toward population dynamics of selected pest in Sumbawa Regency. It shows that how living organism and intangible atmospheric condition in particular is closely related. I am very delighted as this work has come to end yet it does not fully mean ceasing my curiosity about this study. Thus, possibility of conducting advanced research in the future is still present.
This accomplishment has brought me to another series of my timeline, at the pausing point of study period after my undergraduate education with ample guidance walking along. Thus I would like to thank those who have contributed to my research and study by assisting me a lot. For the foremost I name my parents at the peak of my gratitude, joined by my study and research supervisor, Prof. Yonny Koesmaryono, lecturers in the Department of Geophysics and Meteorology, and lecturers in IPB who have guided my path. I also thank to related institution in my hometown, Sumbawa Regency, namely BAPPEDA (Bureau of Regional Planning and Development), BPS (Central Bureau of Statistics), and Department of Agriculture for providing me the data. I surely do not forget to mention the family members and beloved friends for always supporting me and for helping me to get rid out of boredom.
CONTENTS
ABSTRACT ... ii
PREFACE ... v
CONTENTS ... vi
TABLE ... viii
FIGURES ... viii
LIST OF APPENDIX ... ix
INTRODUCTION ... 1
Background ... 1
Objective ... 1
LITERATURE REVIEW ... 2
White Stem Borer Ecological Distribution ... 2
Morphology and Lifecycle ... 2
Egg ... 2
Larva... 3
Pupa ... 3
Adult (Imago) ... 3
DYMEX™ Software ... 4
DYMEX™ Builder and Simulator ... 4
METHOD ... 5
Time and Places ... 5
Tools ... 5
Materials ... 5
Procedure ... 5
Model Building ... 5
Model Simulating ... 8
RESULTS AND DISCUSSION ... 11
Topography and Climate Condition of Sumbawa Regency ... 11
Model Limitation and Considered Assumption ... 13
White Stem Borer Life Stage Development and Mortality ... 14
Life Stage Population Production ... 15
Life Stage Population Mortality ... 18
Temperature ... 19
Relative Humidity ... 21
Rainfall... 23
Larva Population Distribution on Climate Parameters ... 25
CONCLUSION AND SUGGESTION ... 27
Conclusion ... 27
Suggestion ... 27
REFERENCES ... 27
APPENDICES ... 30
TABLE
Table 1 Slope of development, developmental zero and maximum temperature of Scirpopagha innotata (white stem borer) in laboratory condition ... 7 Table 2 Functions and variables of production and mortality ... 8 Table 3 Stage initialization and development trigger ... 9 Table 4 Quartile, median, mode and mean of climate parameter and
larva population ... 26
FIGURES
Figure 1 White stem borer lifecycle ... 3 Figure 2 Life cycle model as appears on DYMEX™ Builder 3.0 ... 4 Figure 3 Model flowchart ... 10 Figure 4 Thematic map of Sumbawa Regency after image processing
acquired from LANDSAT 7 ETM+ ... 11 Figure 5 Climate circumstance in Sumbawa Regency from January
2009 – September 2012. Panel 1: rainfall; panel 2: maximum temperature (—) and minimum temperature (—); panel 3: maximum relative humidity (—) and minimum relative humidity (—)... 12 Figure 6 Pests and diseases affecting rice field in Sumbawa Regency ... 14 Figure 7 White stem borer productions at various stages from January
2009 – September 2012 in Sumbawa Regency. Panel 1: egg production; panel 2: larva production; panel 3: pupa production; panel 4: adult (imago) production ... 16 Figure 8 White stem borer mortalities at various stages from 2009 –
September 2012 in Sumbawa Regency. Panel 1: stage mortality at phase I; panel 2: stage mortality at phase II; panel 3: stage mortality at phase III ... 18 Figure 9 Temperature trend on each life stage of white stem borer
production pattern ... 20 Figure 10 Relative humidity trends on each life stage of white stem
borer production pattern ... 22 Figure 11 Rainfall impact on soil moisture index ... 23 Figure 12 Rainfall occurrences on each life stage of white stem borer
LIST OF APPENDIX
Appendix 1 Pest and disease that infected rice field area in Sumbawa
Regency from 2009-2012 31
Appendix 2 Average monthly minimum temperature, maximum temperature, maximum relative humidity, minimum relative humidity, and monthly rainfall in Sumbawa
INTRODUCTION
Background
Preliminary selection is conducted in order to define which pest that be presented in this research. Four consecutive years of observation started from 2009 to 2012 conducted by Department of Agriculture in Sumbawa has been done and later has decided to select white stem borer (Scirpophaga innotata) the pest to be discussed. This finding is based on severity quantity of affected rice field area which was collected from the level of sub-district. The white stem borer is the second most perilous pest after rice bug that causes notable harvesting loss. Basic statistic calculation in order to measure total loss is exercised. It results that white stem borer excels other infectious pests (caseworm, golden apple snail, armyworm and rat) and plant diseases (xoo, tungro and blast).
Sumbawa Regency chosen as study case area lies on west of Sumbawa island in West Nusa Tenggara Province with half of population at working age is farmer, particularly to cultivate rice field. Affected area due to white stem borer in 2011 as released by Department of Agriculture in Sumbawa is 361.5 ha which accounts 0.45% out of 79,270 ha cumulative successful harvesting area (BPS 2012). Failure on rice harvesting due to pests and diseases has paid more serious attention since agricultural activity chiefly contributes to the society income.
The presence of white stem borer having been one of major causes of farmer worries for years unfortunately still exists. This research attempts to intertwine climate dynamics and white stem borer (Scirpophaga innonata) proliferation. The insect development would be important concern as it deals with climate circumstance. This lead has profoundly suggested that conducting deep studies under field of agricultural meteorology is fairly necessary. In this research, Australia CSIRO’s DYMEX is used in order to help figuring out the relationship between climate circumstance and the selected pest proliferation in timely basis.
Objective
2
LITERATURE REVIEW
White Stem Borer Ecological Distribution
The presence of pest in ecological life is inevitable although it causes damage to certain crops. Its existence seems more likely very dynamics as it is highly influenced by environmental circumstance. In South East Asia where rice is predominantly most planted, losses in harvest due to pest proliferation still prevails. This damage is triggered by suitable environment of the region that comforts pest development.
The white stem borer Scirpopagha innotata (Walker) has been long standing known as one of major rice pests. Geographically it is mostly distributed in Indonesia, Philippines, Malaysia and Australia (IRRI 2009). The extent of white stem borer distribution covers countries such as Papua New Guinea, Pakistan, Taiwan, Thailand and Vietnam. These countries range between belt of tropic of capricorn and tropic of cancer. Although the most severe impact occurs in Indonesia and Northern Territory of Australia (Li 1991)
The damage due to white stem borer has been recorded in previous conducts. In Indonesia, it is found that white stem borer attacks rice in major irrigated rice field area in some districts in West Java such as Bekasi, Karawang, Subang, Indramayu and some parts of Cirebon (Rubia et al 1997). The stem borer has also been found out that exists in India causing losses in grain production (Muralidharan and Pasalu 2006). In Sumbawa, within four years, from 2009 to 2012 the presence of white stem borer has been recorded that accounts rice harvest failure area of 1063.3 ha. However, other factor that triggers its development is still under study.
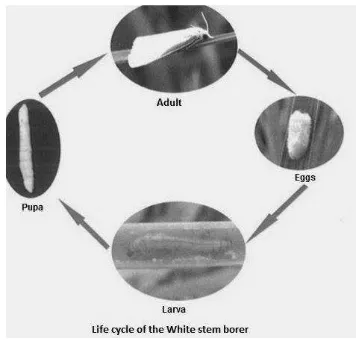
Morphology and Lifecycle
White stem borer, locally known as sundep is typically endemic species that survives to live in range between coastal area and interior of the island at 200 m above sea level with rainfall less than 200 mm (Kartasapoetra 1993). This species was first time introduced by Walker as it was found in Sarawak, East Malaysia. The lifecycle itself is mainly divided into four stages, such as egg, larva, pupa and lastly adult. Under tropical climate circumstance, it could be more possible for white stem borer to live all year long, ignoring the combating effort intervened by human and other extreme major factor.
Egg
3 Larva
Larva period of white stem borer is started when egg has hatched. Larva hangs on cilia that previously covers egg. The wind factor can drive the distribution of larva to reach bud of other rice plant. Later it lurks into deeper stem then starts to damage the midrib. It takes around 22 days for larva to accomplish its period, including diapauses. Morphologically larva of white stem borer has length of 21 mm with yellowish white color (IRRI 1986). Larva can survive at minimum temperature of 8.7ºC (Rachman and Khalequzzaman 2004).
The stage of larva is believed the most crucial metamorphosis. Rubia et al (1998) studied the factor based on analysis of cultivar response on development stage of the white stem borer. It has found that the larva stage predominantly contributes the most severe cause to injure rice plant development.
Pupa
Pupa takes place in white cocoon in the lower internode of the plant (Li 1991). Pupa stage takes around 11 days to accomplish the metamorphosis before it transforms into imago or adult white stem borer (IRRI 1986). During this cycle, temperature of 5.9ºC is considered zero development in which at given point the development ceases to evolve (Rachman and Khalequzzaman 2004). Pupa is mostly found around lower stem.
Adult (Imago)
The adults are nocturnal, phototrophic and strong fliers. The mean fecundity is 142 or 160 eggs with sex ratio 1.0 males/2.3 females (van der Goot 1925 in Li 1991). Adult happens to lay down eggs in the night at 19.00 – 22.00 in cohorts. It flies as long as 6 – 10 km in normal condition and can reach further miles away whenever it is driven by wind force. Other factors that also contribute to imago migration are such as sunlight, rainfall and temperature (IRRI 1986). Adult is still able to survive at minimum temperature of 10ºC (Rachman and Khalequzzaman 2004) and lives lasting for 9 days (IRRI 1986).
4
DYMEX™ Software
DYMEX™ is invented and developed by Hearne Scientific Software that consists of two main parts, Builder and Simulator (Maywald et al 2007). DYMEX is platform based software that enables developer to build their own model. The use of DYMEX has increasingly become popular among scientists who focus on cohort based model. It deals with plant and insect development in association with climate circumstance in order to figure out the dynamics and forecasting living organism growth. DYMEX Builder is platform where user can design the parameter to be involved in model. Meanwhile DYMEX Simulator acts to run the model and is as well to display the results either in graph or in table format. DYMEX™ Builder and Simulator
Model building is a basic conduct in constructing the model by designing components to be involved. DYMEX Builder comprises of components that deal with climate parameter items stored in the library known as MetBase. Basically there are three components of conducts when ones use the DYMEX Builder, such as module, function and process (Maywald, Kriticos, Sutherst and Bottomley 2007).
Module in builder is presumed as component that provides interconnected input. This input enable user to select desired parameter. The selection of input can vary from one modeler to the other, depending on purpose and level of importance. Function in model is an important factor which is responsible to the quantity of output. The function in this discuss is somewhat from mathematical derive applied to the model itself. Meanwhile process in builder is an order of given modules in which modeler arrange the formation of conduct.
5
METHOD
Time and Places
This research is conducted in two separated phases. The first phase is data collecting which was done from January to February 2013 in Sumbawa Regency. The second phase is model building and simulating and data analyzing at the Department of Geophysics and Meteorology, IPB in Bogor.
Tools
The main tools utilized in this research are CSIRO DYMEX™ Builder and Simulator version 3.0 and Microsoft Excel 2010 software.
Materials
In this research, materials presented are those data which were collected from various sources. In time order, data of pest that infected paddy field area was the first time acquired which was provided by Department of Agriculture, Sumbawa. Later administrative data (demography and agriculture) of Sumbawa Regency was collected from Central Bureau of Statistics (BPS) and Bureau of Regional Planning and Development (BAPPEDA). Meanwhile climate data of the region was acquired from Tutiempo.net, a worldwide website climate database that provides exchange data similar to NCDC-NOAA-USA originating from World Meteorology Organization (WMO) in which BMKG (Bureau of Meteorology, Climatology and Geophysics) is one of the members. Climate data from Sumbawa station is recorded at station number 972600 (WRRS) with Meteorological Data, Latitude, Daylength, Evaporation, Soil Moisture, Average Daily Temperature, Daily Temperature Cycle, Species (White Stem Borer).
Timer
6
The time set for this model is January 2009 as the starting day and September 2012 as the last running time. The selected length of time indicates period of white stem borer analysis in the region.
Meteorological Data
There are five types of the most significant meteorological parameter considered in this model, including minimum temperature (Tmin), maximum
temperature (Tmax), rainfall (R), 9am relative humidity (RHmax) and 3pm relative
humidity (RHmin). The use of these parameters is common as previous CSIRO’s
CLIMEX recommends the similar item. Barney and DiTomoso (2010) in bioclimatic prediction exercised the model by emphasizing the use of temperature and moisture. Similar conduct is also done by Yonow, Hattingh and de Villiers (2013) in modeling plant disease distribution by climatic factor. Simulation date is chosen as input that derives from timer module.
Latitude
The latitude module is involved as it deals with climatic zone. The geographical position can consider living factor. The latitude is set based on Sumbawa weather station proximity with code 972600 (WRRS) and situating at 8°43 south. It indicates that Sumbawa is located within tropical layer that regards to almost constant day length in whole year.
Day Length
As module is designed interconnected, the day length module is thus derived from preceding modules. The latitude module and day of year from timer module are chosen as input, which is part of climate zoning. Day length is timely parameter measured in hour and calculated from sunrise to sunset.
Evaporation
Evaporation module is actually thus formed based on Class A Pan Evaporation measurement using Fitzpatrick method which emphasizes the use data of maximum mean temperature and vapor pressure (Fitzpatrick 1963). The use of this method is more considerable since the evidence of practice in the case of northern Australia as recommended by Fitzpatrick is effectively for estimating evaporation, in which the climate condition is more similar to that of Sumbawa. In this model, input for evaporation is derived from Tmax, Tmin, RHmax, RHmin, and
day length module. Soil Moisture
Soil moisture, as its role upon plant living factor, is considerably relevant to affect white stem borer development in which life stages presence highly depends on plant livelihood. Soil moisture module is composed of evaporation module and rainfall with additional limit factors of soil moisture capacity, evapotranspiration coefficient and basal evaporation.
Average Daily Temperature
7
Daily Temperature Cycle
This module consists of three inputs such as Tmin, Tmax, and day length
module. Daily temperature cycle, on the aftermath, will chiefly contribute to each life stage development as it acts as temperature limit. This module is associated with daily cycle of selected pest which turns out its output itself.
Lifecycle
Lifecycle module is chained stage of selected species. Lifecycle module is designed to record history of species development with adjustable features. Life cycle module in this model is one designed to consist of four prominent parts which turn out the pest life stages themselves such as egg, larva, pupa and imago (adult) respectively. To construct life stage model, it is necessary to define the variables and to give quantitative value to those chosen variables based on experimental practice. The following table contains variables used in the model. Table 1 Slope of development, developmental zero and maximum temperature of
Scirpopagha innotata (white stem borer) in laboratory condition Life
The slope in the table is actually rate of development (DR), closely linked to degree-day (DD) which turns out energy required by pest at every stage to develop. In order to calculate the slope, an equation proposed by Nahrung et al (2004) and Vojtěch et al (2004) is employed as follows
where DR is slope of linear regression or known as b in, y = bx + a, Topt is
8
stage. It is highly influential in forming the rate curve that involves in physiological age (Taylor 1981).
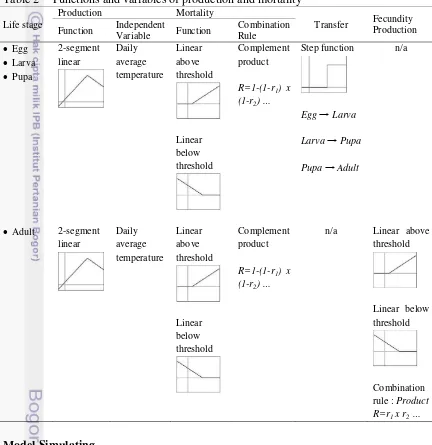
Furthermore, each stage of white stem borer in DYMEX Builder construction is featured with some adjustable components that build up life stage sub-model. The features are presented in detail based upon life stage order as in the following table.
Table 2 Functions and variables of production and mortality
Life stage
Working with DYMEX requires adjustment in data preparation in order to fit the placement. The data used in this model is prepared in *.csv format which consists of climate parameters such as date, minimum temperature (Tmin),
9 and minimum relative humidity (RHmin). The executed data starts from 1 January
2009 until 30 September 2013. Model Running
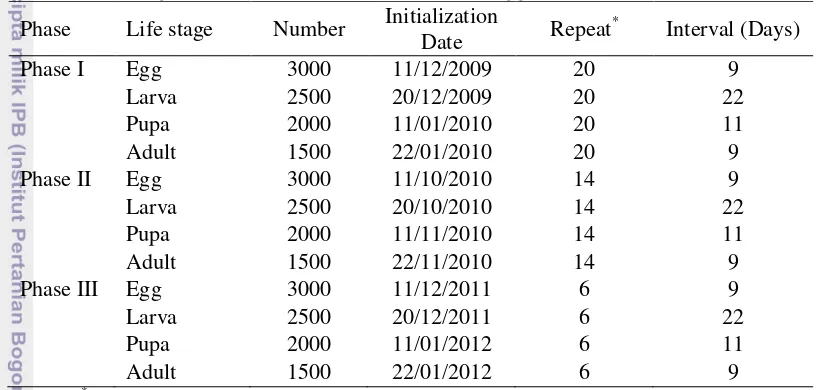
Before running the model, Latitude component should be set -8.43 based on reference of Sumbawa weather station coordinate. The negative figure indicates location of station lying on southern hemisphere. Number of initial population is also necessary to be given in advance. For this purpose, every stage is valued with initial population and is run based on farmer’s planting time decision.
Table 3 Stage initialization and development trigger Phase Life stage Number Initialization
Date Repeat simulation date to white stem borer lifetime (51 days)
When the program is ready, the next step is to acquire climate data through Meteorological Data component. It is also important to bear in mind that Timer component is as well needed to be adjusted, the same timing as for meteorological data. DYMEX Simulator requires user to fetch attachment from third party source. The source itself is meteorological data in ―.csv” format.
Result Interpreting
10
11
RESULTS AND DISCUSSION
Topography and Climate Condition of Sumbawa Regency
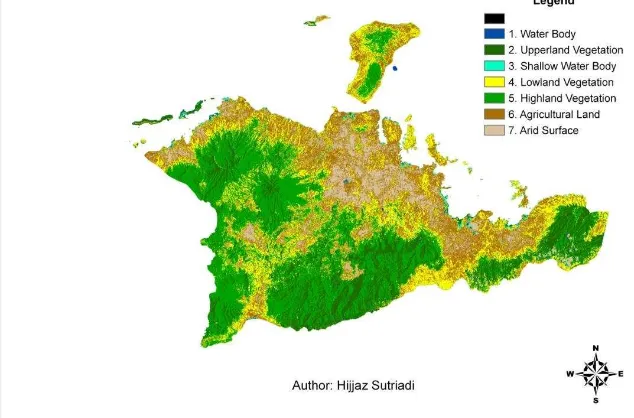
Sumbawa Regency covering most western part of Sumbawa island lies on south-central Indonesia. It is administratively part of West Nusa Tenggara province, Indonesia with monsoonal rain type (Bayong 1999). In Köppen climate classification, Sumbawa is classified Aw type along with northern coast of Australia (Peel, Finlayson and McMahon 2007) with a pronounced dry season in which driest month having precipitation less than 60 mm and also less than one per twenty-fifth the total annual precipitation (McKnight and Hess 2000). Sumbawa Regency situated between 116º42 E - 118º22 E and 8º8 S - 9º7 S with elevation ranging from 0 m to 1730 m above sea level (BPS 2012). This study area is typically mountainous with less plateau seizure all out of total coverage.
Figure 4 Thematic map of Sumbawa Regency after image processing acquired from LANDSAT 7 ETM+
12
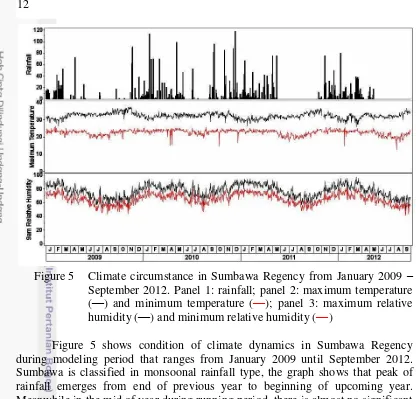
Figure 5 Climate circumstance in Sumbawa Regency from January 2009 – September 2012. Panel 1: rainfall; panel 2: maximum temperature (—) and minimum temperature (—); panel 3: maximum relative humidity (—) and minimum relative humidity (—)
Figure 5 shows condition of climate dynamics in Sumbawa Regency during modeling period that ranges from January 2009 until September 2012. Sumbawa is classified in monsoonal rainfall type, the graph shows that peak of rainfall emerges from end of previous year to beginning of upcoming year. Meanwhile in the mid of year during running period, there is almost no significant rainfall recorded.
Temperature, which basically is very dynamic at every hour, was recorded to create significant extreme between high record and low record in daily basis. Average minimum temperature calculated is 22.6ºC. Meanwhile average maximum temperature is 32.3ºC. From this data we can obtain information that in Sumbawa averagely there is around interval ±10ºC between day temperature and night temperature.
13
Model Limitation and Considered Assumption
Constructing a model in this research is no exception from limitation that may hinder possible influential factors other than ones included. The selected parameters involved in building up the model, however, have been considered carefully under suggestion and guideline from some sources. In Figure 3, there reveals involving parameters, processes, and linkages which are those entitled to a nexus. From the top of network, timer module consisting of simulation date and day of year along with climate parameters comprising of temperature, relative humidity and rainfall, are two of most important basis that construct the model in first place. Day length is later considered the second level of module as it is derived from day of year of timer module and latitude input from independent parameter. Day length as mostly known limiting factor for plant growth represents duration of sun light exposure on surface which is closely related to thermal energy. Length of day varies in each place at different latitude. Sumbawa, a region lies at 8⁰43 S situated within tropical zone, in which mostly characterized by constant day length of averagely 12 hours for whole year.
The third level of model sequence as appears in Figure 3 is set for evaporation and daily average temperature module. Both of these modules are derived from day length module. Evaporation, however, is not solely influenced by day length. In addition, its entity consists of climate parameters such as temperature and relative humidity based on class A Pan Evaporation from Fitzpatrick method. Meanwhile daily average temperature module is constructed from temperature parameter only.
The fourth level is filled by soil moisture module. It is set from derivation of evaporation module and is as well additionally constructed by independent factors outside inter-dependent thread in the nexus (Figure 3), of which such as soil moisture capacity, evapotranspiration (ET) coefficient and basal evaporation.
From above level and its associated modules, all of them act as limiting factor for rice plant growth and thus subsequently affect white stem borer development. Separately, the white stem borer development is directly limited by timely dimension and climate parameters such as temperature, relative humidity and rainfall. Furthermore, influential factors that limit each life stage of white stem borer is distinct among them.
Despite of varying limiting factor at every stage, these two independent variables are generally applicable to any stage, of those are complement product function (R=1-(1-r1) x (1-r2) …) responsible for mortality rate, meanwhile
development rate is derived from 2-segment linear function and daily average temperature module. The development rate itself is in the meantime limited by value of temperature threshold that follows slope of 2-segment linear function. At the stage of adult (imago), it involves additional variables, progeny and fecundity. Progeny production, in particular, is limited by temperature and rainfall. The production itself is constructed based on product function (R=r1 x r2) that
multiplies its cohort under suitable condition, living within range of suitable temperature and under certain rainfall intensity and quantity.
14
decision that mostly start to seed in the beginning of distinct rainfall occurrence of wet month. It is assumed that between January 2009 and September 2012 there are three planting times, such as November 2009, September 2010, and November 2011 respectively. This consideration is also supported by the fact that in Sumbawa rice farming most likely depends on rainfall rather than irrigation. Thus, rice farming activity most possibly merely occurs once a year in the regency.
The emergence of every white stem borer life stage in this model is importantly considered. Thus, initialization time is given in order to meet condition of parasitism symbiosis as conceived between rice plant and pest. Time of initialization is started after 40 days of seeding, a moment when leaves emerge during vegetative phase. This condition suits egg development in which grows information and sources from that place are considerably involved. Some of it for instance farmer’s planting time decision, climate data, rice harvesting losses, spatial map, and other related quantitative data are those appropriately in the model. Further qualitative information that relates to model output will be thus somewhat additionally for analysis.
White Stem Borer Life Stage Development and Mortality
The presence of white stem borer in Sumbawa Regency has been identified as proved by recorded infectious area in the region. From January 2009 – September 2012, based on time order, it is observed that 147.8 ha in 2010; 272 ha in 2010; 361.5 ha in 2011; 282 ha in 2012 (January – September) are considerably attacked by white stem borer proliferation. However, the real amount of population remains no clue since there was no species basis measurement on field. Therefore, a model is constructed with DYMEX that is expected to become possible to interpret the real condition through its output.
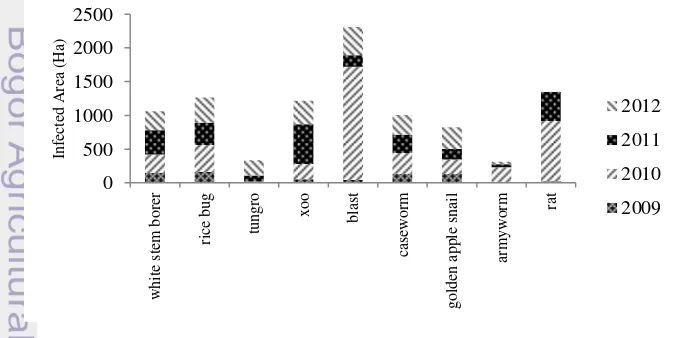
Figure 6 Pests and diseases affecting rice field in Sumbawa Regency
15 The cause of harvest losses in Sumbawa Regency is not solely generated by the presence of white stem borer alone. In fact, other pests and plant diseases are accordingly alleged to damage rice plant over the regency. Total infectious area as of 2009 is 724.8 ha. In the upcoming year of 2010, the figure significantly increases up to 4,225 ha. The main contributors to this notable increment are mostly blast and rat. Meanwhile a year afterward, number of affected area decreases to about a half that of previous year observation data which accounts 2,441.25 ha. The latest measurement ends up on September 2012 with recorded accumulative infected area during the due time is observed 2,292.5 ha, a slight decrement prevalence compared to preceding record. However, in this discuss it will be narrowed to merely analyze the allegation of white stem borer as one of major factors to damage the rice plant in Sumbawa Regency in association with climate circumstance in the region.
Life Stage Population Production
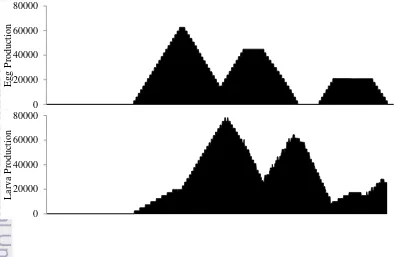
Figure 7 is acquired from the model output that shows the dynamics of white stem borer production at various stages. Three consecutive planting phases during four-year running model are the time basis trigger that create dynamic population graph. Each planting phase enables white stem borer to exist on hosting plant for a limited period before or during succeeding phase takes place. First phase of rice planting as conducted by farmer in Sumbawa occurs on November 2009 when seeding activity is started. However, eggs are yet present at the moment. Later, 40 days after seed germination leaves start to emerge. Thus, at this first phase, eggs are present on 11 December 2009 as many 3,000 as first time initialized in the model. Egg population still grows at almost constant rate in the upcoming weeks since first initialization until it reaches its peak production on June 2010. Afterward, declining production begins to incur at the same rate. However, egg population in the first planting phase still remains its number even the second phase of planting has been started. This trend, however, follows the conceived function created in the model which is 2-linear function.
16
Figure 7 White stem borer productions at various stages from January 2009 – September 2012 in Sumbawa Regency. Panel 1: egg production; panel 2: larva production; panel 3: pupa production; panel 4: adult (imago) production
Larvae begin to emerge after 9 days since first egg cohort seizing the leaf tip of rice plant. Larva stage as of egg in this first phase grows constantly until it reaches the same timing of egg maximum growth. Nevertheless, the rate of larva itself is lower. The trend, however, is changing afterward in the middle of year. Larva population tends to grow at faster rate until the end of 2010. Later, it experiences declining pace, simultaneously when second phase of planting has already been begun.
Transformation from larva to pupa in the first phase of planting takes place for first time on 11 January 2010. However, the pupa population output as produced by model is not appropriate enough. Thus, the concern now only focuses on trend of its growth instead of quantitative measurement. The trend of pupa population growth is relatively constant for upcoming months until 12 May 2010. Though, two outlying records are found that occur on 7 March and 20 April 2010. Larva stage during the first planting phase undergoes a short diapause for around a month and half that lasts until 12 June 2010. Larvae as product of pupa transformation later re-exist again breaking its diapause until September 2010 that completes its presence during the first planting phase period.
Adult (imago) white stem borer as initialized in the model on 22 January 2010 in the first planting phase shows a pronounced trend. During this phase, there are two peaks of population production that take place on 6 June and on 9 August 2010. Subsequently the graph lowers to reach lowest point during the first planting phase, the time when second planting phase is about beginning.
17 As the model set to consist of three planting phases, the output as interpreted on graph in Figure 7 is thus an overlaid production. This overlay is selected from the highest value of those two phases so that the lowest value is then eliminated or unnecessarily figured on graph.
The second planting phase is started on September 2010, two months earlier than previous year. This is due to shifting wet month in which of such natural sign farmer makes decision. In this second phase, the emergence of egg is thus earlier. However, egg population of previous phase is still present. Such prevalence is somehow provoking a question whether farming activity is still taking place in other area simultaneously with the beginning of new planting phase or eggs are living beneath infectious hays from the last planting.
During second phase of planting, egg population increases at constant rate since initial emergence on 11 October 2010, 40 days after rice plant enters vegetative phase. The egg production is later no change with constant number for almost three months until 7 May 2011. Nevertheless, constant production upon its quantity is somehow the highest record during second phase of planting. It subsequently lowers to reach zero production on 18 September 2011. Egg stage later undergoes termination moment for three months. New cohorts of egg emerge as third planting time takes place. This last phase of three within four years observation begins on November 2011. Egg production shows a similar pattern of graph as its two preceding phases, constant rate of increment then followed by constant production and lastly decreasing to reach zero growth. Even though, in the third egg emergence, number of production is the lowest among records.
Larva population in the second planting phase is a transformation from egg stage of the same phase that emerges on 20 October 2010. It reaches its peak when the date is 18 September 2011. Later the trend line declines until it meets cross point where emerging production of larva from the third planting phase inclines up which occurs on 23 February 2012. The larva production of last planting phase begins to emerge on 23 December 2011. The highest point of this phase occurs on 5 September 2012.
Pupa production, as mentioned previously, does not show an appropriate graph thus it is merely discussed from its trend. In the second planting phase, as pupae are product of transformation form larvae, start to emerge as soon as it is initialized on 11 September 2010. However, it shows that number of larva production is not relevant to previous contributing life stage number. This difference remains big notable lag. The reason may be caused by defect model process that does not well translate the functions and variables into dynamic quantitative output value. Nevertheless, the trend at least is the only one resource that enables us interpreting its dynamic process. As an overlying production incurs on previous life stages between two phases, the same prevalence applies on larva stage.
18
inherently due to dynamic characteristic as shown by preceding life stages that reasonably correlated. This linkage of life stage entirely completes a life cycle of white stem borer.
Life Stage Population Mortality
In the model, it was previously set that mortality of each life stage of white stem borer should be present. At given limited factors, the development is thus restricted by considering white stem borer stress due to unfavorable weather circumstance in daily basis. This condition, however, applies to any living organism. Since white stem borer is a cold blooded organism, climate factor plays a pivotal role in determining its livelihood (Kisimoto and Dyck 1974).
19 phase I; panel 2: stage mortality at phase II; panel 3: stage mortality at phase III
The three planting phases assumed in the model have resulted in three different outputs as shows in Figure 8. The population mortality is therefore concentrated on given time when rice plant still grows or in the period of farming. Figure on panel 1 shows life stage population mortality in first planting phase. Dense and frequent mortality occurrence takes place at egg stage. Meanwhile at larva stage, mortality is more concentrated in middle year of 2010. Disperse mortal population is shown at pupa stage. For adult stage, prolonging recorded mortal population is escalating in every month of 2010.
Mortal population on the second and third planting phases is characterized by shifting mortality occurrence. However, the quantity of each mortal population is different among them. From these three panels, the information can be obtained that mortality occurrence follow the pattern of rice planting time in which white stem borer significantly decease when limiting factor of rice plant growth and direct climate disturbance take part.
Effects of Climate Parameters on Life Stage Production
Temperature
The presence of temperature that impacts living organism livelihood has long time been standing out among other major factors. White stem borer as cold blooded organism is no exception from extreme cold or heat temperature influence. Thus, response of such insect to thermal factor is characterized by one of them impact on population development and reproduction (Brown et al 2004). The relationship between ambient temperature and development, survival and reproduction scale up from daily or even hourly effects on individuals to seasonal patterns of phenology and population dynamics (Jacques et al 2012).
20
Figure 9 Temperature trend on each life stage of white stem borer production pattern
In the model, temperature as limiting factor is involved as it is suggested to playing a role in thermal stress that implicates white stem borer development. At egg stage based on temperature pattern, it shows that declining trend of temperature is followed by declining population. Among those two daily temperature records (Tmin and Tmax), recorded minimum temperature is more
influential in fitting the egg population trend. Thus, cold stress is more influential compared to hot stress in limiting egg population development. This trend somehow looks more pronounced at the second planting phase.
21 egg stage, during second farming time in 2011. However, temperature impact on pupa stage still remains no clue as the output of model at this stage is less considerable. Thus, the correlation doesn’t clearly meet relevant context. Meanwhile for adult stage, significant recorded extreme temperature gives considerable influence on its development trend. Among those, recorded lowest daily temperature of 12.6⁰C on 8 August 2012 causes diapause of adult population which leads to zero production afterward. This profoundly suggests that cold stress is more influential than heat stress in determining adult population control of white stem borer.
Temperature, both cold and heat stress in overall contribute to population development limitation of white stem borer as it is proved by fitting trend of those layers at each stage. This occurrence is due to temperature regimes near either lower or upper threshold (Worner 1992).
Relative Humidity
Relative humidity plays a critical role in insect development particularly those living in relatively dry regime. Lack of relative humidity influence the ability to regulate water loss. Benz (1987) has studied that humidity as one of environmental factors along with temperature that influences insect development and those two factors are inseparable. Insect, however, has high moisture contents and owing to their size, has very high surface area to volume ration so they can readily lose moisture through evaporation (Child 2007).
22
Figure 10 Relative humidity trends on each life stage of white stem borer production pattern
White stem borer production at four consecutive life stages as impact of relative humidity dynamics in the environment is shown in Figure 11. At egg stage, the population trend of three times outbreak neatly follows humidity pattern over years. The optimum number of egg population occurs when vapor mass in the air is rich. Otherwise, low RH increases mortality during the egg stage (Sabelis 1985, Schausberger 1998, Holmes et al 2012). It is proved by the absence of egg population as low RH is dominantly present between second and third planting phase.
Meanwhile at the larva stage, similar condition applies during first and second planting phase. Significant larva population increment occurs to follow inclining RH from the lowest record on August 2010. For the third larva population outbreaks, it takes a delayed time to fit rhythm of RH trend over designated time. However, overall it can be obtained an information larva population is on the way with RH trend line.
As many explanations previously discussed regarding to pupa population, its affected impact from the presence of RH dynamics is slightly pronounced that through its production, however, follows the RH trend. Despite of undesirable pupa population output from the model for analysis of relative humidity, it has eventually met the requirement.
Adult stage with its uneven and very dynamic population production has a special case for discussion. The pattern as it shows in panel 4 of Figure 11 hints an outlier case in which maximum production of first adult outbreaks meets one of
23 RH lowest records on August 2010. Therefore, it provokes a question over the connectivity between RH and physiological adult white stem borer development. However, if we try to scrutinize possible interconnection between this natural factor and the adult insect itself, it will be found out that actually adult population production follow RH trend line. It is only proved and becomes possible when the graph is dragged left side or time is set earlier. Then it can be obtained an account that delay between times since initialization of egg stage to adult stage has resulted in incurring cross points between RH trend and adult white stem borer production pattern.
Rainfall
Abundance of rainfall is one of driving factors that directly contribute to soil moisture. Figure 11 shows that significant rainfall occurrence in Sumbawa triggers the soil moisture at notable index. This condition simultaneously affects rice plant growth as soil moisture considered one of limiting factors. Therefore, eventually the condition brings out white stem borer as a pest that lives depending on rice plant as host is a consideration.
Figure 11 Rainfall impact on soil moisture index
For some insects, rainfall contributes to declining in number during wet mid-season, sometimes exhibiting an abundance that is lower than that observed during the dry season (Robinson and Robinson 1970, Anu et al 2009). Rainfall, in some portion is significantly necessary for hosting plant to grow. Otherwise, exceeding number thus may cause mortal population of insect due to rain washing.
24
Figure 12 Rainfall occurrences on each life stage of white stem borer production pattern
Egg white stem borer emerges as initialized in the beginning of pronounced wet season. However, the relationship between rainfall occurrence and egg production later on presumably does not at all always coherent. Otherwise the population production itself reverses to against trend of rainfall. It is proved by maximum production achieved occurs during the absence of rainfall. Meanwhile declining production tends to occur when rainfall is abundant. This occurrence repetition applies to every planting phase.
25 small size of physiological appearance of white stem borer relative to raindrop. This fact may lead to washing that causes disappearance of white stem borer.
Larva Population Distribution on Climate Parameters
In statistics, the scattering plot within coordinate area of graph is one of the best ways to see the distribution of those data. Figure above lets us know how larva population distributed within range of climate parameters. Larva stage has been strongly considered the most peril cycle of white stem borer toward rice stem damage. Its presence in some parts is driven by climatic factor. The distribution of larva within graphical display could be a solid indicator to take account of in which range of climate factors contribute the most to larva proliferation.
Figure 13 Climate parameter and larva population distribution
26
define the best temperature range of optimum larva development. Based on calculation of mode of both maximum and minimum temperature, it shows that temperature between 23.8ºC – 31.6ºC the most convenient thermal range that fits larva population development. This consideration is more suggestible as this range is standing within temperature interval of 27ºC – 37ºC, the extent of any clusters.
The vapor content in the air could be one of reasons why insect prefer to limit its migration and development as it deals with humidity stress (Huang et al 2010). Recorded high RH in Sumbawa has resulted in dense cluster within the interval of 55% - 95% with additional predominant presence within interval of 77% - 87%. Meanwhile at recorded low RH, larva distributed within range of 48% - 78%. Among this record, it is also necessary to consider the other statistical approach in order to define the most representative humidity interval of optimum larva population development. Using mode and mean data of both recorded RHmin
and RHmax, it is found out that the best humidity that comforts the most larva
white stem borer to develop is within interval of 65% - 77%. This range, therefore, is considered the optimum humidity that represents any clusters.
Table 4 Quartile, median, mode and mean of climate parameter and larva population
27 stress due to extreme environment temperature, humidity stress, and washing due to intensifying and exceeding rainfall occurrence. Larva stage of white stem borer as single damaging stage to rice plant lives within considerable interval. However, it is found that the most optimum development occurs within temperature of 23.8ºC – 31.6ºC, relative humidity of 65% - 77% and rainfall between 0 mm – 30 mm. Meanwhile, most intensifying larva infestation occurs on February 2010, September 2011, and September 2012 respectively.
Suggestion
As this model purposed to obtain information about population dynamics of white stem borer at every life stage, however, the result is not always satisfying as pupa production results an unfavorable output. The quantitative production of pupa does not fulfill hypothesis that it is expected to undergo development trend akin as of egg, larva and pupa stage. Thus, in the further research, it is necessary to re-examine the model by amplifying involved or even considerable relevant involved parameters, functions, and linkages in order to acquire more accurate and prolific output. It is also recommended to conduct more structured initialization of each life stage running.
REFERENCES
[BPS] Badan Pusat Statistik. 2012. Sumbawa dalam Angka (Sumbawa in Figures 2012). (ID)
[IRRI] International Rice Research Institute. 2004. Management options for white stem borer Scirpopagha innotata (Walker) in irrigated lowland rice in Agusan del Norte, EH Batayan, AB Estoy. AA Ortiz, RT Cruz. Agusan del Norte (PH) [IRRI] International Rice Research Institute. 2009. Rice knowledge bank: White
stem borer [internet]. [accessed 28 December 20013]. Available online: http://www.knowledgebank.irri.org/ipm/stem-borer/stem-borer-species/white-stem-borer.html. (PH)
Anu A, Sabu TK, Vineesh PJ. 2009. Seasonality of litter insects and relationship with rainfall in a wet evergreen forest in south Western Ghats. Journal of Insect Science. 9(46): 1-10 (IN)
28
scenarios. Biomass and Bioenergy. 34:124-133.
doi:10.1016/j.biombioe.2009.10.009 (US)
Beighley DH. 2012. Soils, Plant Growth and Crop Production. Missouri: Southeast Missouri State University (US)
Bayong T. 1999. Klimatologi Umum. Bandung: Penerbit ITB (ID)
Brown JH, Gillooly JF, Allen AP, Savage VM, West GB. 2004. Toward a metabolic theory of ecology. Ecology 85(7): 1771-1789 (US)
Child RE. 2007. Insect Damage as Function of Climate. Museum Microclimates: National Museum of Denmark (DK)
Fitzptarick EA. 1963. Estimates of pan evaporation from mean maximum Temperature and vapor pressure. Applied Meteorology. 2:780-792. doi:10.1175/1520-0450(1963)/002<0780:EOPEFM>2.0.CO:2 (AU)
Holmes LA, Vanlaerhoven SL, Tomberlin JK. 2012. Relative humidity effects on the life story of Hermetia illucens (Diptera: Stratiomidae). Environmental Entomology. 41(4):971-978 doi:10.1603/EN12054 (US)
Huang SH, Cheng CH, Wu WJ. 2010. Possible impacts of climate change on rice insect pests and management tactics in Taiwan. Crop, Environment & Bioinformatics. 7:269-279. (TW)
Jacques R, Powell J, Bentz B, Nealis V. 2012. Effects of temperature on development, survival and reproductions of insects: Experimental design, data analysis and modeling. Journal of Insects Physiology. doi:10.1016/j.jinsphys.2012.01.010 (CA)
Kartasapoetra AG. 1993. Hama Tanaman Pangan dan Perkebunan. Jakarta: Bumi Aksara (ID) landscape Appreciation. Upper Saddle River, New Jersey: Prentice Hall (US) Nahrung HF, Schutze MK, Clarke AR, Duffy MP, Dunlop EA, Lawson SA. 2008.
Thermal requirements, field mortality and population phenology: Modelling of paropsis atomaria olivier, an emergent pest in subtropical hardwood plantations.
Forest Ecology and Management. 255: 3515-3523 (AU)
Peel MC, Finlayson BL, McMahon TA. 2007. Updated world map of the Köppen-Geiger climate classification. Hydrology and Earth System Sciences 11:1633-1644 (AU)
Rahman TM, Khalequzzaman M. 2004. Temperature requirements for the development and survival of rice stemborers in laboratory conditions. Entomologia Sinica. 11(1):47-60 (MY)
29 Rubia EG, Lazaro AA, Heong KL, Diah WS, Nurhasyim, Norton GA. 1996. Farmers’ perceptions of the white stem borer Scirpopagha innotata (Walker), in Cimalaya, West Java, Indonesia. Crop Protection 4(15):327-333 (UK) Rubia EG, Nurhasyim, Diah WS, Heong KL, Zalucki MP, Norton GA. 1997.
White stem borer damage and grain yield in irrigated rice in West Java, Indonesia. Crop Protection. 7(16):665-671 (UK)
Taylor F. 1981. Ecology and evolution of physiological time in insects. The American Naturalist. 117(1): 1-23. doi:0003-0147/81/1701-0002502.00 (US) van der Goot P. 1925. Levenswijze en bestrijding van den Witten Rijstboorder op
Java. Meded Inst PlZiekt Buitenzorg 66:1-308 (NL)
Vojtěch J, Lukáš K, Alois H, Anthony FGD. 2004. A general rule for the dependence of developmental rate on temperature in ecthotermic animals. Proc R Soc Lond B 271: 219-221. doi:10.1098/rsbl.2003.0145 (CZ)
Worner SP. 1992. Performance of phonological models under variable temperature regimes: consequences of the Kauffmann or rate summation effect. Environmental Entomology. 21:689-699 (US)
30
31 Appendix 1 Pest and disease that infected rice field area in Sumbawa Regency
from 2009-2012
Appendix 2 Average monthly minimum temperature, maximum temperature, maximum relative humidity, minimum relative humidity, and monthly rainfall in Sumbawa during 2009-2012
32
33
CURRICULUM VITAE
I, Hijjaz Sutriadi, was born on the outskirts of small town of Sumbawa on June, 29th 1991. I entered Bogor Agricultural University (IPB) through USMI in 2009, the year I graduated from high school at SMAN 1 Sumbawa. I had been joining IAAS (International Association of Students in Agriculture and Related Sciences) ever since became a freshman in the college and later involved in ICSF (Indonesian Climate Student Forum) a year afterward. In 2011 I was elected as coordinator in chief of one of IAAS LC-IPB’s biggest events called IAAS Olympic which was held nationally. I became coordinator of ICSF from 2011 to 2012. During four consecutive years being undergraduate student, I had joined some international events so had I competed in some competitions both national and international level. In 2012 I was awarded The Best Scientific Paper under the scope of ecology at The 19th Tri-University International Joint Seminar and Symposium which were attended by major Asian countries and Australia. In 2011, I once was invited by Niigata University, Japan to present my environmental project under full sponsor by hosting university. I also attended the 2nd and 3rd International Agriculture Student Symposium organized by Universiti Putra Malaysia in year 2010 and 2012 respectively. In the mid of 2011 at Padjajaran University, Bandung I successfully became runner-up at National Scientific Paper Competition in Agriculture. To the extent of my personal background, I myself have an immense passion for the arts, blogging, traveling, languages and sport (particularly badminton). In regard to my hobbies, I prolifically have produced some artworks such as drawings and sketches, written several articles on my personal blog and travelled frequently across the country since past four years.