Hubungan Profil Lipid dengan Resistensi Insulin pada Pasien Sindroma Ovarium Polikistik
Ichwanul Adenin, Henry Salim Siregar, Herbet Sihite,M. Rhiza Z. Tala, Sarah Dina, Hendri Ginting
Departemen Obstetri dan Ginekologi Fakultas Kedokteran Universitas Sumatera Utara Medan, Indonesia, Januari 2013
ABSTRAK
Latar belakang: Penderita SOPK memiliki implikasi gangguan reproduksi dan metabolisme misalnya dislipidemia, resistensi insulin, dan obesitas.
Tujuan: Untuk menilai hubungan antara profil lipid dengan kejadian resistensi insulin dan marker obesitas (BMI dan WHR) pada wanita dengan SOPK
Desain: Penelitian ini bersifat deskriptif analitik dengan rancangan cross sectional study
Bahan dan Cara Kerja: Didapatkan 57 pasien dengan diagnosa SOPK berdasarkan kriteria Rotterdam 2003 yang berkunjung ke Klinik Halim Fertility Center antara bulan Mei sampai Oktober 2012. Pasien diwawancarai kemudian diperiksa marker obesitasnya. Sampel darah vena setiap pasien diambil setelah dipuasakan selama 10-12 jam untuk pemeriksaan profil lipid, gula darah puasa, insulin puasa, FSH, LH, dan prolaktin. Hubungan antara profil lipid dengan resistensi insulin dan marker obesitas kemudian dianalisa.
Hasil: Dari 57 pasien SOPK didapatkan dislipidemia didapatkan 37 orang (64,9%), resistensi insulin 8 orang (14%), dan overweight dan obesitas 24 orang (42,1%) serta obesitas sentral 34 orang (59,6%). Ada hubungan yang bermakna antara dislipidemia dengan resistensi insulin dan marker obesitas (BMI dan WHR) dimana proporsi dislipidemia positif lebih besar pada kelompok resisten insulin, overweight-obese dan obesitas sentral dibandingkan dengan kelompok sensitif insulin, normoweight-underweight dan WHR normal (p<0,05). Kadar trigliserida lebih besar dan kadar HDL lebih kecil pada kelompok resisten insulin, overweight-obese dan obesitas sentral dibandingkan pada kelompok sensitif insulin, normo-underweight dan non-obesitas sentral (p<0,05).
Kesimpulan: Ada hubungan yang bermakna antara dislipidemia dengan resistensi insulin dan marker obesitas.
Association Between Lipid Profile And Insulin Resistance In Subjects With PCOS
Ichwanul Adenin, Henry Salim Siregar, Herbet Sihite,M. Rhiza Z. Tala, Sarah Dina, Hendri Ginting
Department of Obstetrics and Gynecology, Faculty of Medicine, University of Sumatera Utara, Medan, Indonesia, Januari 2013
ABSTRACT
Background: Subjects with PCOS have reproductive and metabolic disorders such as dyslipidemia, insulin resistance, and obesity. Objective: To determine association between lipid profile with insulin resistance and obesity markers (BMI and WHR) in subjects with PCOS.
Design: This study was conducted using analytical descriptic approach with cross-sectional study design. Material and Method: Fifty seven PCOS-diagnosed subjects based on revised 2003 Rotterdam criteria that visited the Halim Fertility Center Clinic were obtained between May and October 2012. The subjects were interviewed and then examined for their obesity markers. Venous blood samples were taken after a period of 10-12 hours of fasting and were then examined for lipid profile, fasting blood glucose, fasting insulin, FSH, LH, and prolactin levels. Analysis was conducted to assess the association between lipid profile with insulin resistance and obesity markers. Results: After analyzing 57 subjects with PCOS, dyslipidemia was observed in 37 subjects (64,9%), insulin resistance in 8 subjects (14%), overweight-obesity in 24 subjects and central obesity in 34 subjects (59,6%). Substantial association was established between dyslipidemia with insulin resistance and obesity markers (BMI and WHR) where a larger proportion of positive dyslipidemia was observed in subjects who were resistant, overweight-obese, and central obesity compared to subjects who were sensitive, normo-underweight, and non-central obesity (p<0,05). Subject who were insulin-resistant, overweight-obese, and central obesity were observed with a higher level of tryglicerydes and a lower level of HDL compared to subjects who were insulin-sensitive, normo-underweight, and non-central obesity (p<0,05. Conclusion: There was significant relationship between dyslipidemia with insulin resistance and obesity markers.
BACKGROUND
Polycystic ovarian syndrome is a dysfunctional ovarian syndrome characterized by
anovulation, hyperandrogenism, and/or the presence of morphology typical of a polycystic
ovary. This syndrome is the most common endocrine disorder observed in women, accounting
for 5-7% of the total reproductive-aged women population. PCOS does not only involve
reproductive disorders but also involve metabolic disorders. PCOS is associated with
dyslipidemia, insulin resistance/hyperinsulinemia, glucose intolerance, and obesity that cause an
increased risk of atherosclerotic cardiovascular disease.
Dyslipidemia is a metabolic disorder commonly found in women with PCOS. According
to the National Cholesterol Program guidelines, almost 70% of women with PCOS are observed
with at least one increased lipid level or borderline.
1,2
3
In another study, the prevalence of
dyslipidemia in women with PCOS is approximately 24%, with a higher percentage observed in
PCOS subjects with insulin resistance compared to PCOS subjects without insulin resistance.
(39,9% vs 15,3%).
Dyslipidemia in PCOS is frequently manifestated as an increased level of low-density
lipoprotein (LDL), very-low density lipoprotein (VLDL) dan trygliserides (TG) with a decreased
concentration of high-density lipoprotein (HDL) eventhough many women with PCOS have a
normal lipid profile. This changes are consistent to lipid profile tipically observed in cases of
insulin resistance.
3,4
Insulin resistance is common feature in cases of PCOS with prevalence of approximately
50% to 75%. Insulin sensitivity decreases in approximately 35-40% of women with PCOS
compared to normal women, a figure resembling with data observed in women with type II
diabetes mellitus. Up to 35% of women with PCOS indicate glucose intolerance, 7-10% of which
meet to the type 2 diabetes criteria. On the contrary, women with type 2 diabetes are at a 6-fold
higher risk to develop PCOS compared to non-diabetic subject with the similar body weight and
age.
1,4
The effect of insulin resistance on lipid metabolism is well known. An increased hepatic
VLDL particle secretion results in an increased tryglicerides plasma levels. Furthermore,
trygliceride particles are exchanged with cholesteryl ester (CE) through a CE transfer protein
mechanism. This process produces trygliceride-enriched LDL which more easily catabolized,
and CE-enriched VLDL particles are converted into smaller LDL particles. Consequently,
insulin resistance contributes to a decreased plasma HDL-C concentration and apolipoprotein
(apo) A-I, and higher apo-B levels.
Obesity was reported in approximately half of the PCOS population. Eventhough, recent
statictics indicate that the prevalence of PCOS associated with obesity has yet to be determined
and a common opinion currently developing stating that the obesity incidence is possibly higher,
at least in USA. Obesity in cases of PCOS can be observed from an increased waist hip ratio or
android appearance as the opposite of truncal obesity. Obesity increases the risk of PCOS for
several reasons. First, obesity correlate with a decreased sex hormone binding globulin, resulting
in an increased circulating testosterone and free estradiol levels. Second, an increased possibility
of dyslipidemia due to obesity consequently raises concern of cardiovascular risk. Third, obesity
associates with insulin resistance which could finally result in diabetes mellitus in patients with
PCOS. Overcoming this abnormalities through a significant body weight reduction highlights the
the impact of obesity in cases of PCOS.
1,4
Several studies clearly indicate that a significant increase of LDL cholesterol levels could
cause cardiovascular disease. Various lipoprotein levels cause a pathological condition resulting
in tissue damage, proliferation, and inflammation especially within the cardiovascular system. A
significant increase in cholesterol levels show primary changes in lipid metabolism in patients
with PCOS.
6,7
A significant decrease in HDL cholesterol level in patients with PCOS clearly indicates
an early risk for cardiovascular disease. Because HDL cholesterol takes cholesterol from
peripheral tissues, the antiatherogenic role of HDL is low in this group. A decrease in scavenging
activity may cause lipid to accumulate resulting in cardiovascular complications in the future.
6
Insulin resistance is a common possible pathogenic factor in an association between lipid
abnormality, glucose intolerance, obesity, hypertension, and coronary artery disease together
constituting the metabolic syndrome and syndrome X.
6
This study was conducted in Indonesian population aiming to determine the association
between lipid profile with insulin resistance and obesity marker.
MATERIAL DAN METHODE
This study was conducted using a prospective descriptive analytical approach with
cross-sectional study design from May 2012 until October 2012 at Divisio of Endocrinology and
Reproductive Medicine, Department of Obstetrics and Gynecology, Faculty of Medicine,
Universitas Sumatera Utara at Halim Fertility Center Clinic. Fifty seven patients diagnosed with
PCOS based on the 2003 Rotterdam revised criteria, that met 2 out of 3 criteria, were recruited in
this study. These criteria include 1.) Oligo and / or anovulation 2.) Clinical and/or biochemical
signs of hyperandrogenism 3.) Polycystic ovary. Exclusion criteria consist of diabetes mellitus,
tyroid disease, hyperprolactinemia, and Cushing disease. Patients were interviewed and
examined for body height, body weight, waist circumference, and hip circumference followed by
calculating the BMI and WHR. Five milliliter of venous blood samples were taken from each
patient after a period of 10-12 hours of fasting to examine lipid profile (consists of total
cholesterol, tryglicerides, LDL, and HDL), fasting blood glucose, fasting glucose, FSH, LH, and
prolactin.
Two obesity markers that consist of body mass index (BMI) and waist hip ratio (WHR),
describing central obesity were used to asses the association between obesity and lipid profile.
Body height and weight measurements were used to calculate body mass index
(BMI=weight/height in m2. The 57 patient were categorized into 4 BMI groups based on WHO
criteria which were as follows: underweight <18.5 kg/m2, normoweight 18.5-24.9 kg/m2,
overweight 25.0-29.9 kg/m2, and obese > 30 kg/m2.
Waist-to-hip ratio was calculated after measuring waist circumference between the pelvic
brim and the lower costal margin, whereas hip circumference was measured at the level of mayor
trochanter. Waist-to-hip ratio ≥ 0,85 was considered abnormal/central obesity, whereas a value <
0,85 was considered normal. To assess the effect of obesity on lipid profile in patients with
PCOS, a comparison of parameter of lipid profile was performed among 4 BMI groups and 2
WHR groups in patients with PCOS.
Finally, based on fasting glucose and fasting insulin ratio (GI ratio), subject were
categorized as insulin-resistant if GI ratio ≤ 4,5 and insulin-sensitive if GI ratio > 4,5. Lipid
profile were compared between the two group.
Statistical Analysis
Comparison between the continous data was analyzed using t student tes. The Mann
Whitney test was used to assess the comparison between abnormally distributed data. The
One-way ANOVA test was used to compare mean levels in more than 2 groups. Chi-Square test was
used to assess the association between 2 or more categorical data. P value < 0,05 was considered
statistically significant. The collected data were then analyzed using computer.
RESULTS
After analyzing 57 subjects with PCOS, dyslipidemia was observed in 37 subjects (64,9%), insulin resistance in 8 subjects (14%), overweight-obesity in 24 subjects and central
obesity in 34 subjects (59,6%). Patient characteristic profiles are presented in table 1.
Table 1. Patient characteristic profiles
Characteristics N Percentage
Dyslipidemia
Positive 37 64,9
Negative 20 35,1
Total 57 100
Menstrual Cycles
Oligomenorrhoe 38 66,7
Amenorrhoe 19 33,3
Total 57 100
GI Ratio
Insulin-resistent 8 14,0
Insulin-sensitive 49 86,0
Total 57 100
BMI
Underweight 5 8,8
Normoweight 28 49,1
Overweight 16 28,1
Obese 8 14,0
Total 57 100
Effect of Insulin Resistance on Lipid Profile
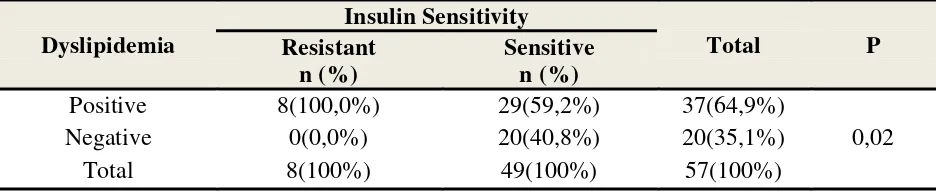
In subjects who were insulin-resistant, the proportion of positive dyslipidemia subjects
was exactly 100% (8 subjects) with a 0% percentage of negative dyslipidemia (0 subjects),
whereas in subjects who were insulin-sensitive, the proportion of positive dyslipidemia and
negative dyslipidemia were 59,2% (29 subjects) and 40,8% (20 subjects), respectively. From
these findings, the proportion of positive dyslipidemic subjects with insulin resistance were
observed with a much higher percentage (100%) compared to insulin sensitive subjects (59,3%).
Using the Chi-Square test, a statistically significant association was established between insulin
resistance and dyslipidemia with a p value<0,05 (p=0,02) (Table 2).
Table 2. Association Between Dyslipidemia and Insulin Resistance observed in Study subjects
Dyslipidemia
Insulin Sensitivity
Total P
Resistant n (%)
Sensitive n (%)
Positive 8(100,0%) 29(59,2%) 37(64,9%)
0,02
Negative 0(0,0%) 20(40,8%) 20(35,1%)
Total 8(100%) 49(100%) 57(100%)
⃰
) Fisher Test
If we compare the lipid profile parameters in both groups based on insulin sensitivity,
higher levels of average total cholesterol, triglyceride, and LDL were obtained with lower levels
of average HDL observed in subjects who were insulin-resistant than subjects who were insulin
sensitive, although only average tryglicerides and HDL levels showed any statistically significant
difference between the 2 groups with a p value<0,05 (p=0,01). Whereas no statistically
significant difference of average total cholesterol and LDL levels were observed between the 2
groups with a p value>0,05 (p=0,77 and 0,90) (table 3).
Table 3 Lipid Profile Comparison based on Insulin Senstivity in Study Subjects
Normal 23 40,4
Central obesity 34 59,6
Lipid Parameters (mg/dl)
Insulin Senstivity
P Insulin-resistant
n=8 x ± SD
Insulin-Sensitive n=49 x ± SD
Total Cholesterol 183,25±29,20 186,53±30,76 0,77
Tryglicerides 182,25±56,57 81,69±31,06 0,01
LDL 116,50±30,88 115,10±30,98 0,90
HDL 40,37±8,24 53,10±10,11 0,01
⃰
) Student T-test
BMI Effects on Lipid Profile
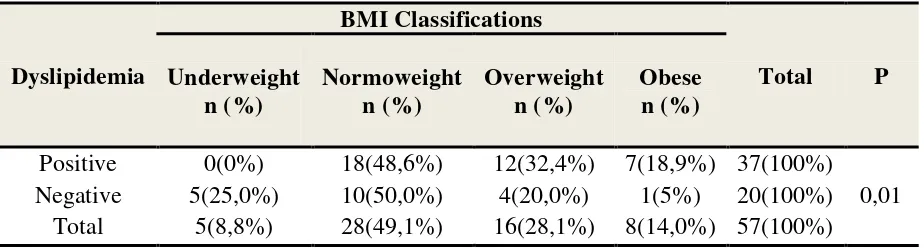
In subjects who were positive dyslipidemia, the highest proportion was observed in
subjects with a combined overweight and obese BMI, as much as 51,2% (19 subjects) compared
to subjects with a combined normoweight and underweight BMI, as much as 48,6% (18
subjects). Whereas subjects with negative dyslipidemia, the highest proportion was found in the
combined normoweight and underweight BMI group, as much as 75% (15 subjects) compared to
the combined overweight and obese BMI group, as much as 25% (5 subjects). Using Chi-Square
Tests, a statistically significant association was established between BMI and dyslipidemia with
a p value<0,05 (p=0,01) (Table 4).
Table 4. Association between Dylipidemia and in BMI in Study subjects
Dyslipidemia
BMI Classifications
Total P Underweight
n (%)
Normoweight n (%)
Overweight n (%)
Obese n (%)
Positive 0(0%) 18(48,6%) 12(32,4%) 7(18,9%) 37(100%)
0,01
Negative 5(25,0%) 10(50,0%) 4(20,0%) 1(5%) 20(100%)
Total 5(8,8%) 28(49,1%) 16(28,1%) 8(14,0%) 57(100%)
⃰ ) Fisher Test
If we compare the lipid profile parameters within the 4 BMI groups, statistically
significant trygliserides and HDL differences were observed based on BMI classifications with a
p value<0,05 (p=0,001), where average tryglicerides levels positively correlate with BMI
whereas average HDL levels are negatively correlated with BMI indicating that an increase in
level. But no statistically significant difference was observed concerning average total
cholesterol and LDL levels based on BMI classifications with a p value>0,05 (p=0,32 dan 0,13)
(Table 5).
Table 5. Lipid Profile Comparison based on BMI Classification
Lipid parameter (mg/dl) BMI Classification P Underweight n=5 x ± SD
Normoweight n=28 x ± SD
Overweight n=16 x ± SD
Obese n=8 x ± SD
Total Cholesterol 162,40±15,61 189,39±31,96 188,81±26,54 183,75±35,98 0,32 Triglyserides 54,20±16,23 83,85±30,83 113,31±59,22 128,62±68,41 0,01
LDL 85,60±21,05 120,46±30,99 115,18±25,68 116,00±37,80 0,13
HDL 60,60±8,44 55,07±10,58 46,56±7,79 41,87±7,39 0,01
⃰
) Anova Test
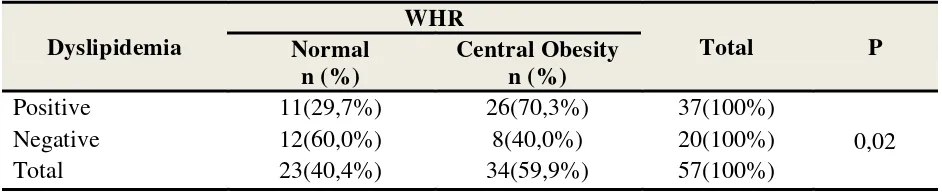
Effect of Waist-to-hip Ratio on Lipid Profile
In the positive dyslipidemic subjects, the highest proportion was observed in 70,3%
WHR subjects with central obesity (26 subjects) compared to 29,7% normal WHR subjects (11
subjects). Whereas in negative dyslipidemic subjects, the highest proportion was observed within
the normal WHR group as much as 60,0% (12 subjects) compared to 40% WHR subjects with
central obesity (8 subjects). Using Chi-Square tests, a statistically significant association was
observed between WHR and dyslipiemia with a p value<0,05 (p=0,02) (Table 6).
Table 6. Association between Dyslipidemia and WHR in Study Subjects
Dyslipidemia
WHR
Total P
Normal n (%)
Central Obesity n (%)
Positive 11(29,7%) 26(70,3%) 37(100%)
0,02
Negative 12(60,0%) 8(40,0%) 20(100%)
Total 23(40,4%) 34(59,9%) 57(100%)
⃰ ) Chi-square Test
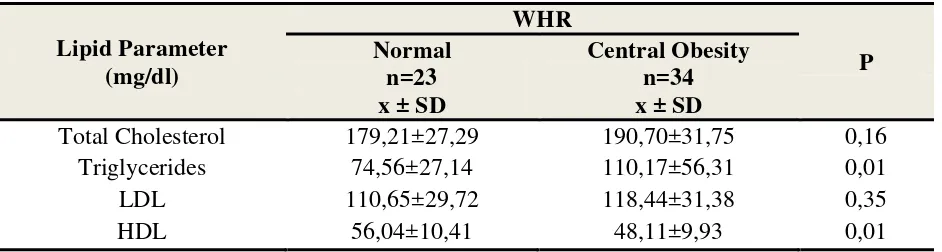
After comparing lipid profiles in both WHR groups, higher average total cholesterol,
triglycerides, and LDL levels were observed with lower HDL levels observed within the central
obesity WHR group compared to normal WHR subjects, although only average tryglicerides and
value<0,05 (p=0,01). Whereas no statistically significant difference of average total cholesterol
and LDL levels were observed based on WHR classifications with a p value>0,05 (p=0,13 and
0,34) (table 7).
Tabel 7. Lipid Profile Comparison based on WHR in Study Subjects
Lipid Parameter (mg/dl)
WHR
P Normal
n=23 x ± SD
Central Obesity n=34 x ± SD
Total Cholesterol 179,21±27,29 190,70±31,75 0,16
Triglycerides 74,56±27,14 110,17±56,31 0,01
LDL 110,65±29,72 118,44±31,38 0,35
HDL 56,04±10,41 48,11±9,93 0,01
⃰
) Student T-test
DISCUSSION
This research was conducted to assess the association between lipid profiles with insulin
resistance and obesity markers in Indonesian women with PCOS. We can observe a high
insidence of dyslipidemia in PCOS patients, as much as 64,9%. Thus a high prevalence of
dyslipidemia is almost equivalent to that reported in the National Cholesterol Education Program
stating that 70% of women with PCOS were observed with at least one elevated lipid or
borderline level.
The proportion of subjects observed with insulin resistance was 14% (8 subjects) lower
than subjects with insulin-sensitive group as much as 86% (49 subjects). This proportion was
equivalent with the results obtained from a research conducted by Adrian S, et al (2008) in his thesis stating that the prevalence of insulin resistance in patients with PCOS as much as 17,1% (7
out of 41 subjects).9 Dunaif (1989) and Legro, et al (2004) in their study stated that the prevalence of insulin resistance varied from 25 to 70% depending on ethnic origin and the
method used.10,11
Based on BMI and WHR characteristics, 49,1% subjects were observed with a
normoweight BMI and 59,6% were observed with central obesity based on WHR. These findings This difference is possibly caused by the ethnical variation of the subjects
were different to the results obtained from a study conducted by Hamburg et al (2003) that reported that PCOS patients are generally observed with certain clinical manifestations such as
weight gain and obesity.12 But when it concerns WHR, these findings are similar to the results
obtained by Lim SS et al (2012) stating that women with PCOS are observed with an increased prevalence of overweight (RR {95%,CI}; 1,95 {1,52, 250}), obesity (2,77 {1,88; 4,10}) and
central obesity (1,73 {1,33, 2,30)13
The association or effect of insulin resistance on lipid profile in patients with PCOS
reported in this study resembled a study conducted by Hong Y, et al (2011) reporting that the prevalence of dyslipidemia is significantly higher in patients with insulin resistance compared to
subjects without insulin resistance (39,9% vs 15,2%, p<0,005). .
14
It also likened the result
obtained by Kalra A, et al (2006) that studied the association between obesity and insulin resistance with dyslipidemia in 65 Indian women with PCOS. PCOS subjects observed with
insulin resistance were observed with significantly higher lipid profile levels (trigliceride levels,
higher total cholesterol levels and lower HDL levels) compared to PCOS women who were
insulin sensitive. The total cholesterol (P=0,002), triglyceride (P< 0,001), and HDL level
difference between these 2 groups were statistically significant, except for the LDL levels
(P<0,07), where no significant difference was observed.15
BMI and WHR also affected lipid profile in PCOS patients where the prevalence of
positive dyslipidemic patients were mostly found in the overweight-obese group as much as
51,2% and subjects with central obesity as much as 70,3% compared to the
normoweight-underweight group and non-central obesity patients. These findings were similar to the results
obtained by Annamaria F et al (2007) and Ali C et al (2007) that reported that WHR and WC both indicated the events of dyslipidemia. WHR and WC are more strongly correlatedcompared
to BMI and triglyceride, total cholesterol, LDL, and HDL total cholesterol level ratios. Among
all lipid profile parameters, WHR has the most significant correlation with triglyceride levels. No significant difference were
observed in total cholesterol and LDL mean levels based on insulin resistance obtained from
these 2 studies between the 2 group (insulin resistant and insulin sensitive) which is possibly
caused by difference between subjects affected by genetic and environmental factors along with
the amount of study samples which in this case were observed in a limited number.
But in this study the most significant difference was observed in triglyceride and HDL levels,
especially in higher triglyceride mean levels and lower HDL mean levels in overweight-obese
and central obesity subjects compared to normoweight-underweight and non-central obesity
subjects. Whereas no significant difference was observed in mean total cholesterol and LDL
levels based on BMI and WHR.
The presence of a significant association between lipid profiles and insulin resistance and
obesity markers (BMI and WHR) in PCOS subjects that cause reproductive and metabolic
disturbances, would consequently result in recommending the patient to achieve an ideal body
weight by reducing the amount of calory intake together with regular exercise, taking statin
drugs to treat dyslipidemia, and administering insulin sensitizing agents such as metformin,
rosiglitazone, and pioglitazone to treat insulin resistance.
CONCLUSION
This study confirmed a significant association between dyslipidemia and insulin
resistance and obesity markers in women with PCOS. Whereas the prevalence rate of
dyslipidemia, insulin resistance, overweight-obese, and central obesity is subsequently 64,9%,
14%, 42,1%, and 59,6%.
REFERENCES
1. Saha S, Sarkar C, Biswas SC, and Karim R Correlation between serum lipid profile and carotid intima-media thickness in polycystic ovarian syndrome. Indian Journal of Clinical Biochemistry, 2008 / 23 (3) 262-266.
2. Wild RA. Dyslipidemia in PCOS. Steroids, 2011/ 10.1016/j.steroids.2011.12.002.
3. Banaszewska B, Duleba AJ, Spaczynski RZ, et al. Lipids in Polycystic Ovary Syndrome: Role of Hyperinsulinemia and Effects of Metformin. American Journal of Obstetrics and Gynecology, 2005 / 10.1016/j.ajog.2005.11.009.
5. Speroff L, and Fritz AM. Clinical Gynecologic Endocrinology and Infertility: Chronic Anovulation and the Polycystic Ovary Syndrome. 8 th edition. Lippincott Williams & Wilkins. North Caroline: 2011. p:495-531.
6. Fulghesu A, and Magnini R. Obesity Related Lipid Profile And Altered Insulin Incretion In Adolescent With Policystic Ovary Syndrome. Department Of Obstetrics And Gynecology, University Of Cagliari.
7. Kalra A, Nair S, and Rai L. Association of obesity and insulin resistance with dyslipidemia in Indian women with polycystic ovarian syndrome. Indian J Med Sci. 2006 Nov; 60(11): 447-53
8. Diamanti-Kandrakis E, Papavassilou AG, Kandrakis SA, et al. Pathophysiology and Types Of Dyslipidemia in PCOS. TRENDS in Endocrinology and Metabolism 2007. Vol 18 No 7.
9. Adrian S. Identifikasi Resistensi Insulin Pada Pasien PCOS Dengan Menggunakan Fasting Glucose/Insulin Ratio (G:I Ratio). Departemen Obstetri dan Ginekologi Fakultas Kedokteran Universitas Sumatera Utara Medan, Juni 2008.
10. Dunaif A, Segal KR, Futterweit W & Dobrjansky A (1989b). Profound peripheral insulin resistance, independent of obesity, in polycystic ovary syndrome. Diabetes 38 (9): 1165-1174.
11. Legro RS., Castracane VD, and Kauffman RP (2004). Detecting insulin resistance in polycystic ovary syndrome: purpose and pitfalls. Obstet Gynecol Surv 59, 141-154
12. Homburg, R. The management of infertility associated with polycystic ovary syndrome. Reproductive Biology and Endocrinology. 2003;1
13. Lim SS, Davies MJ, and Norman RJ, et al. Overweight, obesity and central obesity in women with polycystic ovary syndrome: a systematic review and meta-analysis. Hum Reprod Update, 2012 Nov-Dec: 18 (6): 618-37.doi: 10.1093/humuid/dms030.Epub 2012 Jul 4.
14.
insulin resistance in Chinese women with polycystic ovary syndrome.
2011 Jul-Sep;25(3):365-74
16. Annamaria F. and Roberta M. Obesity Related Lipid Profile and Altered Insulin Incretion in Adolescent with Policystic Ovary Syndrome. Department of Obstetrics and Gynecology, University of Cagliari, Cagliari,Italy, 2006