WINGS TO YOUR THOUGHTS…..
IIR and FIR Digital Filter:A Case Study
F. Zainal
1, N. M. Z. Hashim
2, K. A. A. Aziz
3,
A. Salleh
4, N. R. Mohamad
5, A. S. Ja’afar
61, 2 , 4, 5, 6
Center for Telecommunication Research & Innovation (CeTRI), Faculty of Electronic and Computer Engineering, Universiti Teknikal Malaysia Melaka, 76100 Hang Tuah Jaya, Durian Tunggal, Melaka, Malaysia.
1
[email protected], [email protected], [email protected], [email protected], [email protected]
3
Faculty of Engineering Technology, Universiti Teknikal Malaysia Melaka, 76100 Hang Tuah Jaya, Durian Tunggal, Melaka, Malaysia.
Abstract: — this paper is about to analyze and identify the digital audio signal. Two audio signals are provided which is the original audio and the added noise audio signal. The purpose of the study is to identify and eliminate the unknown noise signals by using Finite Impulse Response and Infinite Impulse Response digital filters. The detail steps to design the both have been stated in this paper. All the results is simulated and showed in MATLAB to show the comparison between the two.
Keywords- FIR, IIR, MATLAB, noise, sampling frequency, passband frequency, stopband frequency.
1.
INTRODUCTION
Filters are the most essential component used in signal processing and telecommunication system[1]. The main functions of filter are to confine a signal into a prescribed frequency, to decompose a signal into two or more sub-band signals processing and modify the frequency spectrum of a signal. There are 2 most primary types of the digital filter used in Digital Signal Processing (DSP) application which is Finite Impulse Response (FIR) and Infinite Impulse Response (IIR)[2]–[7]. There are several advantages of the digital filters compared to the analog
filters which digital filters’ performance does not vary
with environment[8]–[12]. Digital filters also can be operated at very low frequencies and have a wide range of frequencies by mere change to the sampling frequency. In this study, both FIR and IIR filter is designed to filter out the unwanted noise from the noise audio signal. IIR filter can be used when the only important requirements are sharp cutoff and high throughput, as it requires fewer coefficients than FIR filter. However, FIR filter should be used whenever a large number of filter coefficients and phase distortion is desired. Both FIR and IIR filter design have their own pros and cons in certain application. Therefore when a digital filter is to be designed, type of filter need to be clarify either suitable in the situation or not.
2.
METHODOLOGY
a. Original Sound Analysis
i. MATLAB Programming Code %get original audio file
[x,Fo] = audioread('G1o.wav');
%get time based
to=(1/Fo:1/Fo:length(x)/Fo);
%plot the Original Waveform in Time Domain subplot(2,1,1); plot(to,x);
grid;
title('Original Waveform in Time Domain');
xlabel('Time');ylabel('Amplitude');
%plot the Original Waveform in Frequency Domain subplot (2,1,2);
m=length(x)-1;
fo=0:Fo/m:Fo;
%perform FFT for original waveform xfft=abs(fft(x)); plot(fo,xfft);
grid;
title('Original Waveform in Frequency Domain');
xlabel('Frequency');ylabel('Magnitude');
ii. MATLAB Waveform Output
Figure 1: Original Audio Signal Waveform
A. Noise Sound Analysis
i. MATLAB Programming Code %get noise audio file
[y,Fn] = audioread('G1n.wav');
%get time based on sampling frequency for G1n.wav tn=(1/Fn:1/Fn:length(y)/Fn);
%plot the Noise Waveform in Time Domain subplot(2,1,2); plot(tn,y);
grid;
title('Noise Waveform in Time Domain');
xlabel('Time');ylabel('Amplitude');
%plot the Noise Waveform in Frequency Domain subplot(2,1,2);
title('Noise Waveform in Frequency Domain');
WINGS TO YOUR THOUGHTS….. ii. MATLAB Waveform Output
Figure 2: Noise Audio Signal Waveform
B. Specification Design
Figure 3: Define Passband and Stopband Frequency
From observation of the original sound wave and noise sound wave, required specification for designing the digital filter as below[13-29].
Sampling Frequency, = 16000Hz Passband Frequency, = 3300Hz
= 0.4125π
Stopband Frequency, = 3500Hz = 0.4375π
Besides that, from the waveform, assumptions of several variables are defined.
Peak Passband Deviation, = 1 dB Stopband Deviation, = 50
Minimum Stopband Deviation, = 34 dB
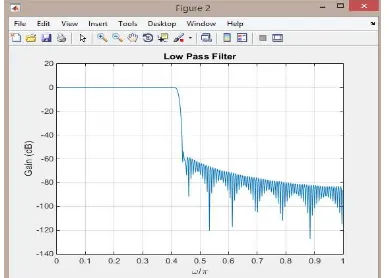
C. FIR Filter Design i. Design Calculation
From the observation, the minimum stopband deviation was 34dB. Therefore, Hanning window is chosen as the value obtain was the nearest with less than 44dB.
Then the transition bandwidth is calculated.
Based on the transition bandwidth, the length of Hanning window is obtained by
ii. MATLAB Programming Code %filter design
fs = 3500; %stopband frequency
fp = 3300; %passband frequency
ft = 16000; %sampling frequency
Wn = (fs+fp)/ft; %Window-based fir filter design a = fir1(248,Wn,hann(Wn)); %plot the frequency response freqz(a,1);
figure(2);
%plot the low pass filter plot(w/pi, 20*log10(abs(h)));
title('Low Pass Filter');
xlabel('\omega/\pi');ylabel('Gain (dB)');
grid;
iii. MATLAB Waveform Output
Figure 4: Frequency Response of the FIR Filter (1)
Figure 5: Frequency Response of the FIR Filter (2)
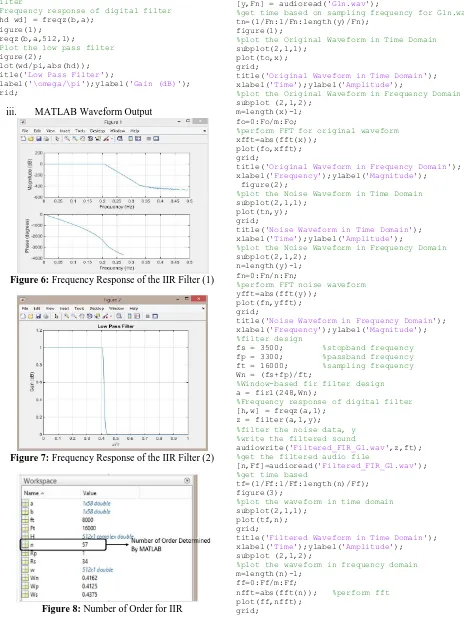
D. IIR Filter Design i. Design Calculation
From the design specification obtained, cutoff frequency of the design filter is calculated as below.
All the design specification in coding in
MATLAB and the function of “buttord” is used
to calculate the order of the filter design as well as the cutoff frequency.
ii. MATLAB Programming Code %filter design
WINGS TO YOUR THOUGHTS…..
%Butterworth filter order and cutoff frequency [n,Wn] = buttord(Wp,Ws,Rp,Rs);
[b,a] = butter(n,Wn); %perform butterworth
filter
%Frequency response of digital filter [hd wd] = freqz(b,a);
figure(1);
freqz(b,a,512,1); %Plot the low pass filter figure(2);
plot(wd/pi,abs(hd));
title('Low Pass Filter');
xlabel('\omega/\pi');ylabel('Gain (dB)');
grid;
iii. MATLAB Waveform Output
Figure 6: Frequency Response of the IIR Filter (1)
Figure 7: Frequency Response of the IIR Filter (2)
Figure 8: Number of Order for IIR
3.
RESULT
A. FIR Filter Design i. MATLAB Coding %get original audio file
[x,Fo] = audioread('G1o.wav');
%get time based on sampling frequency for G10.wav to=(1/Fo:1/Fo:length(x)/Fo);
%get noise audio file
[y,Fn] = audioread('G1n.wav');
%get time based on sampling frequency for G1n.wav tn=(1/Fn:1/Fn:length(y)/Fn);
figure(1);
%plot the Original Waveform in Time Domain subplot(2,1,1); plot(to,x);
grid;
title('Original Waveform in Time Domain');
xlabel('Time');ylabel('Amplitude');
%plot the Original Waveform in Frequency Domain subplot (2,1,2);
m=length(x)-1; fo=0:Fo/m:Fo;
%perform FFT for original waveform xfft=abs(fft(x)); plot(fo,xfft);
grid;
title('Original Waveform in Frequency Domain');
xlabel('Frequency');ylabel('Magnitude');
figure(2);
%plot the Noise Waveform in Time Domain subplot(2,1,1); plot(tn,y);
grid;
title('Noise Waveform in Time Domain');
xlabel('Time');ylabel('Amplitude');
%plot the Noise Waveform in Frequency Domain subplot(2,1,2);
title('Noise Waveform in Frequency Domain');
xlabel('Frequency');ylabel('Magnitude');
%filter design
%Frequency response of digital filter [h,w] = freqz(a,1);
z = filter(a,1,y); %filter the noise data, y %write the filtered sound
audiowrite('Filtered_FIR_G1.wav',z,ft);
%get the filtered audio file
[n,Ff]=audioread('Filtered_FIR_G1.wav');
%get time based
tf=(1/Ff:1/Ff:length(n)/Ff); figure(3);
%plot the waveform in time domain subplot(2,1,1); plot(tf,n);
grid;
title('Filtered Waveform in Time Domain');
xlabel('Time');ylabel('Amplitude');
subplot (2,1,2);
%plot the waveform in frequency domain m=length(n)-1;
ff=0:Ff/m:Ff;
nfft=abs(fft(n)); %perform fft
WINGS TO YOUR THOUGHTS…..
title('Filtered Waveform in Frequency
Domain');
xlabel('Frequency');
ylabel('Magnitude');
ii. MATLAB Waveform Output
Figure 9: Result of Original Audio Signal Waveform
Figure 10: Result of Noise Audio Signal Waveform
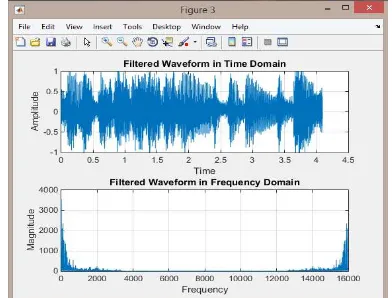
Figure 11: Result of Filtered Waveform by FIR
Filter B. IIR Filter Design
i. MATLAB Coding %get original audio file
[x,Fo] = audioread('G1o.wav');
%get time based on sampling frequency for G10.wav
to=(1/Fo:1/Fo:length(x)/Fo); %get noise audio file
[y,Fn] = audioread('G1n.wav');
%get time based on sampling frequency for G1n.wav
tn=(1/Fn:1/Fn:length(y)/Fn); figure(1);
%plot the Original Waveform in Time Domain subplot(2,1,1); plot(to,x);
grid;
title('Original Waveform in Time Domain');
xlabel('Time');ylabel('Amplitude');
%plot the Original Waveform in Frequency Domain subplot (2,1,2);
m=length(x)-1; fo=0:Fo/m:Fo;
%perform FFT for original waveform xfft=abs(fft(x)); plot(fo,xfft);
grid;
title('Original Waveform in Frequency Domain');
xlabel('Frequency');ylabel('Magnitude');
figure(2);
%plot the Noise Waveform in Time Domain subplot(2,1,1); plot(tn,y);
grid;
title('Noise Waveform in Time Domain');
xlabel('Time');ylabel('Amplitude');
%plot the Noise Waveform in Frequency Domain subplot(2,1,2);
title('Noise Waveform in Frequency Domain');
xlabel('Frequency');ylabel('Magnitude');
%filter design
%Butterworth filter order and cutoff frequency [n,Wn] = buttord(Wp,Ws,Rp,Rs);
[b,a] = butter(n,Wn); %perform butterworth filter
%Frequency response of digital filter
[H,w] = freqz(b,a,512,1);
z = filter(b,a,y); %filter with noise sound
%Frequency response of digital filter
[hd wd] = freqz(b,a); %write the new filtered sound
audiowrite('Filtered_IIR_G1.wav',z,Ft);
%get filtered audio file
[n Ff] = audioread('Filtered_IIR_G1.wav');
%get time based on sampling frequency for G10.wav tf=(1/Ff:1/Ff:length(x)/Ff);
figure(3);
%plot the waveform in time domain subplot(2,1,1); plot(tf,n);
grid;
title('Filtered Waveform in Time Domain');
xlabel('Time');ylabel('Amplitude');
subplot (2,1,2);
%plot the waveform in frequency domain m=length(n)-1;
title('Filtered Waveform in Frequency Domain');
xlabel('Frequency');
WINGS TO YOUR THOUGHTS….. ii. MATLAB Waveform Output
Figure 12: Result of Original Audio Signal Waveform
Figure 13: Result of Noise Audio Signal Waveform
Figure 14: Result of the Filter Waveform by IIR Filter
4.
DISCUSSION
FFT, it is observed that the waveform is in “mirroring”
at the frequency of 8000Hz. This is due to the effect of Nyquist Sampling theorem after perform the FFT.
Therefore, the frequency domain waveform is “folding”, “mirroring” or “symmetry” at the point of 8000Hz. After identifying the effect of Nyquist Sampling theorem after perform FFT, and then the signal can be observed as the unwanted noise is appeared at the high frequency band which is above 3500Hz as shown in the Figure 2. Therefore, it is decide to design the low pass filter. Then it is important to figure out the passband frequency and the stopband frequency when designing the filter which can be observed and decided from the noise signal as shown in Figure 2. After that, the passband deviation and stopband deviation also can be determined and decided from the response filter design. In the IIR filter design, Butterworth filter is chosen as the design provided monotone in passband and stopband which is no ripple with the maximally flat in passband.
The MATLAB function of “buttord” is used to calculate the minimum order of a digital Butterworth filter and the cutoff frequency to meet the filter design specifications
while “butter” is to create the IIR Butterworth filter. After designing both of the filters, the frequency response is plotted to ensure the filter design obtained is correctly. The filtered audio signal is then written into a new “.wav” file. As the result, the unwanted noise signal is being filtered as shown in the Figure 11 and Figure 14. The quality of filtered audio signal is not as good as the original audio signal due to some signal still existing within the range of the noise signal. Both FIR and IIR filter also has the same problem in term of the quality are being reduced, however, in general the noise signal is being filtered out and the objective is being achieved.
5.
CONCLUSION
At the end of this study, the digital audio signals could be recognized in both time domain and frequency domain waveform. By comparing the frequency domain waveform, the unwanted noise signal can be recognized. The entire unwanted noise signal has been filtered by using FIR and IIR filter.
Acknowledgement
We are grateful to Centre for Telecommunication Research and Innovation (CeTRI) and Universiti Teknikal Malaysia Melaka (UTeM) through PJP/2013/FKEKK (29C)/S01215 for their kind and help for supporting financially and supplying the electronic components and giving their laboratory facility to complete this study.
References
[1] S. K. Mitra, Digital Signal Processing: A
WINGS TO YOUR THOUGHTS…..
[2] R. A. Hamzah, M. A. Hamid, H. N. Rosly, N. M. Z.
Hashim, and Z. A. F. M. Napiah, “An Aligned
Epipolar Line for Stereo Images with Multiple Sizes ROI in Depth Maps for Computer Vision
Application,” International Journal of
Information and Education Technology, vol. 1, no.
1, pp. 15–19, 2011.
[3] R. A. Hamzah, M. S. Hamid, H. N. Rosly, and N.
M. Z. Hashim, “A distance and pixel intensity
relation for disparity mapping in region of
interest,” 2011 IEEE 3rd International
Conference on Communication Software and
Networks, pp. 15–19, May 2011.
[4] R. A. Hamzah, M. S. Hamid, H. N. Rosly, and N.
M. Z. Hashim, “An analysis of multiple size
region of interest in disparity mapping for stereo
vision application,” 2011 IEEE Symposium on
Computers & Informatics, no. 1, pp. 192–196,
Mar. 2011.
[5] NMZ Hashim, NMTN Ibrahim, Z Zakaria,
Fadhli Syahrial, H Bakri,” Development New
Press Machine using Programmable Logic
Controller,” International Journal Of
Engineering And Computer Science, vol. 2, no. 8, pp. 2310-2314, 2013.
[6] NMZ Hashim, NA Ibrahim, NM Saad, F
Sakaguchi, Z Zakaria,” Barcode Recognition System,” International Journal of Emerging
Trends & Technology in Computer Science, vol. 2, no. 4, pp. 278-283, 2013.
[7] A Salleh, NR Mohamad, MZA Abd Aziz, MH
Misran, MA Othman, NMZ Hashim,” Simulation
of WiMAX System Based on OFDM Model with
Difference Adaptive Modulation Techniques,”
International Journal of Computer Science and Mobile Computing, vol. 2, no. 9, pp. 178-183, 2013.
[8] NMZ Hashim, NB Hamdan, Z Zakaria, RA
Hamzah, A Salleh,” Flood Detector Emergency
Warning System,” International Journal Of
Engineering And Computer Science, vol. 2, no. 8, pp. 2332-2336, 2013.
[9] NR Mohamad, ASAM Soh, A Salleh, NMZ
Hashim, MZA Abd Aziz, N Sarimin, A Othman,
ZA Ghani “Development of Aquaponic System
using Solar Powered Control Pump,” IOSR
Journal of Electrical and Electronics Engineering (IOSR-JEEE), vol. 8, no. 6, pp. 01-06, 2013.
[10] A Salleh, NR Mohamad, MZ A Abd Aziz, NMZ
Hashim, MH Misran, MA Othman, “Design the
High Gain and Low Power Amplifier for Radio
over Fiber Technology at 2.4 GHz,” American
Journal of Engineering Research, vol. 2, no. 9, pp. 163-170, 2013.
[11] A Salleh, MZA Abd Aziz, NR Mohamad, MH
Misran, MA Othman, NMZ Hashim, “Simulation
of 2.4 GHz Low Power RF Front End Design for
Radio over Fiber Technology,” International
Journal of Emerging Trends in Engineering and Development, vol. 5, no. 3, pp. 345-354, 2013.
[12] SH Husin, MYN Hassan, NMZ Hashim, Y Yusop,
A Salleh, “Remote Temperature Monitoring And Controlling,” International Journal for Advance
Research in Engineering and Technology, vol. 1, no. 8, pp. 40-47, 2013.
[13] NMZ Hashim, MHA Halim, H Bakri, SH Husin,
MM Said, “Vehicle Security System Using Zigbee,” International Journal of Scientific and
Research Publications, vol. 3, no. 9, pp. 03-09, 2013.
[14] SH Husin, AA Ngahdiman, NMZ Hashim, Y
Yusop, AS Ja’afar, “Home Electrical Appliances Smart System,” International Journal of
Computer Science and Mobile Computing, vol. 2, no. 9, pp. 85-91, 2013.
[15] A Jaafar, N Arasid, NMZ Hashim, A Latiff, Hazli
Rafis, “Three Bit Subtraction Circuit via Field
Programmable Gate Array,” International
Journal for Advance Research in Engineering and Technology, vol. 1, no. 8, pp. 01-06, 2013.
[16] AS Ja’afar, NMZ Hashim, AAM Isa, NA Ali, AM
Darsono, “Analysis of Indoor Location and
Positioning via Wi-Fi Signals at FKEKK, UTeM,”
International Journal of Engineering and
Technology, vol. 5, no. 4, pp. 3570-3579, 2013.
[17] KAA Aziz, N Mohamood, MNZ Hashim, “Sliding
Window for Radial Basis Function Neural
Network Face Detection,” International Journal
of Science and Engineering Applications, vol. 3, no. 2, pp. 94-97, 2014.
[18] KAA Aziz, RA Ramlee, NMZ Hashim, RA
Rahman, “Machine Vision Based Height Measuring System,” International Journal of
Research in Advent Technology, vol. 2, no. 8, pp. 48-50, 2014.
[19] MHA Ilmudin, NMZ Hashim, AS Ja’afar, A
Salleh, A Jaafar, MFM Sam, “Traffic Light
Control System using 434 MHz Radio
Frequency,” International Journal of Research in
Advent Technology, vol. 2, no. 8, pp. 26-31, 2014.
[20] A Salleh, NR Mohanad, NMZ Hashim, MZA Abd
Aziz, MH Misran, “Design of Wideband
Microstrip Bandpass Filter for S-Band
Application,” Australian Journal of Basic and
Applied Sciences, vol. 8, no. 4, pp. 843-848, 2014.
[21] KA Muhamad, NMZ Hashim, WMSW Azman,
NR Mohamad, “Digital Images Restoration
Application in Digital Signal Processing,”
International Journal of Emerging Technology & Research, vol. 1, no. 6, pp. 79-83, 2014.
[22] SS Razali, N M Z Hashim, S Z Yahya, K A A
Aziz, A Salleh, N R Mohamad, “Different
Approach of Video Compression Technique: A
Study,” International Journal of Science and
Engineering Applications, vol. 3, no. 5, pp. 143-149, 2014.
[23] D Jalaputhra, N M Z Hashim, M Izhan Ibrahim,
A S Ja'afar, A Salleh, N R Mohamad.
“Application of Digital Signal Processing In Echo
WINGS TO YOUR THOUGHTS…..
Science and Engineering Applications, vol. 3, no. 5, pp. 150-153, 2014.
[24] NMZ Hashim, HH Basri, A Jaafar, MZAA Aziz,
A Salleh, AS Ja'afar, “Child In Car Alarm System Using Various Sensors,” Journal of
Engineering & Applied Sciences, vol. 9, no. 9, pp. 1653-1658, 2014.
[25] NMZ Hashim, MR Anuar, A Jaafar, MZAA Aziz,
A Salleh, AS Ja'afar, “Graphical User Interface
For Wireless Patient Monitoring System Using
Zigbee Communication,” Journal of Engineering
& Applied Sciences, vol. 9, no. 9, pp. 1554-1558, 2014.
[26] A Jaafar, MS Omar, NMZ Hashim, KAA Aziz,
NAA Hadi, “Booth’s Algorithm Design Using Field Programmable Gate Array,” International
Journal For Advance Research In Engineering And Technology, vol. 2, no. 7, pp. 86-93, 2014.
[27] A Jaafar, MM Lazim, NMZ Hashim, A Salleh, AS
Jaafar, “Division Algorithm Design Using Field Programmable Gate Array,” International
Journal For Advance Research In Engineering And Technology, vol. 2, no. 7, pp. 95-104, 2014.
[28] SAWAS Mokhtar, NMZ Hashim, NR Mohamad,
A Jaafar, A Salleh, “Vehicle Security System Using ZigBee Technology,” International Journal
For Advance Research In Engineering And Technology, vol. 2, no. 7, pp. 81-85, 2014.
[29] A Salleh, NMZ Hashim, NR Mohamad, NAA
Hadi, MZA Ab Aziz, “Development of High
Performance and Low Cost Automatic Toll Payment System using RFID Technology for
Malaysia Environment,” International Journal