EXPLORING THE IMPACTS OF CLEANER PRODUCTION ON
MANUFACTURING SUSTAINABILITY IN MALAYSIA - AN INITIAL STUDY
Wan Hasrulnizzam Wan Mahmood1, Muhamad Zaki Yusup1, 2, Mohd Rizal Salleh1, Rafidah Amat3 1Sustainable and Responsive Manufacturing Research Group, Faculty of Manufacturing Engineering, Universiti Teknikal Malaysia Melaka, 76100 Hang Tuah Jaya, Melaka, Malaysia
2
Department of Quality and Productivity, Kolej Kemahiran Tinggi MARA Kuantan, Km 8, Jalan Gambang, 25150 Kuantan, Pahang, Malaysia
3
Department of Language Studies, Universiti Teknologi MARA Cawangan Kedah, P.O.Box 187, 08400 Merbok, Kedah, Malaysia Correspondent Email: [email protected]
ABSTRACT : The ability to adapt with cleaner production in various dimensions of manufacturing successfully increases the sustainability in production operations. Driven by the opportunity for improvement, this study was undertaken to explore the extent to which cleaner production practice influences the level of manufacturing sustainability in the context of the
Malaysian industry. The findings from this initial study showed that the execution performance of this practice on a regular and systematic basis brings positive effects on all the necessary components in establishing sustainable manufacturing particularly to the environment, economy and competency. Emphasis on systematic environmental management practice has been found to encourage comprehensive actions in addressing the environmental concerns. This subsequently increases the competency in management and operation, which eventually provide benefits for financial and environmental performance. Moreover, the findings can be used as a referral for the next research, primarily in formulating a comprehensive strategy in achieving sustainability in manufacturing, as well as enhancing the continuity of business in the future.
KEYWORDS: Cleaner Production, Manufacturing Sustainability, Malaysia, Initial Study
1.0 INTRODUCTION
Cleaner Production (CP) is a prevention strategy that can be integrated into every stage of the production process, either to increase productivity or to improve the environmental management performance that eventually influences the ecological performance from the manufacturing activity. The adoption of the CP practice has also encouraged more proactive actions in controlling the processes and the operation costs, especially with regard to the conservation and maintenance of the environment. Moreover, the use of technology in continuous improvement activities that is in line with the CP practice potentially reduces the risk to humans and the environment. This significantly contributes to the transformation actions in the economy, particularly in order to achieve a sustainable development in manufacturing scenarios [1, 2].
Nowadays, there are various dynamic challenges to be faced to remain competitive in the global economic paradigm. Therefore, the execution of CP practice through a meticulous strategy is able to streamline the ability of manufacturers in achieving high performance in manufacturing sustainability [3]. Besides, it not only influences the ecological and economic performance, but can improve the efficiency in production operations and increase the competitiveness, which ultimately improves economically [4]. Therefore, this article will discuss the result of the study that was carried out to identify the extent the CP practice is able to influence the level of sustainability in manufacturing activities, particularly in Malaysia’s manufacturing industry. Based on three components, namely environmental sustainability (SEP), economic sustainability (SCP) and competency sustainability (SSC), this initial study was carried out to measure and examine how the performance of the CP practice can affect the development level of manufacturing sustainability in Malaysia. This finding may be used as a prefix strategy to formulate a plan and appropriate actions in strengthening the adaptation of CP
practice among Malaysia’s manufacturing companies, primarily in achieving a high level of sustainability in
Malaysia’s manufacturing climate.
RESEARCH METHOD
The data in this study were obtained from a structured questionnaire that was mailed to 340 respondents who are among the top management personnel from Malaysia’s manufacturing industry. This questionnaire consists of 26 items related to CP, 19 items related to environmental sustainability (e), 21 items on economic sustainability (c) and 23 items on sustainability in social competency (s). Each respondent who has more than 2 years of working experience at the same manufacturing organisation is requested to identify a ranking for each statement in the questionnaire using a seven Likert scale (e.g. 1 = Strongly disagree to 7 = strongly agree), which can reflect the practice and current performance of production operations. In this initial study, a total of 47 sets of questionnaire representing 13.8 percent of the respondents were returned. However, based on the reliability test, only 46 sets of questionnaires for the component of SEP and 44 sets of questionnaire respectively, for CP, SCP and SSC are considered valid for the analysis at this time.
2.0 RESULTS AND DISCUSSION
than 150 employees (30.7%), while only 20.5 percent operate with a capacity of more than 750 employees. This depends on the nature of the operation and the manufacturing systems adopted by the particular company. Moreover, 50.6 percent of the respondents work with organisations that have more than 10 years of experience with the ISO14001 management system practice. The
Cronbach’s alpha reliability test shows that all four components in the questionnaire have high internal consistency level with a psychometric score of 0.966 for CP, 0.976 for SEP, 0.981 for SCP and 0.977 for SSC.
2.1
Performance of Manufacturing SustainabilityThe respondents agreed that all the statements used to measure SEP have reflected the current sustainability performance in environment where the ability to have a better control on environmental practice (e19) has the highest mean score of 5.81. This is in line with the result where the respondents admitted that there was an increase in environmental management practices performance (e9) and proactive actions in planning to reduce waste and each item has a mean score of 5.68. This was followed by the awareness to consider the impact on the environment during the adaptation process of manufacturing system (e18) with the production process which is indicated by a mean score of 5.55. However, the respondents acknowledged that the consideration to use recycled materials in the production process and product (e2) and the ability to adopt the concept of recycling and reusing in product design is still relatively low when both items have low mean scores of 5.04 and 4.85 respectively.
As for SCP, the respondents admitted that the ability to improve the quality of products produced (c5) has the most significant impact on the sustainability of economics as indicated by the highest mean score of 6.06. This is followed by a high focus on reducing non-value added activity (c6) and the increases of value-added activity in production operation (C7) at the mean scores of 6.02 and 6.00 respectively. Moreover, the respondents also agreed that sustainability in manufacturing has increased the sustainability in the economy, which eventually increases the business and financial performance (c2) and this is shown by the mean score of 5.87. This subsequently contributes to the ability to reduce the overall operating costs (c8) and the appropriate action in purchasing the material, components and resource management (c16) at a mean score of 5.83 respectively. Conversely, the ability to use renewable energy in the production process and transport (c15) and reduce the number of parts or components in products (c20) are at the lowest position with mean scores of 5.11 and 4.87.
Meanwhile, for SSC, the respondents agreed that a high competency level in the compliance of environmental safety regulations (s14) was at the highest ranking with a mean score of 6.30. This was followed by the efficiency in managing employee’s safety and housekeeping at workplace (s1) at a mean score of 6.26. The respondents also agreed the competency in increasing the environment management was underpinned by the holistic approach in environmental policy (s19), which subsequently influences the ability to
score of 6.13, respectively. However, the competency to improve the customization of the production process (s2) is still low at a mean score of 5.71. Besides that, the collaboration with the local communities on environmental issues also is still low at the lowest mean score of 5.52. The distributions of the mean scores for all the items on sustainable manufacturing in this initial study are shown in Figure 1.
These results show that most manufacturing companies in Malaysia always ponder on the action in increasing the environmental sustainability performance while constantly being aware of the importance of addressing the concerns over environmental issues. This is consistent with the results that demonstrated the importance of compliance to rules for regulating environmental issues which were at the highest ranking, along with a comprehensive planning to meet environmental policies that have been developed. This further contributes in encouraging the action to be taken in improving operational efficiency, productivity and control of resources. The efficiency in resource utilisation, optimisation of material usage and reduction of industrial waste, eventually produce a positive effect on financial and ecological performance [5], which ultimately influence the sustainability in economic and environmental aspects. Moreover, it also increased the return on investment (ROI) at a higher level [6].This is because the awareness of each activity has been essential to ensure business continuity remains competitive for a long time [7]. Nevertheless, this initial study shows the usage of recycled materials and renewable energy is still low. This is due to the low degree
of customization production process for Malaysia’s
manufacturing industry. This is possibly influenced by the nature of business and the type of products that have been produced. Although high awareness on environmental has been recorded, the results have shown there is a low collaboration between the manufacturer and the local community and authorities which potentially create a low acceptable level in the regulation of environmental. This is consistent with the results shown among the three components on manufacturing sustainability, where sustainability in the environment has the lowest mean score average. Hence, in achieving sustainability in manufacturing, more comprehensive action must be developed in fulfilling all components of manufacturing
sustainability in Malaysia’s manufacturing industry. Thus,
the measurement of all facets should be emphasised on strengthening the sustainability in manufacturing [8].
2.2
Correlation Test€ …
(a)Environmental (SEP) (b) Economic (SCP)
(c) Social Competency (SSC)
Figure 1: Mean scores for all items on manufacturing sustainability
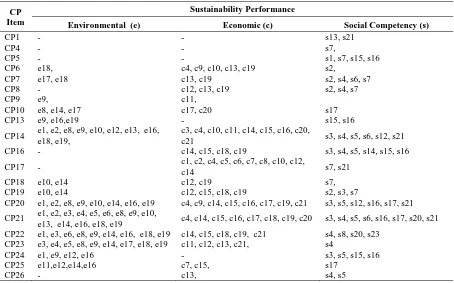
Table 1: Spearman correlation of Cleaner Production Practices (CP) against Sustainability Performance in Environmental, Economic and Competency Performance
CP Item
Sustainability Performance
Environmental (e) Economic (c) Social Competency (s)
CP1 - - s13, s21
CP4 - - s7,
CP5 - - s1, s7, s15, s16
CP6 e18, c4, c9, c10, c13, c19 s2,
CP7 e17, e18 c13, c19 s2, s4, s6, s7
CP8 - c12, c13, c19 s2, s4, s7
CP9 e9, c11,
CP10 e8, e14, e17 c17, c20 s17
CP13 e9, e16,e19 - s15, s16
CP14 e1, e2, e8, e9, e10, e12, e13, e16, e18, e19,
c3, c4, c10, c11, c14, c15, c16, c20,
c21 s3, s4, s5, s6, s12, s21
CP16 - c14, c15, c18, c19 s3, s4, s5, s14, s15, s16
CP17 - c1, c2, c4, c5, c6, c7, c8, c10, c12,
c14 s7, s21
CP18 e10, e14 c12, c19 s7,
CP19 e10, e14 c12, c15, c18, c19 s2, s3, s7
CP20 e1, e2, e8, e9, e10, e14, e16, e19 c4, c9, c14, c15, c16, c17, c19, c21 s3, s5, s12, s16, s17, s21
CP21 e1, e2, e3, e4, e5, e6, e8, e9, e10,
e13, e14, e16, e18, e19 c4, c14, c15, c16, c17, c18, c19, c20 s3, s4, s5, s6, s16, s17, s20, s21 CP22 e1, e3, e6, e8, e9, e14, e16, e18, e19 c14, c15, c18, c19, c21 s4, s8, s20, s23
CP23 e3, e4, e5, e8, e9, e14, e17, e18, e19 c11, c12, c13, c21, s4
CP24 e1, e9, e12, e16 - s3, s5, s15, s16
CP25 e11,e12,e14,e16 c7, c15, s17
correlation relationship ranging from 0.600 to 0.755 at the confidence level of 0.01 as presented in Table 1. From the analysis, 14 items in the CP and 17 items in SEP were found to have a strong positive correlation relationship among each other. The strongest correlation relationship exists between the encouragement in minimising and managing waste (CP13) with the ability to increase the efficiency in environmental management practices (e9) at a value of 0.740.
As for CP and SCP, the analysis shows that 16 items in CP are found to have a positive correlation relationship with all the items in SCP. From the result, the strongest correlation relationships appear between the ability to consider the recycle activity (CP20) with the ability to use the renewable energy and resources in production and transportation (c15) at a value of 0.755. Moreover, it has also become the strongest relationship that appears between CP’s with all components in manufacturing sustainability. Meanwhile, the correlation relationship between CP and SSC shows 20 items in CP and 17 items in SSC have strong relationships with each other. The strongest correlation relationships appear between the engagements of workforce in process (s17) with the ability to adopt the recycle activity in production operation (CP20) at a value of 0.752.
This result shows that the execution performance of the CP has an influence on each of the components required in balancing the production operations, thereby achieving sustainability in manufacturing. As the best mode in controlling industrial pollution, the requirement to reduce the industrial waste must be highlighted in environmental management policy. This is in line with the analysis results
from Malaysia’s manufacturing industry that demonstrates the ability to set precise objectives in environmental management practices possesses a close relationship with the proactive action in developing the best strategy to improve performance in environmental management. This is not surprising when the capacity in recycling, and efficiency in the usage of renewable energy can improve the economic and environmental benefits, which eventually lead to the increase of sustainable economy [2]. Moreover, high competency employees in CP can also increase the ability to execute the recycling practice at the production floor, as well as increase the innovation process in keeping the momentum of continuous improvement in production operations [3,6].
3.0 CONCLUSION
In this study, it can be concluded that the execution of CP practices successfully influenced the sustainability of manufacturing, primarily in Malaysia’s manufacturing industry. Although the main focus of CP is to improve the performance of environmental management, the execution of CP also has a strong influence in improving the performance
the financial performance in managing the production activity, predominantly through the efficient use of materials, resources and energy in production operations. The findings from this study can be used as a guideline for future research, primarily in strengthening the CP practices to establish a high sustainability level in manufacturing.
ACKNOWLEDGEMENTS
This research was co-funded by Universiti Teknikal Malaysia Melaka (UTeM) under an ERGS Grant (ERGS/1/2013/TK01/UTEM/02/08/E00029).
REFERENCES
[1] P. Moolla and R. Chompu-inwai, “Application of Cleaner Technology and experimental design for the reduction of chemical substance consumption in the
hard disk drive arm coil assembly process,” The 40th International Conference on Computers & Indutrial Engineering, pp. 1–6, 2010.
[2] W. Peng and C. Li, “Cleaner production evaluation in aviation industry based on AHP-Fuzzy,” 2011 2nd International Conference on Artificial Intelligence, Management Science and Electronic Commerce (AIMSEC), pp. 3820–3823, 2011.
[3] M. Z. Yusup, W. H. Wan Mahmood, M. R. Salleh, and
T. Rahayu, “A Review on Optimistic Impact of Cleaner Production on Manufacturing Sustainability,”
Journal of Advanced Manufacturing Technology, vol. 7, no. 2, pp. 79–99, 2013.
[4] S. X. Zeng, X. H. Meng, H. T. Yin, C. M. Tam, and L.
Sun, “Impact of cleaner production on business
performance,” Journal of Cleaner Production, vol. 18, no. 10–11, pp. 975–983, 2010.
[5] T. Short, A. Lee-Mortimer, C. Luttropp, and G.
Johansson, “Manufacturing, sustainability, ecodesign
and risk: lessons learned from a study of Swedish and
English companies,” Journal of Cleaner Production, vol. 37, pp. 342–352, 2012.
[6] M. Z. Yusup, W. H. Wan Mahmood, M. R. Salleh, and
M. Norhafiza, “The Translational Process of Cleaner Production Strategies,” Global Engineers & Technologists Review ISSN 2231-9700, vol. 3, no. 5, pp. 29–39, 2013.
[7] S. I. Hallstedt, A. W. Thompson, and P. Lindahl, “Key Elements for Implementing a Strategic Sustainability
Perspective in the Product Innovation Process,”
Journal of Cleaner Production, pp. 1–12, 2013. [8] K. K. B. Hon, “Performance and Evaluation of
APPENDIX
1.Performance of Cleaner Production Practice (CP)
How you rate your current performance in cleaner production practices for the past two (2) years? (On a seven point scale from strongly disagree to strongly agree).
Item Cleaner Production Practices CP 1 Application energy consumption technologies CP 2 Proactive in process and technology innovation CP 3 Appraise the selection of suppliers
CP 4 Improve layout and work design
CP5 Appraise labour safety in materials handling CP 6 Increase design of logistics networks CP 7 Effect of production planning on environmental CP 8 Selection of equipment
CP 9 Recyclability and reusability in product design CP10 Increase renewable resource utilisation CP11 Increase product durability
CP12 Reduce usage of raw material and resources CP13 Encourage waste minimisation and management CP14 Recycled, re-manufactured or reused in design CP15 Well-organized use of chemical in process CP16 Promotes employee involvement
CP17 Usage of non-toxic and non-polluting materials CP18 Evaluate environmental effects of products CP19 Environmental issues in manufacturing systems CP20 Possibilities of recyclability from activities CP21 Increase recyclability in composition of products CP22 Sharing information with stakeholders CP23 Disposal methods during designing products CP24 Environmental protection regulation and policy CP25 Reduce usage of natural resources
CP26 Simplified the product installation process 2.Sustainability of Environmental Performance (SEP)
What are your current environmental performances from the past two (2) years? (On a seven point scale from strongly disagree to strongly agree).
Item Sustainability in Environmental Performance e1 Increase recyclability activities
e2 Use recycle material in product & process
e3 Increased reusable, non-toxic & bio-degradable materials e4 Increase amount of recycled components
e5 Increase amount of recycling of packaging materials e6 Adapt reuse & recycling in design
e7 Use eco-friendly material
e8 Increase usage of renewable material
e9 Increase practice, management & performance in environmental
e10 Establish material & energy consumption reduction programmes
e11 Decrease energy consumption in the process e12 Establish pollution prevention & reduction control e13 Increase the opportunities of preventing pollution e14 Reduce emission of substances & control e15 Reduce the waste of materials
e16 Established waste reduction & energy efficiency programmes
e17 Use easily degradable chemicals
e18 Consider the direct environmental effect on operation e19 Better environmental management and control
3.Sustainability of Economic Performance (SCP)
What are your current economic/financial performances from the past two (2) years? (On a seven point scale from strongly disagree to strongly agree).
Item Sustainability in Economic Performance c1 Minimise overall production cost
c2 Increase business and financial performance c3 Efficient utilization of equipment and technology c4 Efficient utilization of resources
c5 Increase the quality of product c6 Reduce the non-added value activities c7 Increase added value activities c8 Reduce the total operation cost c9 Reduce the total production lead time c10 Minimize environmental costs in transportation c11 Consider economic effect on the selection of the system c12 Consider the risk taken in the investment
c13 Reallocating the resources based on requirement c14 Increase the innovative in technological improvements c15 Use renewable energy in production & transportation c16 Purchase materials, parts & resources based on demand c17 Product easily disassembly
c18 Establish quantitative, objective of quality in operation c19 Redefine the competitive environment
c20 Reduce the number of parts in a product c21 Properly plan the requirements of the material 4.Sustainability of Social Competency Performance (SSC)
What are your current social competency performances from the past two (2) years? (On a seven point scale from strongly disagree to strongly agree).
Item Sustainability in Social Competency Performance s1 Improve housekeeping & labour safety
s2 Improve process & flexibility s3 Increase efficiency and competitiveness s4 Increase product durability
s5 Driving force for improvement & process innovation s6 Improve the manufacturing capability & customization s7 Improve working conditions
s8 Improve the movement of operation flow s9 Increase the operation efficiency s10 Increase the production productivity
s11 Improve the organization of work environment s12 Reduce the queuing time
s13 Develop standard & establish the consistency in the process s14 Comply with environmental, regulation & safety issue s15 Consider technology feasibility & labour safety s16 Consider the social effect in product development s17 Consider engaging of the workforce in the process s18 Collaborate with other parties on environmental issues s19 Possess environmental policy statements
s20 Possess strategic alliance with organizational strategies s21 Use long length of life of components