IMAGING CONCENTRATION PROFILE OF MULTIPHASE FLOW USING LASER BASED TOMOGRAPHY
ROSHITA BINTI AHMAD
This report is submitted in partial fulfillments of the requirements for the award of Bachelor of Electronic Engineering (Computer Engineering) With Honours
Faculty of Electronic and Computer Engineering Universiti Teknikal Malaysia Melaka
ii
UNIVERSTI TEKNIKAL MALAYSIA MELAKA
FAKULTI KEJURUTERAAN ELEKTRONIK DAN KEJURUTERAAN KOMPUTER
BORANG PENGESAHAN STATUS LAPORAN PROJEK SARJANA MUDA II
Tajuk Projek : IMAGING CONCENTRATION PROFILE OF MULTIPHASE FLOW USING
LASER BASED TOMOGRAPHY
Sesi Pengajian : 2008/2009
Saya ROSHITA BINTI AHMAD OO (HURUF BESAR)
mengaku membenarkan Laporan Projek Sarjana Muda ini disimpan di Perpustakaan dengan syarat-syarat kegunaan seperti berikut:
1. Laporan adalah hakmilik Universiti Teknikal Malaysia Melaka.
2. Perpustakaan dibenarkan membuat salinan untuk tujuan pengajian sahaja.
3. Perpustakaan dibenarkan membuat salinan laporan ini sebagai bahan pertukaran antara institusi
pengajian tinggi.
4. Sila tandakan ( ) :
SULIT*
(Mengandungi maklumat yang berdarjah keselamatan atau kepentingan Malaysia seperti yang termaktub di dalam AKTA RAHSIA RASMI 1972)
TERHAD* (Mengandungi maklumat terhad yang telah ditentukan oleh organisasi/badan di mana penyelidikan dijalankan)
TIDAK TERHAD
Disahkan oleh:
__________________________ ___________________________________
(TANDATANGAN PENULIS) (COP DAN TANDATANGAN PENYELIA)
Alamat Tetap: 100, KM4 JALAN PUTERA, 06250 ALOR STAR, KEDAH.
iii
“I hereby declare that this report is the result of my own work except for quotes as cited in the references.”
Signature : ……….………
iv
“I hereby declare that I have read this report and in my opinion this report is sufficient in terms of the scope and quality for the award of Bachelor of Electronic
Engineering (Computer Engineering) With Honours.”
Signature : ……….………
Supervisor’s Name : ADIE BIN MOHD KHAFE
v
vi
ACKNOWLEDGEMENT
Alhamdulillah, thankful to Allah s.w.t because with His Willingness, I possible to complete the Final Year Project (FYP) in time.
Firstly, I would like to take an opportunity to express my deepest gratitude to my supervisor Mr. Adie Bin Mohd Khafe because of his willing to sacrifice his precious time in order to guidance me to fulfill this project. Without him, surely I have difficulties to finish up this project.
I also like to thank to all UTEM lecturers and who had helped directly or indirectly in what so ever manner thus making this project a reality.
Lastly, thanks to my family which always support and pray on me throughout this project. Their blessing gave me the high-spirit and strength to face any problem occurred and to overcome them rightly.
vii
ABSTRACT
viii
ABSTRAK
xi
REFERENCES 51
Appendices
A 52
B 58
xii
LIST OF TABLES
TABLE TITLE PAGE
xiii
2.7 Schematic of 2-terminal and 3-terminal phototransistors 21
2.8 Cross-section 22
2.9 Three Fan Beam Projections 24
2.10 Four Fan Beam Projections 24
2.11 Block Diagram of the KUSB-3102 and KUSB-3108 Modules 26
3.1 Spectral Wave Sensitivity for SFH 203P 28
xiv
Profile 40
4.7 The Schematic Diagram for 1 Receiver Circuit using
Proteus 41
4.8 The Schematic Diagram for 16 Receiver Circuit using
Proteus 42
4.9 Receiver Circuit 43
4.10 Conveying Pipe with Receiver Circuit 43
4.11 The color scale 44
xv
LIST OF SYMBOLS
(
,)
LBPV x y = Voltage distribution obtained using LBP algorithm concentration profile in unit (volt) an n x m matrix where n equals to dimension of sensitivity matrix.
, Rx Tx
S = Signal loss amplitude of receiver Rx-th for projection Tx-th in unit of volt.
(
)
, ,
Tx Rx
xvi
LIST OF APPENDICES
APPENDIX TITLE PAGE
A Photodiode SFH 203 52
B TL 084 IC 58
CHAPTER 1
INTRODUCTION
1.1 Tomography Overview
Tomography is a branch of imaging which produces an image called a tomogram which shows a single plane of an object in very specific detail. Originated from the Greek words ‘tomos’ which means slice and ‘graph’ meaning picture, tomography can be defined as a picture of a slice [3]. In simple terms, tomography is an imaging technique that enables one to determine the contents of a closed system without physically looking inside it.
2
Basically, in a tomography system several sensors are installed around the pipe or vessel to be imaged. A computer is used to reconstruct a tomography image of the cross section being interrogated by the sensors. The specific subsystem for flow imaging are shown in Figure 1.1 and described as follows [1]:
1. The sensor and sensor electronics. The field sensing pattern of the sensors is also important, as it is related to the choice of image reconstruction algorithm.
2. The flow fields, which is assumed to be composed of two or more separate components. Since the flow pattern can change rapidly, fast data processing of the measured information at an acceptable cost is required.
3. Image reconstruction, which includes extraction of image characteristics and reconstruction of the image.
4. Image interpretation, to give the desired information on the flow, such as the instantaneous concentration of components from which volume flow rates can be calculated.
Figure 1.1 Basic schematic diagram of tomography system Sensor Electronics
Sensor
Conveying pipe
3
1.2 Objectives of the Project
The aims of this project are to measure of concentration profile of Multiphase Flow based tomography proses. The objective of this project is:
1. To detect of Multiphase flow.
1.3 Scope of the project
This project is divided into two parts, which are the first parts is hardware development and the second part is software development and interfacing it with data acquisition system (DAQ).
For part one, firstly, literature study in the measurement of concentration profile of Multiphase Flow using laser based tomography. Second, selection of sensor and design a sensor’s jig/fixture. Then, study the receiving circuit and testing the circuit. Lastly, the signal conditioning circuit are designed and tested.
4
1.4 Thesis Outline
Chapter 1 present an overview to process tomography, the objectives of the project, scope of the project and thesis outline.
Chapter 2 provides literature review which includes the tomography technique, Sensor type and selection, laser, photodiode, phototransistor and orthogonal projection technique
Chapter 3 explanation about methodology which it covers about emitter and receiver, The Design of Optical Receiving Circuit, DAQ card and Visual Basic (VB) and Linear back Projection (LBP) Algorithm
Chapter 4 shows a result for this project and discussion about result.
CHAPTER 2
LITERATURE REVIEW
2.1 Tomography Technique
Tomography techniques vary widely in their instrumentation and application, all of them can be characterized by a common two-step approach to the imaging process: firstly gather projection data base on same physical sensing mechanism, then reconstruct a cross sectional image from the projections. The term “projection” has a specific meaning in tomography which a projection can be visualized as type of radiography of the process vessel [5].
6
Figure 2.1 Two Orthogonal projection
7
2.2 Sensor Type and Selection
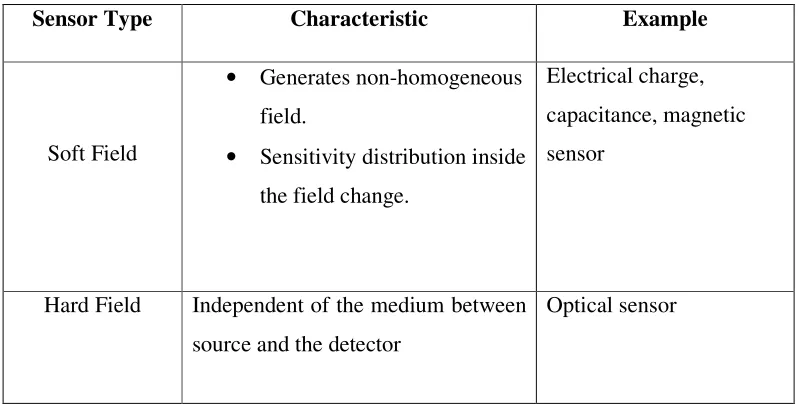
Many type of sensors that can be used for the application of tomography, specifically to collect the projection data such as electrical sensors, optical sensor, gamma ray sensor, ultrasonic sensor, etc. sensor can be divide into two groups; soft field and hard field sensor as shown in Table 2.1 [1].
Soft field sensor generates a non-homogeneous field and the sensitivity distribution inside the field changes as the parameter distribution changes. On the other hand, hard field sensor is independent of the medium between source and the detector. Here, several types of tomography technique, including optical sensor will be introduced [1].
Table 2.1 Sensor Grouping
Sensor Type Characteristic Example
Soft Field
Hard Field Independent of the medium between source and the detector
8
2.2.1 Electrical Capacitance Tomography
Electrical capacitance tomography (ECT) is a method for determination of the dielectric permittivity distribution in the interior of an object from external capacitance measurements. It is a close relative of electrical impedance tomography and is proposed as a method for industrial process monitoring, although it has yet to see widespread use. Potential applications include the measurement of flow of fluids in pipes and measurement of the concentration of one fluid in another or the distribution of a solid in a fluid.
Although usually called tomography, the technique differs from conventional tomography methods, in which high resolution images are formed of slices of a material. The measurement electrodes, which are metallic plates, must be sufficiently large to give a measurable change in capacitance. This means that very few electrodes are used and eight or twelve electrodes are common. An N-electrode system can only provide N (N-1)/2 independent measurements. This means that the technique is limited to producing very low resolution images of approximate slices. However, ECT is fast, and relatively inexpensive.