7. Optimum Fertilizer Rate for Kangkung
(Ipomoea
aquatica
L.) Production in Ultisols of Nanggung, Bogor
Anas D. Susila
1,Tisna Prasetyol and Manuel C. Palada
2Abstract
セN@ Nitrogen, phosphorus and potasium availabilities are the most limiting factors for maximum growth and yield. Kangkung (Ipomoea aquatica L.) is an important traditional leafy vegetable crop cultivated in Indonesia. Kangkung was grown to evaluate the optimum rates ofN, P and K fertilizers in Ultisols of Nanggung, Bogor, with low pH (5.5), low organic C (1.54%), . - very-low totafN (0.12%), low K content (0.29 mellOO g), but very high soil
P20S concentration (19.2 ppm) to evaluate the best crop management
practices with starter solution. The experiment was conducted in Hambaro village, NaJlgguug subdistrict, Bogor, Indonesia, from January to April 2008.· The treatments were: N, P, K fertilizer rates of 0%;· 50%, 100%, 150% and 200% from the fertilizer recommendation rates (100 kg/ha N, 135 kg/ha P20S
and 135 kg/ha K20). This experiment used Randomized Complete Block Design with four replications (each farmer field as one replication): Total number of plots was 15 x 4
=
60, with plot size of 1.5 x 5 m. Kangkung (local variety) was planted in four rows per plot, 25 cm between rows and 15 em within rows, at 10 seeds per planting. The application ofN (200 kg/ha), P20S(270 kg/ha), and K20 (270 kg/ha) quadratically increased total and relative yields ofkangkung. Based on Y
=
-0.0021x2+
0.572x+
56.857 for N, Y=
-0.0013x2
+
0.3673x+
72.102 for P20S, and Y=
-0.OOOlx2+
0.0959x+
84.102 for K20, the optimum rates for each nutrient was 136-141-674 kg/ha N-P20s-K20. The fertilizer recommendation based on K threshold (no K) was 41-40-0, on P threshold was 24-0-0 kg/ha N-P20s-:-K20. However, no fertilizer was needed on N threshold. In the recommendation based on
. セTGャーャNゥ|ゥュュ@ yield (136-141-674), the percentage increase in cost (134.0) was
higher than the expected increase in yield (19.28). Based on the yield vs. cost rule therefore, the most economical recommendation would be 41-40-0 kg/ha N-P20S-K20 (K threshold).
Keywords: Kangkung, optimum fertilizer rate, Ultisols
IPlant Production Division, Department of Agronomy and Horticulture, Faculty of Agriculture, Bogor Agricultural University, JI. Meranti, Komplek IPB Darmaga, Bogor 16680, Indonesia. anasdsusila@ipb.ac.id, tisnaprasetyo@yahoo.com, TeIIFax: 0251 629353
2Crop and Ecosystems Management Unit AVRDC·World Vegetable Center. P.O. Box 42, Shanhua, Tainan 74199, Taiwan. mpalada@gmail.com
1. Introduction
Kangkung (Ipomoea aquatica L.) is an important traditional leafy vegetable crop cultivated in Indonesia. Practically all parts of the young plants are eaten. Since older stems become fibrous, young succulent tips are preferred. Kangkung belongs to the family Convovulaceae which can be grown in low land and upland farms. It is preferred for cultivation because of its shorter growth cycle, it is fast growing, widely adaptable, and tolerant to diseases. Kangkung usually grows in home gardens, but is now becoming one of the significant commercial vegetables. In Indonesia, yield potentIal of kangkung has not yet been fully exploited or studied due to low use of inputs and lack of information Oti production technology.
In Indonesia,-growing vegetable crops on Ultisols is not widely ob-served, although Ultisols occupy almost 25% of total Indonesian land surface. The major problems in Ultisols are the deficiency of plant nutrients such as phosphorous (P) and potassium (K). Ultisols have an acidic to very acidic re-action, high Al and Fe saturation which are specific propetties that restrict plant growth. The presenc(' of argillic horizon in the soil influences soil physical properties such as reduction of both macro- and micro-pol."es, enCOaf-aging surface run-off and finally supporting soil erosion. Most studies indi-cated that liming, and ヲセャエゥャゥコゥョァ@ by organic and inorganic fertilizers could overcome some constraints in Ultisols (prasetyo and Su..riadikarta, 2006; Kasno et aI., 2006).
Fertilization is one of the management practices that can be imple-menterl to increase カ・ァセエ。「ャ・@ yield. Nitrogen and potassium are fundamental to achieve high marketable yield while phosphorus is essential for early growth and root development. The importance of potassium in ensuring nor-mal growth and production of quality fruits is well recognized (lPN!, 2008). Nitrogen is the nutrient needed in largest quantities by plants and the one most frequently applied as fertilizer. Application rates are critical, because セッッ@ much ot1:6trl:ittl.e directly impacts crop growth. Correct form of nitrogen s critical where the ammonium form can restrict growth and adversely affect luality. Application rates of phosphorus and potassium depend on the lOtential level of nutrient availability from the soil. Excessive phosphorus ertilizer can aggravate iron and zinc deficiencies and increase soil salt :ontent. Excessive potash fertilizer can increase soil salt content too (Whiting
:t aI., 2007).
Rochayati et al. (1999) reported that until now, fertilization practices bserved by most farmers are applied to all plants, whereas fertilization rates epend on plant species and variety, soil type, location and 。ァイゥ」オiエGMセイ。ャ@ prac-ces. Fertilization recommendations are crop-specific and location-specific.
Proper fertilization of a crop is a requirement to obtain maximum· yield. In addition to yield obtained, quality of the commodity is an important factor of profit arid shelf life for high-value crops (Hochmuth et al., 1993).
This research was conducted to evaluate optimum rates' ofN, P and K fertilizers on kangkung (Ipomoea aquatica L.) grown in Ultisols ofNanggung (Jasinga soil) with low pH (5.5), low organic C (1.54%), very low total N (0.12%), low K. content (0.29 me/] 00 g) but very high soil P20S concentration
(19.2 ppm).
2. Materials and Methods
The experiment was conducted-oat Hambaro village, Nanggung, Bogor, Indo-nesia,
from
January to April 2008. The soil type in the location belongs to Ul-tisols, which typically have pH 5.5 and high P-fixation by aluminum, soilP20S concentration of 19.2 ppm, total N of 0.12%, and K content of 0.29
me/100 g. Treatments: N, P, K fertilizer rates of 0%, 50%, 100%, 150% and 200% from fertilizer recommendation rates (100 kg/ha N, 135 kglha P20S and
135 kg/ha K20). This experiment used Completely Randomized Block
Design with four replications (each farmer field as one replication). Total number of plots used was 15 x 4
=
60 plots, with plot size=
1.5 x 5 m. Local variety of kangkung was planted in four rows 'per plot or per bed, 25 cm between rows and 15 cm within rows, 10 seeds per planting hole.Lime (CaC03) was thoroughly incorporated (1.5 tonlha) into the bed 4 weeks before planting. Furrow irrigation was carried out at I-week intervals and weeding done when necessary. Harvesting was carried out 4 weeks after sowing.
Fertilizer application consisted of the following:
1. N fertilizer optinuzation: N rate was the same as the treatments, pre -plant 100% P, UPEセNウゥセZZZ、エZ・ウウ@ 50% K (3 weeks after planting);
2. P fertilizer optimization: P rate was the same as the treatments, pre-plant 50% Nand 50% K; side-dress 50% N and 50% K (3 weeks after pre- plant-ing);
3. K fertilizer optimization: K rate was thc same as the treatments, pre-plant 100% P, 50% N; side-dress 50% N (3 weeks after pre-planting).
Plant height and plant diameter were measured 1, 2, 3 and 4 weeks af-ter transplanting. Yield per plant and yield per plot were measured 5 weeks after transplanting (W AT). Analysis of variance of data was calculated using SAS 8.12 (SAS Institute, NC). Polynomial regression was used to analyze N-P-K rate effect (linear or quadratic) and to find out the optimum rate for maximum yield. Economic evaluation was done to arrive at the recommenda-tion choices.
3. Results and Discussion
Application ofN, P, K fertilizers up to 200 kg/ha N, 270 kg P20S and 200 kg K20 significantly increased vegetative growth and plant height and stem di-ameter of kangkung bean from 1 week to 5 weeks after planting. This range of fertilizer rates was appropriate to build optimum rate of each fertilizer in
the Ultisols with soil total N of 0.12%, P20S concentration of 19.2 ppm, and K content of 0.29 me/t 00 g.
3.1 Plant height
Application of N fertilizer from 0 to 200 kg/ha N increased quadratically the plant height of kangkung at 1 week to 5 weeks after planting (Table 1). A similar effect was achieved with It fertilizer application, where application of P fertilizer from 0 to 270 kg/ha P20S), and K fertilizer from 0 to 200 kg/ha K20 increased quadratically the plant height of kangkung at 1 week to 5
[image:5.416.46.311.245.371.2]キ・・ォセ@ after planting (Tables 2 and 3).
Table 1. Effect ofN rates on plant height c:kar.gkung
N rate (kg! Plant height (cm)
haN) lWAT 2W'AT 3WAT 4WAT
-0.00 3.38 6.30 10.16 21.84
50.00 4.29 8.01 12.95 27.78
100.00 5.41 10.13 16.40 35.15
150.00 5.42 10.12 16.34 35.06
2()0.00 4.98 9.30 15.02 32.22
Regression Q** Q** Q** Q**
Note: **significant at P = 0.01, Regression Q = Quadratic
Table 2. Effect of P rate on plant height of kangkung
セ@ ..
P rare (kgIha Plant height (cm)
PzOs) lWAT 2WAT 3WAT 4WAT
0.00 3.68 6.87 11.10 23.82
67.50 4.21 7.86 12.69 27.23
135.00 4.91 9.16 14.78 31.74
202.50 4.77 8.91 14.39 30.88 270.00 4.69 8.77 14.16 30.39
Regression Q** Q** Q** Q**
Note: ** significant at P = 0.01, 'Regression Q = Quadratic
[image:5.416.54.306.402.514.2]•.
--.---'---Table 3. Effect ofK rate on plant height ofkangkung
K rate (kg! Plant height (em)
haK2O) lWAT 2WAT 3WAT 4WAT 0.00 4.26 7.95 12.84 27.56
50.00 4.29 8.01 12 .. 92 27.75
100.00 4.60 8.59 13.86 29.76
150.00 4.86 9.08 14.65 31.46
200.00 4.76 8.89 14.35 30.8C
Regression Q** Q** Q** Q**---:
Note: ** significant at P = 0.01, Regression Q = QuadratiI:-. セ@ .'
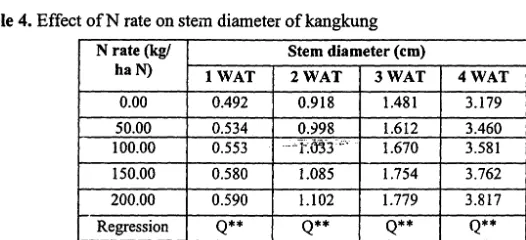
3.2 Stemm diammeter
A similar pattern of ferti1izer effect occUlTed in stem diameter, where N, K fertilizer resulted in quadratic response, and P fertilizer resulted in linear re-sponse. Application of N fertilizer from 0 to 200 kg/ha N increased quadrati-cally the stem diameter of kangkung at 1 week to 5 weeks after planting (Table 4) while application of P fertilizer from 0 to 270 kg/ha P20S linearly
increased stem diameter of kangkung at 1 week to 5 weeks after planting (Table 5). Application of K fertilizer from 0 to 270 kg/ha K20 increased quadratically the stem diameter of kangkung at I week to 5 weeks after plant-ing (Table 6).
Table 4. Effect ofN rate on stem diameter ofkangkung
N rate (kg! Stem diameter (em)
haN) lWAT 2WAT 3WAT 4WAT
0.00 0.492 0.918 1.481 3.179
50.00 0.534 PNセYX@ 1.612 3.460 100.00 0.553 '"1-:03'3'''''' 1.670 3.581 150.00 0.580 1.085 1.754 3.762
200.00 0.590 1.102 1.779 3.817
Regression Q** Q** Q** Q**
Note: ** significant at P = 0.01, Regression Q = Quadratic
[image:6.378.60.278.49.171.2] [image:6.378.29.292.339.459.2]Table 5. Effect ofP rate on stem diameter ofkangkung
P rate (kg! Stem diameter (em)
haPzOs) lWAT 2WAT 3WAT 4WAT
0.00 0.529 0.987 1.594 3.421
67.50 0.541 1.011 1.632 3.504
135.00 0.567 1.059 1.710 3.669
202.50 0.606 1.132 1.827 3.922
.
-270.00 0.619 1.157 1.8/19 4.010Regression L** L*"* L** L**
[image:7.390.33.292.46.340.2]Note: ** Significant at P = 0.01, Regression L = Linear
Table 6. Effect ofK rate on stem diameter ofkangkung
Krate(kg/ Stem diameter (em)
ha K2O) lWAT 2WAT 3WAT 4WAT
0.00 0.485 0.906 1.459 3.135
50.00 0.506 0.945 1.523 3.273
100.00 0.611 1.142 1.842 3.955
150.00 0.625 1.167 1.884 4.043
200.00 0.597 1.116 1.802 3.367
Regression Q** Q** Q* Q** .-Note: ** Significant at P = 0.01, Regression Q = Quadratic
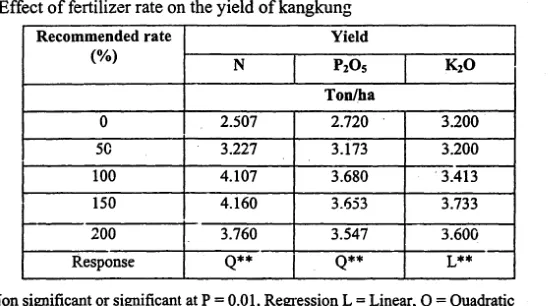
3.3 Plant yield
Application of N, P fertilizers from 0, 50%, 100%, 150%, 200% of the rec-ommended rate resulted in quadratic イ・ウーッョウ・セN」ojlセ・@ yield of kangkung. However, application ofK fertilizer from 0,50%;100%, 150%,200% ofrec-ommendation rate resulted in linear response on the yield of kangkung (Table 7). Application of K of more than 200% of the recommended rate (>270 kg! ha K20) still increased yield. However, application of N and P fertilizers at more than 200% of the recommended rate (>200 kglha N, and >270 kglha K20) reduced yield.
3.4 Multi-nutrient response interpretation
Multi-nutrient response interpretation is one method to develop fertilizer rec-ommendations using single-nutrient quadratic model. The recommendation choice was developed using N, P, K fertilizer response curve, where the
,.
Table 7. Effect of fertilizer rate on the yield ofkangkung
Recommended rate Yield
(%)
N PzOs KzO
Tonlha
0 2.507 2.720 3.200
50 3.227 3.173 3.200
100 4.107 3.680 SZセ@
150 4.160 3.653 3.733
200 3.760 3.547 3.600
Response Q** Q** L**
Ncte: ** Non significant or significant at P = 0.01, Regression L = Linear, Q = Quadratic 100% rate = 100 kglha N, 135 kglha PzOsand 135 kglha KzO
first recommendation was calculated from the optimam relative yield, and the second, third and fourth recommendations determined from N, P, K threshold
(0 application), respectively. .
The N curve response regression equation was: Y = -0.0021x2
+
0.572x+
56.957; R2=O.9341 and the optimum N rate was 136 kglha N.Phosphor response regression equation was:
Y = -0.0013X2
+
0.3673x+
72.102; R2=0.9569 and the optimum P rate was 191 kg/ha P20S.Pot::lssium response regression equation was:
Y = -0.000Ix2
+
0.0959x+
84.102; R2=0.7649 and the optimum K rate was: 647 kg/ha K20.Therefore, 4 fertilizer recommendations for kangkung can be applied
(kg/ha N-P20S-K20): __ セBBBLセL⦅@
- Based on optimum yield = 136-191-647 - Based on N threshold = 0-0-0
- Based on P threshold = 24-0-0 and - Based on K threshold = 41-40-0 (Fig. 3).
3.5 Economic evaluation of fertilizer recommendations
The economic evaluation of fertilizer recommendation was calculated based on the price of urea (45% N), SP36 (36% P20S) and KCl (50% K20) which were Rp 1,700. Rp3,OOO, and Rp8,000, respectively. Based on the increases in relative yield, the recommendation based on optimulll yield was the best choice (J 00%).
f igure 1. Organic | B エ セ・ エ。「ゥ ・@ at home garden
Figure 2. Organ ic \"egetable at h0111e ga rden Linder tree-system
,.
イMMMNMMMMセセM]MMMMMMMMMMMMMMMᄋMMMMMMMᄋM
..
--iI
rn.
!I i
1\1100.00 ... - --I!
> 80.00
I
j
60.00N[セN[@
•••セ@
No_hOld"I
'I & 40.00 Y = -0.0021 x2 + 0.5'12 x + 56.857
I
rセPNYSTQ@ !
I
20.00I
o 50 100 150 200 250
i
!
i
N rate セ@ (100%= 100 kg N /ha), 120.00 100.00 セ@ セ@ 80.00 >= t
i 60.00
i
40.00 Y = -0.0001 x2 + 0.0959 x + 84.102
20.00
!
R2.:0.7649
o 50 100 150 200
Krata (%) (100%=135 kg Kplha)
250
i
i I iI
イMMMMMMMMMMMMMMMMMMMMMMMセ@ !
I
120.00 '100.00
!
iセ@
J
80.00i ,.
I !
!
J
60.00 40.0020.00 o
••••••••• P. threshold
y=-O.OO13 x2 +0.3673 x + 72.102
R2.:0.9569
i
! 50 100 150 200 250 I
Prate(%)(100%=135kgPzO,lha)
I
[image:10.387.82.303.29.517.2]---.---J
Figure 3. Multi-nutrient response interpretation and development of fertilizer recommendation using single-nutrient quadratic model: kangkung in U1tisols at Nanggung, Bogor. Fertilizer applied (kg/ha N-P20S-K20) for recommendation choice: to optimum yield
= 161-208-309, to N threshold = 0-4-0, to K threshold = 15-28-0, to P threshold = 0-0-0.
o
T1l8Ec a) e OIlOIlUC . E 1 va ua Ii 011 0 fF el til· IZcr R
I
dati f, r tk
eCOllllllcn , on or ,.1U1 Olla . ttl UI' I trso s 8nggtUlg- ogor. N B F.rtiliz ... Recommendation Yi .. ldDala '.
Choice
R .. lativE' Yield Challge f .. OID lIext low.I· F .. rtilizer
I
at eath recohunend"tioll cboice CostlIut .. l,,,,t
dll'esltold Jucrease ill p・イイ・ャャエ。ァセ@
Relative Yi.ld lllCl'eoase ill
Ylellll )
(%) (Rp)
1-o -0 - 0 (N-tlu'eshold) 56.90
-
.
0 2-1 - 0 - 0 (P-thcrshold) 72.10 15 26.71 92,j67I .:.11 - -10 - 0 (K-t1u-eshold) 84.l0 12 16.64 488,986 L1.l6 - 191 - 647 (optinnull) 100.00 16 19.28 10.734,776
1) Increase In relanve Yield diVided by the relative Yield at each nutnent threshold 2) Increas e in cost divided by total production c<'st for previous recommendation choice 3)Total production cost divided by relative yield at each nulrient threshold
CostData
Total Challge froID llext lowel' p .. o ,hlCtiOll r.commelldatioll c1lOice
Cost
Jucreas£'m Pert entage increase ill Cost Cost 2)
(Rp) (RpL ("10)
WLQセVLooo@
-
-7,248,367 92367 1.3
7,644,986 396,619 5.5 17,890,776 10,245,790 134.0
Relativ .. 'Utit Cost ')
セN@
However this recommendation also caused the relative cost unit to be at 178,344. Based on the fertilizer price the most economic fertilizer recom-mendation was 41-40-0 (kg/ha N-P20S-K20) which had the lowest relative unit cost (90,904). However, this choice leads to only 84.10% relative yield. The economic evaluation of fertilizer recommendations for kangkung in Ulti-sols (Jasinga soil) is shown in Table 8.
4. Conclusions
From this study it can be concluded that:
1. The fertilizer recommendation for kangkung in Ultisols Nanggung-Bogor with soil P20S concentration of 19.2 ppm, N-total of 0.12%, and K
content of 0.29 me/l00 g based on optimum yield was 136-191-647 (kg/ha N-P20s-K20).
2. The most economic fertiHzer recommendation fOi kangkung in Ulti-sols of Nanggung, Bogor was 41-40-0 (kglha N-P20S-K20) However, this choice resulted in 84.10% relative yield only.
5. Acknowledgments
This publication was made possible through support provided by the United States Agency for International Development and the generous support of the American People (USAID) for the Sustainable Agriculture and Natural Re-sources Management Collaborative Research Support Program (SANREM CRSP) under terms of Cooperative Agreement Award No. EPP-A-OO-04-00013-00 to the Office of International Research and Development (OIREllJ
at Virginia Polytechnic Institute and State University (Virginia Tech).
References
International Plant Nutrition Institute (IPNI). 2008. Potassium Imprvves Yield and Quality of Tomato in the Red & Lateritic Soils of West Bengal with Low Inherent Fertility. http://www .ppi-ppic.org.
Prasetyo B.H. and D.A. Suriadikarta. 2006. Karakteristik, potensi, dan teknologi pengelolaan tanah Ultisol untuk pengembangan pertanian lahan kering di Indonesia. Jurnal Litbang Pertanian, 25(2): 39-46.
Kasno A., D. Setyorini and E. Tuberkih. 2006. Pengaruh pemupukan fosfat terhadap produetivitas tanah Inceptisol dan Ultisol. Jurnal Ilmu-ilmu Pertanian Indonesia, 8 (2): 91-98.
Rochayati R., D. Setyorini, S. Suping and L.R. Widowati. 1999. Korelasi uji tanah hara P dan K. Laporan Bagian Proyek Penelitian Sumber daya Lahan. Pusllittanak (unpublished).
Whiting D., C. O'Meara and C. Wilson. 2007. Vegetable Garden: Soil MalZagement and Fertilization. Colorado State University Extensi()Il.
Appendix: Ph otos ti-:ll11 the project are" in j lallgglillg: (u;)per) ;isit to an orga ni c vegeta