THE EFFECT OF DISPERSION ON OPTICAL FIBER
ANURA BINTI AHMAD KAMIL
This report is submitted in partial fulfillment of requirements for the Bachelor Degree of Electronic Engineering (Electronics Telecommunication)
Faculty of Electronic and Computer Engineering Universiti Teknikal Malaysia Melaka
v
vi
ACKNOWLEDGEMENT
Firstly, I would like to express my sincere appreciation to my supervisor Dr. Siti Khadijah Binti Idris @ Othman for supporting and guided me in my final year project, her supervision with patience and persistent help me to research and complete the writing of this thesis.
Special thanks dedicated to my parents, Ahmad Kamil Bin Haji Mohd Yunus and Mariam Binti Abdul Jalil for supporting me financialy and keep on praying for me to finish this thesis. Also thanks to my siblings Ahmad Safwan, Ahmad Irfan and Aqilah who cheer me up, giving me strength continuously until the end. This project is impossible to be completed without my beloved friends and family who pray for success in the whole final year project.
vii
ABSTRACT
viii
ABSTRAK
ix
2.1 Effect The Fibre Optic Dispersion on Optical
x
4.2 Pre-, Post-, and Symmetrical Compensation by Using DCF 24
4.2.1 Pre-, post-, and symmetrical dispersion compensation for bit rate 2.5 Gbps and 10 Gbps 24
4.3 Preliminary Result 26
4.3.1 Pre-dispersion compensation 27
4.3.2 Post-dispersion compensation 29
4.3.3 Symmetrical-dispersion compensation 31 4.4 Pre- and Post- Dispersion Compensation at Bit Rate of 40 Gbps 35
4.4.1 Pre-dispersion compensation 37
xi
5 CONCLUSION AND RECOMMENDATION
5.1 Conclusion 51
5.2 Recommendation 52
xii
LIST OF TABLES
NO. TABLES PAGE
Table 2.1 Comparison of the fiber wavelength 17
Table 4.1 Parameter of SMF and DCF 24
Table 4.2(a) The pre simulation result for 2.5 Gbps 27 Table 4.2(b) The pre simulation result for 10 Gbps 27 Table 4.3 The post simulation result for 2.5 Gbps 29 Table 4.4 The post simulation result for 10 Gbps 29 Table 4.5 The symmetrical simulation result for 2.5 Gbps 31 Table 4.6 The symmetrical simulation result for 10 Gbps 31 Table 4.7 The pre, post and symmetrical simulation result for 2.5 Gbps 33 Table 4.8 The pre, post and symmetrical simulation result for 10 Gbps 34 Table 4.9 The simulation result for pre- and post compensation in
distance 240km 43
Table 4.10 The simulation result for pre- and post compensation in
xiii
LIST OF FIGURES
NO. FIGURES PAGE
Figure 2.1 CWDM system performance 6
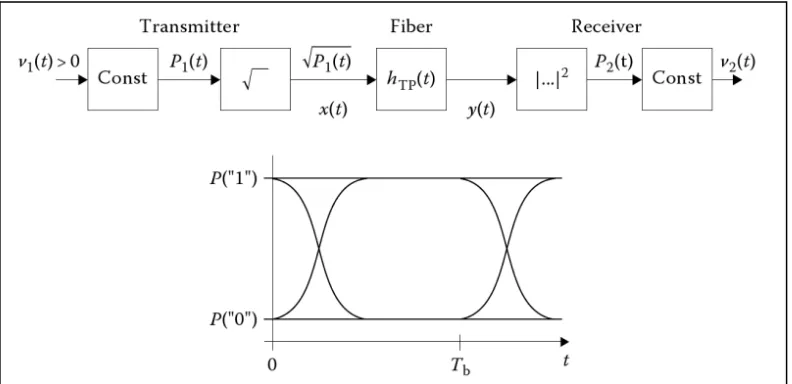
Figure 2.2 Schematic of an optical transmission system and its
equivalent transfer function 8
Figure 2.3 Eye diagram of time signals at 10Gb/s transmission over
an SSMF for 0, 20, 80km 9
Figure 2.4 Transmission Impairment 11
Figure 2.5 Chromatic dispersion curve 12
Figure 2.6 Dispersion coefficients for different types of fibers 12
Figure 2.7 Effect of chromatic dipersion 13
Figure 2.8 ISI effect due to chromatic dispersion 14
Figure 3.1 Flow chart of the project 19
Figure 3.2 Symbol of Optisystem 20
Figure 3.3 Layout for Optisystem Software 20
Figure 3.4 EDFA component library 21
Figure 3.5 Optical fibers library 21
Figure 3.6 Filters library 22
Figure 4.1 Design for (a) pre-compensation, (b) post-compensation
xiv
Figure 4.8 Graph for pre-, post-, and symmetrical dispersion compensation
at 2.5 Gbps 33
Figure 4.9 Graph for pre-, post-, and symmetrical dispersion compensation
at 10 Gbps 34
Figure 4.10 The parameter for 40 Gbps 35
Figure 4.11 Layout for 40 Gbps pre-compensation 36 Figure 4.12 Layout for 40 Gbps post-compensation 36 Figure 4.13 Pre-compensation at 40 Gbps in 240km 37 Figure 4.14 The result from optical spectrum analyzer 38 Figure 4.15 Optimum input signal simulation result for
pre-compensation in 360km 39
Figure 4.16 The result from optical spectrum analyzer 39 Figure 4.17 Optimum input signal simulation result for post-compensation in
240km 40
Figure 4.18 The result from optical spectrum analyzer 41 Figure 4.19 Optimum input signal simulation result for post-compensation in
360km 42
Figure 4.20 The result from optical spectrum analyzer 42 Figure 4.21 The graph for input power versus Q factor in 240km 44 Figure 4.22 The graph for input power versus Q factor in 360km 45 Figure 4.23 Layout design for chirp grating dispersion compensation 47
Figure 4.24 The FBG parameter 48
Figure 4.25 Result simulation for Gaussian function 49 Figure 4.26 Result simulation for Tanh function 49 Figure 4.27 Result simulation for Uniform function 50
xv
LIST OF ABBREVIATIONS
1. SMF - single-mode fiber 2. MMF - multi-mode fiber
3. DCF - dispersion compensating fiber 4. MAI - multi-access interference 5. OBI - optical beat interference
6. CWDM - Coarse Wavelength Division Multiplexing 7. DML - direct modulated laser
8. NRZ - nonreturn-to-zero
9. GVD - Group Velocity Dispersion 10.PMD - polarization mode dispersion 11.SPM - self-phase modulation 12.XPM - cross-phase modulation 13.FWM - four wave mixing 14.DSF - dispersion-shifted fibers 15.NZ-DSF - non-zero dispersion shifted 16.WDM - wavelength division multiplexing 17.EDFA - Erbium doped fiber amplifier 18.LAN - local area networks
19.MAN - metropolitan area networks 20.ISI - intersymbol interference 21.CW - continuous wave
1
CHAPTER 1
INTRODUCTION
1.1 PROJECT INTRODUCTION
With the growing needs for ultrahigh transmission speeds, optical fibre technology is becoming the replacement technology for the copper cable. The past 30 years have seen enormous strides in the fields of fibre optics and various device integrations. Many fibre optic devices are ready today for use in system applications and as commercial products within communication networks. However, extending the reach of optical transmissions at higher bit rates becomes a major challenge. Transmission impairments will generally affect optical transmission and decrease the quality of the optical signal along the propagation path.
1.2 PROBLEM STATEMENT
2
limit the possible data rate of a system for optical fiber communications and the attenuation of an optical signal would be limiting the availability of optical power along the transmission path. When the distance of the transmission increases it will cause more dispersion through the fibers.
1.3 OBJECTIVE OF THE PROJECT
There are several objective aim to be achieve in this project :
i. To study the performance of the optical fiber based on different distance. ii. To study the effect of dispersion on optical fiber.
iii. To design and simulate the dispersion by using Optisystem software. iv. To analyze the data taken from the simulation.
1.4 SCOPE OF THE PROJECT
In this project, the model of transmission system will be design and simulate by using OptiSystem Software. Then, the result of optical fibre signal will be recorded and comparing with the signal generated from input data. The output pulse will be monitored and analyzed from the result.
1.5 THESIS STRUCTURE
The thesis is organised with the project introduction and problem statement being discuss in the first chapter. This is to highlight the importance of this fundamental study. Project objective and scope of the project were also explain in this chapter.
3
4
CHAPTER 2
BACKGROUND STUDIES
Fibres that support many propagation paths or transverse modes are called multi-mode fibres (MMF), while those that only support a single mode are called single-mode fibres (SMF). MMF generally have a wider core diameter and used for short-distance communication links and for applications where high power must be transmitted. SMF are used for most communication links longer than 1,000 meters. Chromatic dispersion is the phenomenon in an optical fiber which occurred due to dependence of group index (Ng) to wavelength. Dependence of Ng to wavelength in an optical fiber produces a time extension in propagated pulses. Extension of pulses after a distance leads to errors in receiver [1].
5
Transmitted light in an FBG core which satisfies the Bragg conditions is resonated by grating structure and reflected. The FBG can also be used as an optical filter to block certain wavelengths. The reflected wavelength changes with the grating period and broadening of the reflected spectrum. The most important inclination of chirp FBG than other recommended types are small internal lose and cost efficiency [2].
2.1 Effect of The Fibre Optic Dispersion on Optical Transmission
Loss and dispersion are the major factors that affect optical fibre communication to develop in high capacity. Dispersion is defined because of the different frequency or mode of light pulse fibre transmits in different rates. At different time, the frequency components receive the fibre terminal and cause amount of distortion that will be lead to error. SMF performance is primarily limited by chromatic dispersion that occurs because of the glass index varies slightly depends on the wavelength of the light. Light from the real optical transmitters necessarily has nonzero spectral width [3]. If the dispersion getting too high, a group or pulses representing a bit-stream will spread in time make the bit-stream unintelligible. This is because of the length of the link limits or the information capacity of the fibre without regeneration [4].
2.1.1 Enhancing The Performance of Systems Using Negative and Positive Dispersion Fibers
6
In this section, the transmission performance depends on strongly on dispersion fiber and DML output power. If the DML output power is properly chosen, the systems demonstrated by using SMF fibers can achieve a good performance. Finally, we have found a mathematical expression that makes estimation for a power value to fix the laser power output for each channel in WDM systems. Figure 2.1 shows a simple arrangement the CWDM system performance is proposed.
Figure 2.1 : CWDM system performance
By selected 16 output channels with wavelengths, in agreement with Recommendation ITU-T G. 694.2. The pulse pattern was a periodic 128-bit OC-48 (2.5 Gb/s) nonreturn-to-zero (NRZ). After transmission through 100 km of fiber, channels are demultiplexed and detected using a typical pin photodiode. In this part, using the two kinds of optical fibers which it already laid and widely deployed single-mode ITU-T G.652 fiber (SMF) and also the ITUT-T G.655 fiber with a negative dispersion sign around C band (NZ-DSF).
7
In this work, main purpose in comparing the system performance based on the type of fiber and DML used; for this reason, the rest of link components have been modelled by considering ideal behaviour [4].
2.2 Transmission Impairment
The effect of dispersion on the system bit rate, is obvious and can be estimated by using the criterion in Eq.2.1,
(2.1)
Where = total pulse broadening
With the fiber length and the total dispersion ; and the source linewidth, it will become Eq.2.2 [5]:
(2.2)
8
Figure 2.2 : Schematic of an optical transmission system and its equivalent transfer function.
2.3(a)
9
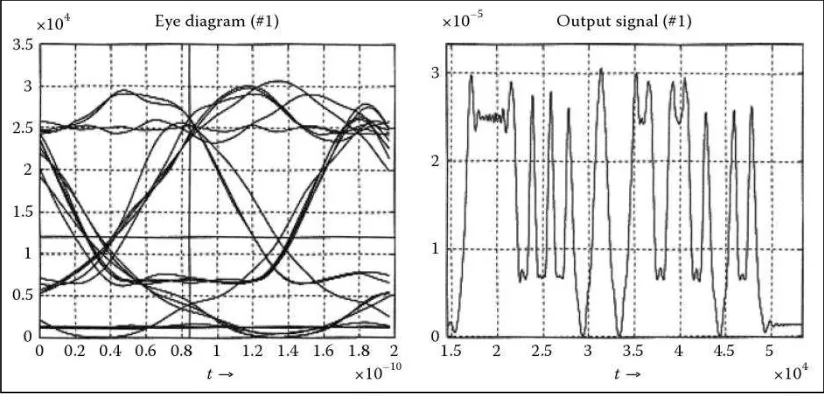
2.3(c)
Figure 2.3(a)(b)(c) : Eye diagram of time signals at 10Gb/s transmission over an SSMF for 0, 20, 80km.
Figure 2.3 shows the evolution of the sequence of pulses (right column) and the eye diagram (left column) at the various distance from the launched input [5]. Dispersion is the broadening of light pulses that propagates through the fiber and increases with the length of the fiber. Excessive of the dispersion caused over-lapping of adjacent pulses or inter symbol interference so that, the dispersion has a negative effect on the bandwidth of the fiber. When the dispersion getting higher, the bandwidth getting lower of the system. Dispersion also decreases the peak optical power of the pulse and then increasing the effective attenuation of a fiber [6].
The dispersion divided into three types which are intermodal, chromatic, and polarization mode dispersion. Intermodal dispersion can getting from results of the different propagation characteristics of higher-order transverse modes in waveguides and can limit the possible data rate of a system for optical fiber communications based on multimode fibers. Chromatic dispersion is the result of the wavelength dependence of the group velocity, vg. The most commonly used chromatic dispersion
parameter is D, defined as Eq.2.3 [4] :