Fouling with protein mixtures in microfiltration:
BSA–lysozyme and BSA–pepsin
L. Palacio
a, C.-C. Ho
b, P. Prádanos
a, A. Hernández
a,∗, A.L. Zydney
c aDepartment of Thermodynamics and Applied Physics, University of Valladolid, Valladolid E-47071, SpainbDepartment of Chemical Engineering, University of Cincinnati, Cincinnati, OH 45221, USA cDepartment of Chemical Engineering, The Pennsylvania State University, University Park, PA 16802-4400, USA
Received 16 May 2002; received in revised form 13 February 2003; accepted 14 February 2003
Abstract
Protein fouling during microfiltration has been investigated for mixtures of bovine serum albumin (BSA) and lysozyme and of BSA and pepsin. Flux decay curves were analyzed using a recently developed model that accounts for simultaneous pore blockage and cake formation. The model is in good agreement with the data and can be used to evaluate the effect of mixture composition on the concentration of protein aggregates and the properties of the protein deposit. For pepsin–BSA mixtures, the initial fouling appears to be dominated by the BSA, whereas the rate of cake growth occurs primarily by the pepsin. This behavior is consistent with the large concentration of pepsin aggregates and the electrostatic repulsive interactions between the negatively-charged BSA and pepsin. The behavior is more complex for mixtures of BSA and lysozyme. In this case, the fouling is dominated by the lysozyme, although mixtures with small amounts of added BSA foul more slowly than observed with either of the pure proteins.
© 2003 Published by Elsevier Science B.V.
Keywords:BSA; Pepsin; Lysozyme; Protein mixtures fouling; Microfiltration
1. Introduction
Fouling is a major limitation to the widespread use of membrane filtration[1]. A lot of studies have been made in order to avoid or control this problem. The fouling phenomenon is usually assumed to be due to adsorption or deposition on the membrane surface or within the membrane pores. While the term foul-ing is used in practice when referrfoul-ing to process and engineering deposits, the term adsorption, as defined by IUPAC committee [2], means “enhancement or
∗Corresponding author. Tel.:+34-983-423134;
fax:+34-983-423136.
E-mail address:[email protected] (A. Hern´andez).
depletion of one or more components in an interfacial layer”.
Ultrafiltration is used for protein concentration, buffer exchange, and clarification of solutions con-taining low molecular weight products. Protein foul-ing in ultrafiltration generally occurs on the external membrane surface since most proteins are too large to pass through the pores of the ultrafiltration mem-branes[3–5].
Microfiltration is a pressure-driven membrane pro-cess used for a wide range of separations in the biotechnology, food, beverage, and dairy industry, among others. Membrane fouling during microfiltra-tion can lead to more than an order of magnitude re-duction in the filtrate flux, even during the filtration of relatively clean protein solutions [6,7]. Recent work
has demonstrated that this fouling is typically caused by the deposition of large protein aggregates on the membrane surface[7–9]. However, fundamental stud-ies of membrane fouling have almost always been limited to solutions of a single protein. These results are very difficult to apply to the microfiltration of many food products (e.g. whey), beverages (e.g. beer and wine), and bioprocessing solutions (e.g. harvested cell culture fluid), all of which contain a complex mixture of a wide range of protein molecules.
Güell and Davis [10] have performed one of the only fundamental studies of fouling during microfil-tration of protein mixtures. Flux decline data were ob-tained with bovine serum albumin (BSA), lysozyme, and ovalbumin, both alone and in binary and ternary mixtures. Fouling by BSA or lysozyme alone was dominated by pore blockage (internal fouling), while ovalbumin showed a transition between pore blockage and cake filtration. Ovalbumin showed the greatest flux decline, which was attributed to the greater number of large aggregates of this protein present in solution. Protein mixtures containing ovalbumin showed a flux decline similar to that obtained with ovalbumin alone, suggesting that the ovalbumin aggregates dominated the fouling behavior. The flux decline with mixtures of BSA and lysozyme was mid-way between the fouling seen with the individual proteins. In contrast, the flux decline for mixtures of ovalbumin and lysozyme was greater than that observed with either of the pure pro-teins. No quantitative analysis was provided for any of these observations.
Ho and Zydney [11], have recently developed a combined pore blockage and cake filtration model for protein fouling. This model was shown to provide an excellent fit of flux decline data for bovine serum albumin [11] and for a series of four other model proteins [12]. The objective of this work is to study the fouling behavior of several well-defined protein mixtures, using this combined pore blockage—cake filtration model to obtain fundamental insights into the nature of the protein—protein interactions and their effect on membrane fouling.
2. Theory
The initial flux decline in this model arises from blockage of the membrane pores by physical
deposi-tion of large protein aggregates on the membrane sur-face:
dAopen
dt = −αQopenCb (1)
whereAopenis the area of the open (unblocked) pores, Qopenthe volumetric flow rate through the open pores, Cb the bulk protein concentration, andαis equal to the pore area blocked per unit mass of protein con-vected to the membrane surface. Unlike most prior pore blockage models, these aggregates are assumed to allow some fluid flow through the blocked pores. The resistance of the protein layer (Rp) continues to
increase with time as additional protein is convected to the membrane surface:
dRp
dt =f ′R′J
blockedCb (2)
wheref′is the fraction of protein in the bulk solution that contributes to the growth of the existing deposit,R′ the specific protein layer resistance, andJblockedis the
filtrate flux through the previously covered (blocked) pores on the membrane surface. The model explicitly accounts for the inhomogeneity in the resistance of the protein layer that arises because the deposit only grows over the time interval (t−tp), wheretpis the time
at which that particular region was first covered by a protein aggregate.Rpcan be evaluated by integration ofEq. (2)with:
wherePis the transmembrane pressure,µ the so-lution viscosity,Rm the resistance of the clean
mem-brane, and Rp0 is the resistance of the first layer of
Q =Q0
withRp evaluated fromEq. (4). The integration over tp accounts for the time dependent blockage of the
membrane surface.
Although Eq. (5)is relatively easy to evaluate nu-merically, Ho and Zydney[11]have also developed a much simpler analytical solution for the filtrate flow rate by assuming that the resistance of the protein layer over the fouled region of the membrane is uniform at its maximum value (given by Eq. (4)with tp = 0).
Using this assumption, the coefficient multiplying the exponential in the convolution integral inEq. (5) be-comes a constant and can be pulled outside of the in-tegral to give:
The first term inEqs. (5) and (6)represents the flow rate through the open pores and is equivalent to clas-sical pore blockage model. The second term describes the flow through the blocked pores. The flow rate is thus described by three key parameters: a pore block-age parameter α, the ratio of the initial resistance of the protein deposit to the membrane resistance
β = Rp0/Rm, and a parameter describing the cake
growthγ=2f′R′/(Rm+Rp0).
The best fit values of the parameters α, β, and γ
for the different protein mixtures were determined by minimizing the sum of the squared residuals between the filtrate flow rate data and the model calculations (Eq. (5)) using the method of steepest descent.
Table 1
Physical characteristics of proteins
Protein Sigma catalog number Source Molecular weight (kDa) (ku)a Isoelectric pH
Albumin (BSA) A7906 Bovine serum 67 4.7
Lysozyme A6876 Chicken egg 14 11.0
Pepsin P6887 Pig stomach 36 1.0
a1 kDa=1 ku.
3. Materials and methods
3.1. Chemicals
Phosphate buffered saline (PBS) solutions con-sisting of 0.03 M KH2PO4, 0.03 M Na2HPO4·7H2O,
and 0.03 M NaOH were prepared by dissolving pre-weighed quantities of the appropriate salts (Sigma, St. Louis, MO) in the desired volume of demonized water obtained from a Barnstead water purification system (Barnstead/Thermodyne, Dubuque, IA) with resistivity greater than 18 Mcm. All buffer solutions were pre-filtered through 0.2m pore size Gelman Supor-200 membranes (Gelman Science, Ann Arber, MI) to remove particulates and un-dissolved salts prior to use.
Experiments were performed using bovine serum albumin, chicken egg white lysozyme, and porcine pepsin, all obtained from Sigma (St. Louis, MO). Pro-teins, either alone or in binary mixtures, were dis-solved in PBS with the pH adjusted to 7 using NaOH as needed. All protein solutions were freshly prepared before each experiment and used within 8 h of prepa-ration. Sigma catalog numbers and physical property data for each protein are provided inTable 1.
3.2. Filtration experiments
reservoir containing additional protein solution. The system was re-pressurized (within 1 min) and the fil-trate flow rate was measured by timed collection using a digital balance (Sartorious Model 1580, Edgewood, NY). At the end of the filtration, the stirred cell was rinsed with PBS, and the steady state PBS flux was re-evaluated. All experiments were performed at room temperature (22±2◦C) and without stirring to avoid
protein aggregation during the filtration run [8,13]. Additional details on the experimental methods are provided by Ho and Zydney[11].
3.3. Colloidal properties
Zeta potentials for the proteins, both alone and in bi-nary mixtures, were measured by a ZetaMaster®from
Malvern Instruments Ltd. The measurement is based on the dispersion of light caused by colloidal parti-cles or macromolecules moving under the action of an electric field. The Doppler effect leads to a mea-surable frequency shift depending on the velocity of the particle that can be related to the electrophoretic mobility and in turn the particle zeta potential.
Measurements were done with 5 g L−1 protein so-lutions at 0.01 M ionic strength. This higher protein
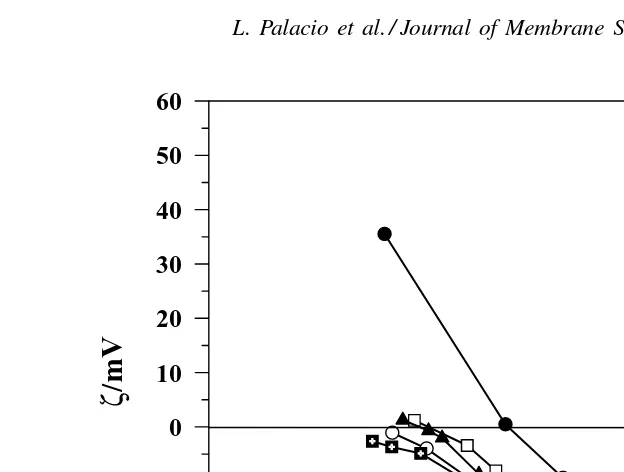
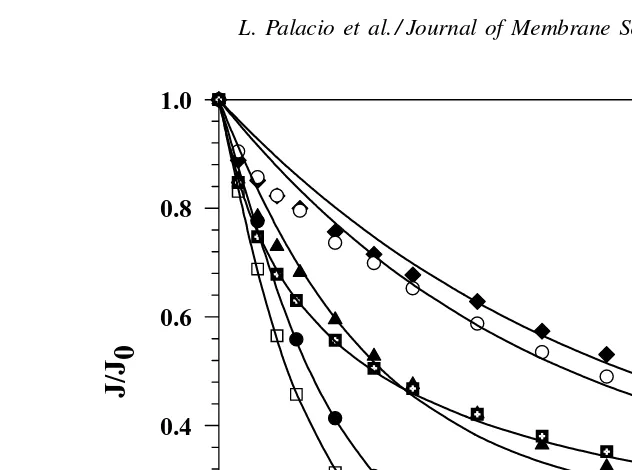
Fig. 1. Normalized permeate flux (J/J0) vs. time for pure BSA and pepsin and some mixtures. The used mixtures are characterized by its BSA % (M/M).
concentration and lower solution ionic strength were necessary to give a detectable light dispersion. Zeta potentials were measured over a range of pH, which was adjusted using phosphoric acid and NaOH.
Particle sizes and molecular weights were measured by laser light scattering using an Autosizer Lo-C® from Malvern Instruments Ltd. Data were obtained using 2 g L−1 protein solutions as in the filtration ex-periments.
4. Results and discussion
BSA+PEPSIN
pH
0 1 2 3 4 5 6 7 8 9 10 11 12
/mV
-40 -30 -20 -10 0 10 20 30 40 50 60
BSA
BSA (62%)-PEPSIN BSA (35%)-PEPSIN BSA (15%)-PEPSIN PEPSIN
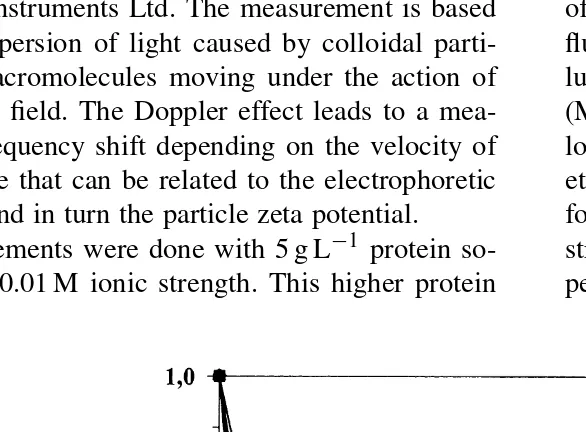
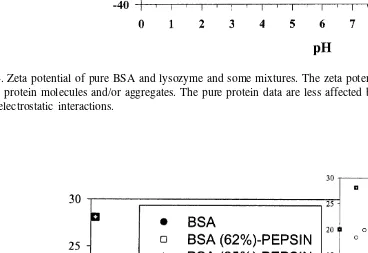
Fig. 2. Zeta potential of pure BSA and pepsin and some mixtures. The zeta potentials for mixtures correspond to the average mobilities of the protein molecules and/or aggregates. The pure protein data are less affected by this difficulty and thus give an adequate measure of their electrostatic interactions.
aggregates present in the bulk protein solution. At pH 7, pepsin and BSA both have a very similar negative charge (Fig. 2), thus the two proteins will exhibit re-pulsive electrostatic interactions under these filtration conditions. Fig. 2 shows the effective zeta potential of the pepsin–BSA mixtures as a function of solution pH. At pH 7, the conditions of the filtration experi-ments, the zeta potential was about−20 mV indepen-dent of the composition of the protein mixtures. This suggests that there is minimal change in the extent of protein aggregation in the mixtures; a significant al-teration in the effective protein size would affect the electrophoretic mobility, and thus the zeta potential, as measured by the ZetaMaster®.
The solid curves in Fig. 1 are the model calcula-tions. The best fit values of the three model parame-ters (α,β, andγas given inTable 2) were determined by minimizing the sum of the squared residuals be-tween the model and the experimental data for each of the protein mixtures separately. The model provides a good fit of the data, properly capturing the rapid flux decline seen at the start of the filtration as well as the more gradual decline in flux seen at very long
filtra-tion times. The physical significance of the model pa-rameters is discussed subsequently.
The flux decay data for mixtures of BSA and lysozyme (Fig. 3) show a very different behavior than that seen for BSA and pepsin. In particular, the protein mixtures containing less than 39% (M/M) of
Table 2
Fouling parameters for BSA–pepsin and BSA–lysozyme mixtures BSA (%) α(s−1) β γ (m2s−1)×10−4 BSA+pepsin
100 8.35±0.04 18.1±0.7 940±60 62 6.33±0.17 17.6±0.7 370±30 35 10.6±0.4 17.5±0.7 1000±80 15 14.4±0.5 16.9±0.7 1400±300
0 25.5±0.5 6.3±1.1 3400±200 BSA+lysozyme
100 8.35±0.04 18.1±0.7 940±60 67 9.26±0.10 1.0±0.2 900±20 39 5.8±0.7 1.1±0.7 60±11 18 2.2±1.0 1.7±0.3 24±2
t (min)
0 10 20 30 40 50 60
J/J
0
0.0 0.2 0.4 0.6 0.8 1.0
BSA
BSA(67%)-LYS BSA(39%)-LYS BSA(18%)-LYS BSA(6.5%)-LYS LYS
Fig. 3. Normalized permeate flux (J/J0) vs. time for pure BSA and lysozyme and some mixtures. The used mixtures are characterized by its BSA % (M/M).
BSA foul even less than that for the pure lysozyme. This effect can be quite dramatic, with the mixture with 6.5% (M/M) BSA giving a flux at t = 30 min that is 39% larger than the flux for the pure lysozyme solution. This seemingly anomalous behavior is likely due to electrostatic attraction between the two pro-teins which are oppositely-charged at pH 7 as shown by the zeta potential data inFig. 4. This phenomenon is discussed in more detail subsequently. In contrast to the zeta potential results for the BSA–pepsin mix-tures, the effective zeta potential for the mixtures of BSA and lysozyme increases with decreasing con-centration of BSA. At pH 7, the solution that contains only 6.5% BSA still has a negative zeta potential, despite the fact that the pure lysozyme has a zeta potential of+4 mV under these conditions.
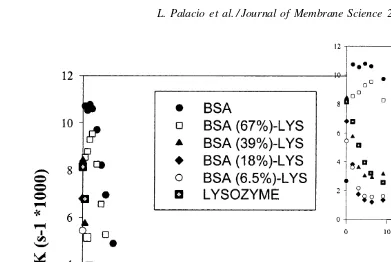
The filtrate flux data inFigs. 1 and 3, were used to evaluate the relative rate of flux decline,K, defined as:
K= −1 Q
dQ
dt (7)
where the derivative was evaluated numerically us-ing appropriate difference representations accurate to O(t2). Results are shown as a function of filtration
time for the BSA–pepsin and the BSA–lysozyme mix-tures in Figs. 5 and 6, respectively. Kelly [14] has shown that the relative rate of flux decline passes through a distinct maximum under conditions where native (non-aggregated) protein is able to add to the growing deposit on the membrane surface. For exam-ple, Kelly[14]showed that the maximum in the rate of flux decline for proteins with free sulfydryl groups was due to the chemical attachment of monomeric proteins to existing aggregates on the membrane. Blockage of the free –SH groups in BSA eliminated the maximum since the proteins could no longer form these inter-molecular disulfide linkages[14]. Proteins like pepsin and lysozyme, which have no –SH groups, generally do not show significant maxima. However, some pro-teins which had no –SH or –S–S– groups, in particular myoglobin, did present a marked maximum inKthat was likely due to the presence of other types of strong intermolecular interactions.
Fig. 4. Zeta potential of pure BSA and lysozyme and some mixtures. The zeta potentials for mixtures correspond to the average mobilities of the protein molecules and/or aggregates. The pure protein data are less affected by this difficulty and thus give an adequate measure of their electrostatic interactions.
Fig. 6.Kvs. time for pure BSA and lysozyme and some mixtures. The mixtures used are characterized by their BSA % (M/M).
very clear maximum seen with the mixture containing only 15% BSA suggests that the fouling in this system is determined largely by the presence of the BSA even though the normalized flux data (Fig. 1) fall almost half-way between those of the pure BSA and pure pepsin solutions. The initial rate of flux decline (the value of Katt = 0) increases monotonically as the relative fraction of BSA decreases, going from a value of(2.65±0.02)×103s−1for the pure BSA solution to(20.02±0.02)×103s−1for the pure pepsin. This behavior is discussed in more detail subsequently.
The rates of flux decline for the BSA–lysozyme mixtures (Fig. 6) show a clear maximum only for the pure BSA and 67% (M/M) BSA solutions. Thus, the presence of more than around 50% M/M of lysozyme appears to “block” the intermolecular interactions that give rise to the maxima, which for BSA are directly at-tributable to the formation of intermolecular disulfide linkages associated with the free –SH groups of BSA. This effect could be due to both chemical and elec-trostatic interactions between the BSA and lysozyme under these experimental conditions.
In order to study the fouling mechanisms in more detail, the flux decline data have been analyzed using the combined pore blockage and cake filtration model developed by Ho and Zydney[11]. This model allows us to evaluate three key fouling parameters:α, which is related to rate of pore blockage;β, which is related to the initial resistance of the protein aggregate on the membrane; andγ, which is related to the rate of cake formation. The best fit values of these parameters for the different protein mixtures are summarized in Table 2.
The rapid fouling of pepsin compared to BSA is due to the much larger values of bothαandγ, cor-responding to larger rates of both pore blockage and cake growth for the pepsin. This is a direct result of the much larger number of aggregates in the pepsin solution[12]. The effective size determined using the Autosizer Lo-C®for the 2 g L−1pepsin solution was
Table 3
Effective size determined by light scattering
Size (nm)
Pepsin 366
BSA 8
BSA–lysozyme 50% (M/M) BSA 9
BSA–lysozyme 18% (M/M) BSA 7
αandγ, the initial resistance of the protein aggregates (as given by the parameter β) was greater for BSA than for pepsin, which could be related to the ability of BSA to form denser aggregates through intermolec-ular disulfide linkages.
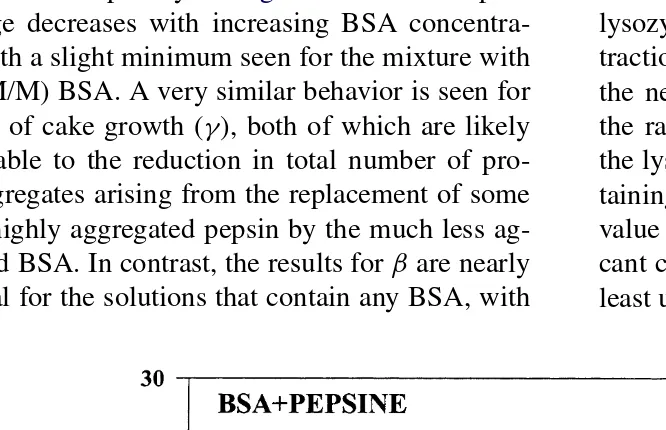
The dependence of the fouling parameters on the BSA concentration in the BSA–pepsin mixtures is ex-amined more explicitly in Fig. 7. The rate of pore blockage decreases with increasing BSA concentra-tion, with a slight minimum seen for the mixture with 62% (M/M) BSA. A very similar behavior is seen for the rate of cake growth (γ), both of which are likely attributable to the reduction in total number of pro-tein aggregates arising from the replacement of some of the highly aggregated pepsin by the much less ag-gregated BSA. In contrast, the results forβare nearly identical for the solutions that contain any BSA, with
Fig. 7. Parameters of the fouling model, α,βandγ, for pure BSA and pepsin and some mixtures. The mixtures used are characterized by their BSA % (M/M).
these values being nearly three times as large as the
β-value determined for the pure pepsin. These data suggest that the very first aggregates that deposit on the membrane are likely the more dense BSA aggre-gates, with the subsequent cake formation dominated by the aggregates of pepsin.
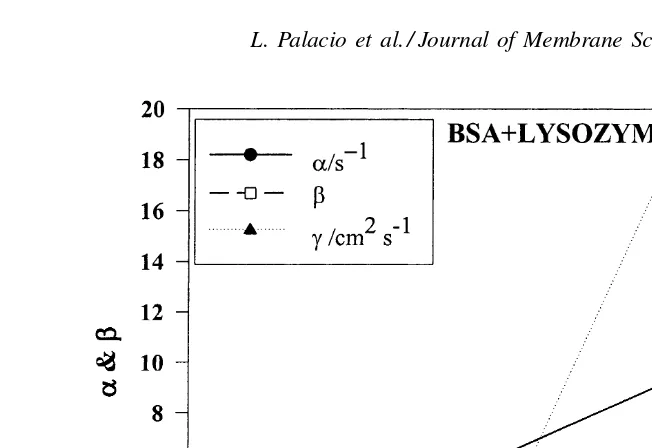
As shown in Table 2, all three fouling parame-ters for BSA are larger than the corresponding val-ues for lysozyme. The value of α for BSA is about 3.2 times as large as that for lysozyme while the β
value is 11-fold larger and the γ-value is nearly 24 times as large. The results for the BSA–lysozyme mixtures are particularly interesting. The values ofβ
Fig. 8. Parameters of the fouling model,α,βandγ, for pure BSA and lysozyme and some mixtures. The mixtures used are characterized by their BSA % (M/M).
is very similar to the behavior seen with the rate of flux decline data for these protein mixtures inFig. 3. These results suggest that the lysozyme may be able to block the disulfide-mediated interactions between the BSA and the growing deposit. In addition, the initial lysozyme deposit may act as a pre-filter, capturing the BSA aggregates before they are able to reach the mem-brane surface. A similar phenomenon has been seen by Arora and Davis[15], in the microfiltration of mixtures of yeast and BSA, with the yeast cells causing a signif-icant reduction in BSA fouling by acting as a pre-filter. The values ofαandγfor the BSA–lysozyme mix-ture with 18% BSA are both smaller than the corre-sponding values of these parameters for either the pure lysozyme or the pure BSA, which is the origin of the relatively small amount of flux decline seen with this protein mixture inFig. 3. The small values ofαandγ
for the 18% BSA mixture are due, at least in part, to the smaller mass concentration of the lysozyme in this protein mixture. For example, if the initial pore block-age was completely due to lysozyme, with no contri-bution at all from BSA, then the value ofαfor the 18% BSA mixture would be expected to be 2.1 s−1, which
is in fairly good agreement with the experimental re-sult. Similarly, the value of γ would be expected to be 32.5×10⁴m2s−1, which is somewhat higher than
what was determined from the fouling analysis, sug-gesting that there is at least a small contribution from the BSA aggregates to the cake growth. The data pro-vide no epro-vidence for any increased aggregation in the BSA–lysozyme mixture, even though the proteins are oppositely-charged at pH 7. This was confirmed by the light scattering data, which show an effective size for the BSA–lysozyme mixture containing 18% BSA of about 7 nm compared to 8 nm for the pure BSA and 9 nm for the mixture with 50% BSA. It was not possible to determine the size for the pure lysozyme (around 1.6 nm[16]) solution since it was below the detection limit of 3 nm for the Autosizer. However, this result does indicate that there are very few aggre-gates present in the pure lysozyme solution, consistent with the relatively little fouling seen with this protein compared to that for either pepsin or BSA. The small increase in effective size for the mixture containing 50% BSA may be the cause of the small maximum in
αseen inFig. 8for the mixture with 67% BSA.
5. Conclusions
were performed with pepsin and lysozyme, two pro-teins with very different sizes and charges, in mixtures with BSA in different molecular proportions. The flux decay curves have been analyzed in terms of a recently developed model that accounts for simulta-neous pore blockage and cake formation. The effect of the mixture composition on the model parameters has been used to provide additional insights into the fouling mechanisms.
For pepsin–BSA mixtures, the initial fouling ap-pears to be dominated by the BSA, whereas the rate of cake growth occurs primarily by the pepsin. This behavior is consistent with the very dense structure of the BSA aggregates, which may be associated with the presence of intermolecular disulfide linkages be-tween the proteins within the aggregate. The large contribution of pepsin to the rate of cake growth is due to the very large concentration of pepsin aggre-gates in these mixtures. The data show minimal inter-actions between the pepsin and BSA, consistent with the repulsive electrostatic interactions between these negatively-charged proteins.
The behavior is more complex for mixtures of the oppositely-charged BSA and lysozyme. In this case, the pore blockage and cake growth both appear to be dominated by the lysozyme. However, mixtures with small amounts of added BSA actually foul more slowly than either of the pure proteins.
Acknowledgements
The Spanish authors would like to acknowledge the financial support of this work through projects of the “Plan Nacional de Investigación y Desarrollo” MAT1999-0989 and VA62-00B of the Junta de Castilla y León.
References
[1] E. Iritani, S. Tachi, T. Murase, Influence of protein adsorption on flow resistance of microfiltration membrane, Colloids Surf. A 89 (1994) 15.
[2] Manual of symbols and terminology for physicochemical quantities and units. Appendix II. Definitions, terminology and symbols in colloid and surfaces chemistry (Part I). Pure Appl. Chem. 31 (1972) 579.
[3] E. Iritani, T. Watanabe, T. Murase, Effects of pH and solvent density on dead-end upward ultrafiltration, J. Membr. Sci. 69 (1992) 87.
[4] P. Prádanos, A. Hernández, J.I. Calvo, F. Tejerina, Mechanisms of protein fouling in cross-flow UF through an asymmetric inorganic membrane, J. Membr. Sci. 114 (1996) 115.
[5] P. Aimar, S. Baklouti, V. Sánchez, Membrane–solute interactions: influence on pore solvent transfer during ultrafiltration, J. Membr. Sci. 29 (1986) 207.
[6] W.R. Bowen, Q. Gan, Properties of microfiltration mem-branes; flux loss during constant pressure permeation of bovine serum albumin, Biotechnol. Bioeng. 38 (1991) 688. [7] G. Belfort, R.H. Davis, A.L. Zydney, The behaviour of
suspensions and macromolecular in crossflow microfiltration, J. Membr. Sci. 96 (1994) 1.
[8] S.T. Kelly, W.S. Opong, A.L. Zydney, The influence of protein aggregates on the fouling of microfiltration membranes during stirred cell filtration, J. Membr. Sci. 80 (1993) 175. [9] C.C. Ho, A.L. Zydney, Effect of membrane morphology on
the initial rate of protein fouling during microfiltration, J. Membr. Sci. 155 (1999) 261.
[10] C. Güell, R.H. Davis, Membrane fouling during microfiltration of protein mixtures, J. Membr. Sci. 119 (1996) 269.
[11] C.C. Ho, A.L. Zydney, A combined pore blockage and cake filtration model for protein Fouling during microfiltration, J. Colloid Interface Sci. 232 (2000) 389.
[12] L. Palacio, C.C. Ho, A.L. Zydney, Application of a pore blockage-cake filtration model to protein fouling during microfiltration, Biotech. Bioeng. 79 (2002) 260.
[13] M. Meireles, P. Aimar, V. Sánchez, Albumin denaturation during ultrafiltration: effects of operating conditions and consequences on membrane fouling, Biotech. Bioeng. 38 (1991) 528.
[14] S.T. Kelly, Mechanisms for protein fouling during micro-filtration, Ph.D. Thesis, University of Delaware, Newark, Delaware, 1995.
[15] N. Arora, R.H. Davis, Yeast cake layers as secondary membranes in dead-end microfiltration of bovine serum-albumin, J. Membr. Sci. 92 (3) (1994) 247.