The 2nd International Conference on Science, Technology, and Humanity ISSN: 2477-3328
Decision Tree Induction for Classifying
the Cholesterol Levels
Yusuf Sulistyo Nugroho1*, Dedi Gunawan2
1,2Universitas Muhammadiyah Surakarta, Informatics Department
Jl. Ahmad Yani Tromol Pos I Surakarta, Indonesia
Abstract
Cholesterol is a soft, yellow, and fatty substance produced by the body, mainly in the liver. Every day, liver produces about 800 milligrams of cholesterol which is derived from animal products, seafood, milk, and dairy products. At normal levels, cholesterol is useful for health, because it is one of the essential fats required by the body for cell formation. Meanwhile, cholesterol levels are classified into three categories: normal, high, and low. The cholesterol levels can be affected by several factors that are sometimes not widely known by common people. The objective of this study was to determine the level of significance of each factor that affects cholesterol levels and to find the value of accuracy, precision and recall of the algorithms used in decision tree induction. The selection criterions used were the information gain, gini index and gain ratio to find the level of significance of the factors that affect cholesterol levels. Variables that affect cholesterol levels divided into four types, namely gender, age, history of smoking, and history of diabetes. The result showed that the most influence factors on cholesterol levels based on training data processed using three algorithms was the history of diabetes. Meanwhile, the highest accuracy was obtained by the information gain which was 56.14%. The recall values were distributed evenly for all three algorithms, it indicated the equality of those three algorithms. The information gain and the gain ratio had equal precision values (57.58%), however, they had higher precision in compared with the gini index. In contrast, the gain ratio was higher than the information gain and the gini index concerning with the RMSE of 0.564.
Keywords: cholesterol levels, decision tree, gain ratio, gini index, information gain.
1.
Introduction
The 2nd International Conference on Science, Technology, and Humanity ISSN: 2477-3328
Dr. Moewardi Hospital is a public hospital in Surakarta Indonesia which has been providing community health services since 1912. Nowadays, this hospital is prominent for its service in providing the assessment of cholesterol levels which classified into three classes of level: high, normal, and low level. Cholesterol level is influenced by four attributes, namely, gender, age, the history of smoking, and the history of diabetes. The cholesterol level assessment is the most frequent service done by the laboratory in Dr. Moewardi hospital, even it reached up to more than a hundred checkups per day. As a consequence, thousands data related to cholesterol is accumulated and stored in the database.
Data mining is one of the best solutions offered to discover the knowledge over accumulated data to produce strategic information. Data mining is the extraction of hidden data in the large database to help organizations focus on the most significant information from their data warehouses (Deshpande & Thakare, 2010). By implementing this technique, the information of cholesterol levels as well as the most significant variable causing the increase of cholesterol level can be examined from the large database owned by the hospital. Thus, the
prediction of patient’s level of cholesterol is highly depended on the given attributes. In
compared with the common application of conventional method, the data mining technique provides the efficient and accurate information.
Based on the background, the study aimed to provide the strategic information of cholesterol levels from a large database in Dr. Moewardi hospital by using three different criteria in the decision tree induction to sort the objects of the data based on the attributes. In addition, the comparison between the three methods to find out the method with the highest level of accuracy, recall and precision was also performed.
2.
Methodology
2.1 Definition of Variables and Classes
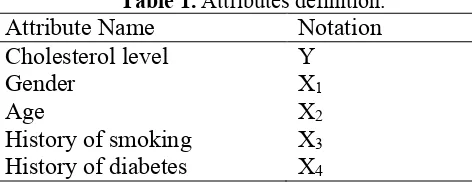
The decision tree induction was applied to classify the data. The required variables were divided into two types: X was defined as an independent variable, while Y was defined as dependent variable. The variable X was divided into four attributes: gender, age, history of smoking and history of diabetes, while the variable Y was specified as the cholesterol level. The definition of variables used in this study is shown in Tab.1.
Table 1.Attributes definition.
The 2nd International Conference on Science, Technology, and Humanity ISSN: 2477-3328
Table 2.Attribute types and classes
Attribute Type Class
Y Polynominal High, Normal, Low
X1 Binominal Male, Female
X2 Polynominal Old, Adult, Child
X3 Binominal Yes, No
X4 Binominal Yes, No
2.2 Data Collection
The data used in this study was extracted from the patients’ medical record related to the
cholesterol levels during the year of 2015 obtained from Dr. Moewardi Hospital. The samples were 383 data from the population of 9,000 data selected by using Slovin formula shown in Eq. 1 (Heruna & Anita, 2014), with confidence level 95%. The captured data were then distributed into two different groups of training and testing dataset.
= + (2)
Where n is the sample size, N is the population size, and e is the level of precision = 0.5 is
assumed for Eq. 1.
2.3 Decision Tree Induction
The study object in most of study areas have used the induction to create the rule automatically in the form of decision tree where the data exploration procedures are developed. Decision tree is a data structure contains of nodes and edges that can be applied efficiently for classification (Barros, de Carvalho, & Freitas, 2015). The advantage of the decision tree is the ability to classify the objects from the root node to several leaf nodes by sorting the objects down through the edge of the tree (Raileanu & Stoffel, 2004).
The criteria of selections used in the decision tree to sort the objects were the information gain, the gini index, and the gain ratio.
2.4 Information Gain
Information gain is used to find the entropy which is a measure of the objects impurity value (Yang, Dang, & Fischer, 2011). In this case, the entropy of the output values of the training data is investigated. Entropy is also known as the average quantity of information required to convert the output value. Eq. 2 and Eq. 3 show the formula to find the entropy and the information gain (Schouten, Frasincar, & Dekker, 2016).
= − ∑ | log | (2)
Where S is a set of all features and p(i|S) is the section of the features in S fit in class i.
The 2nd International Conference on Science, Technology, and Humanity ISSN: 2477-3328
Where Values(t) is the set of all probable values for feature t. Sv is the subclass of S with
features of class v associated to feature t. St is the set of all features fit in feature t. |·| means the set cardinality. The greater the information gain value, the better the attribute chosen in a node.
2.5 Gini Index
A feature selection based on gini index is a method to split the impurity of the objects which is usually appropriate to binary, continuous numeric type values, etc. (Manek, Shenoy, Mohan, & Venugopal, 2016).
Suppose: the set of data samples is S, a class object is denoted by k, (k=1,2,..., c) where c
is the number of classes for dependent output y, then the gini index for a tree branch of S is
shown in Eq. 4.
� = − ∑ �
=
(4)
Pk is the ratio of observation in S included in class k. The smaller the gini index value, the lesser
the impurity, the better the attribute used in a node.
2.6 Gain Ratio
Gain ratio selection criterion used entropy as well as information gain to find the impurity value. The decline in entropy in numerous partitions is compensated by the gain ratio which is calculated by dividing the information gain with its split information(Barros et al., 2015). Eq. 5 shows the gain ratio formula (Kotsiantis, 2013).
, � =� � , � , � (4)
categories, |Si|/|S| is the probability of the class number i in the attribute.
2.7 Evaluating Performance
Three selection criterions were used to construct the decision tree. However, in order to test the performance of these algorithms, the accuracy, recall, and precision were applied as the measure. Accuracy is considered as a proportion of properly classified classes to all classes (Viikki, Juhola, Pyykkö, & Honkavaara, 2001).
The 2nd International Conference on Science, Technology, and Humanity ISSN: 2477-3328
Meanwhile, recall and precision defined the methods used in the information retrieval field to measure how fit the expected appropriate items can recovers an information retrieval system (Ting, 2010). The measures are defined as in Eq. 6 and Eq. 7.
= � +� (6)
� = �
� + � (7)
TP, TN, FP and FN are true positive classes, true negative classes, false positive classes
and false negative classes, respectively.
Root mean square error (RMSE) is also evaluated for each algorithm. RMSE is a formula to find the dissimilarity between the estimated values by a model and the experimental values.
The interval value of RMSE is from 0 to ∞. The lower the RMSE values, the better the model used (Farnadi et al., 2016). RMSE can be described as in Eq. 8.
= √∑ (= ���− � ) (8)
Where ��� is the experimental values for items i and � is the estimated values for items i
(i=1, 2, ...,n) and n is the data sample size.
3.
Results and Discussion
3.1. Constructing Decision Tree
The decision trees for each algorithm were constructed with by using the RapidMiner Studio software tool. The nodes in the tree were arranged based on the procedure of the selection criterion. The attribute which was ruled as a root node can be considered as the most significant
variable that affected the patients’ cholesterol levels. The information gain, gini index, and gain
The 2nd International Conference on Science, Technology, and Humanity ISSN: 2477-3328
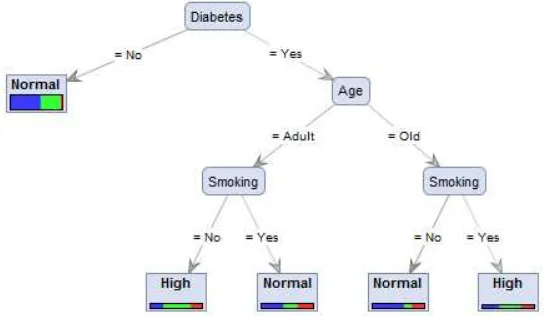
It can be seen from Fig. 1 that the most influencing factor in determining the cholesterol levels was the history of diabetes due to its role as a root node in the tree. More detail description of the tree is presented in Fig. 2.
Tree
Diabetes = No: Normal {Normal=159, High=101, Low=8} Diabetes = Yes
| Age = Adult
| | Smoking = No: High {Normal=11, High=22, Low=9} | | Smoking = Yes: Normal {Normal=12, High=7, Low=8} | Age = Old
| | Smoking = No: Normal {Normal=21, High=5, Low=8} | | Smoking = Yes: High {Normal=4, High=5, Low=3}
Figure 2.Description of the information gain and gini index-based decision tree.
Based on the decision tree in Fig. 2, the explanation can be elaborated in detail.. In case a person does not have diabetes, it can be predicted she/he will have normal cholesterol level. In contrast, in case a person has the history of diabetes, then the cholesterol level will relate to the age and the history of smoking. For example, if a person is in adult age with the absence history of smoking, it is highly possibility she or he will have high level cholesterol. Nevertheless, a person with history of smoking has a possibility to have normal condition. As described in the decision tree, a person in old age group with the absence of the history of smoking is estimated to have normal cholesterol level. Contradictory, the presence of history of smoking will affect the high probability in having cholesterol.
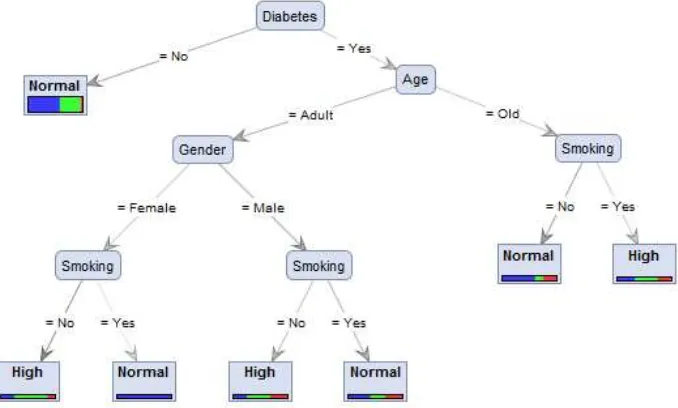
In fact, the tree generated from the implementation of the gain ratio as the selection criterion was different to the first tree. However, the only difference was in the second level
internal node of ‘Gender’ that was considered as the posterior influencing factors in determining the cholesterol level following the adult as a branch of the internal node of ‘Age’. It can be seen
in Fig. 3.
The 2nd International Conference on Science, Technology, and Humanity ISSN: 2477-3328
The tree as presented in Fig. 3 is described specifically in Fig. 4. The figure demonstrates that the adult females or males with the history of diabetes and the absence history of smoking, are predicted to have high cholesterol. However, if there is the history of smoking, the individual are estimated to have normal cholesterol level.
Tree
Diabetes = No: Normal {Normal=159, High=101, Low=8} Diabetes = Yes
| Age = Adult | | Gender = Female
| | | Smoking = No: High {Normal=6, High=14, Low=3} | | | Smoking = Yes: Normal {Normal=1, High=0, Low=0} | | Gender = Male
| | | Smoking = No: High {Normal=5, High=8, Low=6} | | | Smoking = Yes: Normal {Normal=11, High=7, Low=8} | Age = Old
| | Smoking = No: Normal {Normal=21, High=5, Low=8} | | Smoking = Yes: High {Normal=4, High=5, Low=3}
Figure 4.Description of decision tree based on the gain ratio.
The 2nd International Conference on Science, Technology, and Humanity ISSN: 2477-3328
3.2. Performance Evaluation
The performance of the three algorithms used in classifying the cholesterol levels can be defined based on their accuracy, recall, precision and RMSE which were calculated using Eq. 5, 6, 7, and 8, respectively.
Table 3.Data distribution using the information gain.
true Normal true High true Low
pred. Normal 190 (TP) 115 (FP) 25 (FP)
pred. High 17 (FN) 25 (TN) 11 (FN)
pred. Low 0 (FN) 0 (FN) 0 (TN)
Based on the data in Tab. 3, the accuracy, recall, and precision of the information gain were 56.14%, 91.79%, and 57.58%, respectively. Meanwhile, the RMSE of the algorithm was 0.568.
Table 4.Data distribution using the gini index.
true Normal true High true Low
pred. Normal 190 117 25
pred. High 15 20 11
pred. Low 2 3 0
From the data in Tab. 4, it can be examine that the accuracy, recall, and precision of the gini index were, 54.83%, 91.79% and 57.23%, respectively. The RMSE of the gini index was similar with the information gain which was 0.568.
Table 5.Data distribution using the gain ratio.
true Normal true High true Low
pred. Normal 190 116 24
pred. High 17 24 12
pred. Low 0 0 0
The performance of gain ratio were derived from the data in Tab. 5, it indicated that the accuracy, recall, and precision of were 55.87%, 91.79%, and 57.58%, respectively. However, the RMSE of the gain ratio was nearly under both prior algorithms which was 0.564.
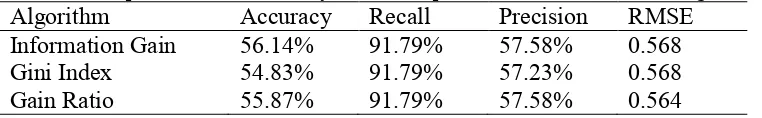
The comparison of the three algorithms performance used in this study is described in Tab. 6. The table shows that the information gain had higher accuracy which was 56.14% in compared with other two algorithms; even though it has similar precision with the gain ratio (57.58%) which was higher than the gini index. In addition, the information gain also had similar RMSE value with the gini index (0.568), which was higher than the gain ratio (0.564). Concerning with the recall value, all three algorithms had the same value which was 91.79%.
Table 6.Comparison of the accuracy, recall and precision between the three algorithms.
Algorithm Accuracy Recall Precision RMSE
Information Gain 56.14% 91.79% 57.58% 0.568
Gini Index 54.83% 91.79% 57.23% 0.568
The 2nd International Conference on Science, Technology, and Humanity ISSN: 2477-3328
4.
Conclusion
In this study, we carried out a comparative investigation among the three popular algorithms (information gain, gini index, and gain ratio) which were in the decision tree to classify the cholesterol levels. The strategic information from the data of patients in 2015 had been obtained through the decision tree. It can be concluded based on the constructed decision
tree, that the history of diabetes had a very significant role in determining the individual’s
cholesterol level. It was evidenced by the attribute of the root node.
This study also examined the performance of each algorithm. Based on the result of the analysis, the highest accuracy was obtained by the implementation of the information gain. The recall values were distributed evenly for all three algorithms, it means that the recall performance of those algorithms was equal. The information gain and the gain ratio had equal precision values, however, they had higher performance than the gini index. Meanwhile, the gain ratio had better performance than the information gain and the gini index since it had the lowest RMSE value. However, it did not confirm that the previous statements can be applied into any other cases. The result may be different for other cases. It depends on the provision of training data samples.
References
Barros, R. C., de Carvalho, A. C. P. L. F., & Freitas, A. A. (2015). Decision-Tree Induction. In
Automatic Design of Decision-Tree Induction Algorithms (pp. 7–45). Springer
International Publishing. http://doi.org/10.1007/978-3-319-14231-9.
Deshpande, S. ., & Thakare, V. . (2010). Data Mining System and Applications: A Review.
International Journal of Distributed and Parallel Systems, 1(1), 32–44.
http://doi.org/10.5121/ijdps.2010.1103.
Eriksson, M., Forslund, A.-S., Jansson, J.-H., Soderberg, S., Wennberg, M., & Eliasson, M. (2016). Greater decreases in cholesterol levels among individuals with high cardiovascular risk than among the general population: the northern Sweden MONICA
study 1994 to 2014. European Heart Journal, (March 2, 2016), 0–7.
http://doi.org/10.1093/eurheartj/ehw052..
Farnadi, G., Sitaraman, G., Sushmita, S., Celli, F., Kosinski, M., Stillwell, D., De Cock, M.
(2016). Computational personality recognition in social media. User Modeling and
User-Adapted Interaction, 26(2), 109–142. http://doi.org/10.1007/s11257-016-9171-0.
Heruna, T., & Anita, R. (2014). Data Monitoring Of Student Attendance At Bina Nusantara
University Using Control Charts. IOSR Journal of Research & Method in Education
(IOSR-JRME), 4(4), 23–31. Retrieved from
http://www.iosrjournals.org/iosr-jrme/papers/Vol-4 Issue-4/Version-3/E04432331.pdf.
Kotsiantis, S. B. (2013). Decision trees: A recent overview. Artificial Intelligence Review,
39(4), 261–283. http://doi.org/10.1007/s10462-011-9272-4.
Manek, A. S., Shenoy, P. D., Mohan, M. C., & Venugopal, K. R. (2016). Aspect term extraction for sentiment analysis in large movie reviews using Gini Index feature selection method
The 2nd International Conference on Science, Technology, and Humanity ISSN: 2477-3328
of Cardiology, 52(22), 1769–1781. http://doi.org/10.1016/j.jacc.2008.08.039.
Raileanu, L. E., & Stoffel, K. (2004). Theoretical comparison between the Gini Index and
Information Gain criteria. Annals of Mathematics and Artificial Intelligence, 41(1), 77–
93. http://doi.org/10.1023/B:AMAI.0000018580.96245.c6.
Schouten, K., Frasincar, F., & Dekker, R. (2016). An Information Gain-Driven Feature Study
for Aspect-Based Sentiment Analysis. In Natural Language Processing and Information
Systems (pp. 48–59). Springer International Publishing.
http://doi.org/10.1007/978-3-540-73351-5.
Suknovic, M., Delibasic, B., Jovanovic, M., Vukicevic, M., Becejski-Vujaklija, D., & Obradovic, Z. (2012). Reusable components in decision tree induction algorithms.
Computational Statistics, 27(1), 127–148. http://doi.org/10.1007/s00180-011-0242-8.
Ting, K. M. (2010). Precision and Recall. In C. Sammut & G. I. Webb (Eds.), Encyclopedia of
Machine Learning (p. 781). Boston, MA: Springer US.
http://doi.org/10.1007/978-0-387-30164-8_652.
Viikki, K., Juhola, M., Pyykkö, I., & Honkavaara, P. (2001). Evaluating training data suitability
for decision tree induction. Journal of Medical Systems, 25(2), 133–144.
http://doi.org/10.1023/A:1005624715089.
Yang, L., Dang, Z., & Fischer, T. R. (2011). Information gain of black-box testing. Formal