ISSN 1450-2887 Issue 37 (2010) © EuroJournals Publishing, Inc. 2010 http://www.eurojournals.com/finance.htm
Testing the Feasibility of ASEAN+3 Single Currency
Comparing Optimum Currency Area and
Clustering Approach
Noer Azam Achsani
Department of Economics and Graduate School of Management and Business Bogor Agricultural University, Indonesia
E-mail: [email protected] (preferred) or [email protected] Tel: +62-251-8313813; Fax: +62-251-8318515
Titis Partisiwi
Department of Economics, Bogor Agricultural University, Indonesia E-mail: [email protected]
Tel: +62-251-8626602; Fax: +62-251-8626602
Abstract
This paper analyzes the possibility of currency integration among ASEAN+3 countries, which consists of Indonesia, Malaysia, Singapore, Philippines, Thailand, China, Japan, and South Korea. Two different methods are employed, i.e. the exchange rate variability based on OCA index and hierarchical clustering analysis.
The result showed that Singapore Dollar was the most stable currency in the region during the period of analysis. Furthermore, both methods confirm that the ASEAN+3 single currency –if it will be established-- should start with Malaysia and Singapore, followed then by Japan, Thailand, South Korea and China. On the other hand, Indonesia seems to be lag behind and therefore this country should work harder to join the single currency.
Keywords: ASEAN+3, economic integration, optimum currency area, single currency.
JEL Classification Codes: E32, F02, F15, F31
1. Introduction
The success story of the EU to establish a single market with single Euro currency has triggered ASEAN+3 countries to further integrate their economy and to discuss about the possibility of ASEAN+3 single currency. The currency integration is expected to optimize the cooperation itself, since it will boost transparent transactions. By nature, however, monetary integration is not an easy. The differences on the economic structure and current stage of trade as well as financial liberalization among the countries are two of the constraints. These eventually will result in a high disparity on advancement of economic achievement and implementation of financial system among the countries of ASEAN+3. Moreover, the variability of exchange rate system among the countries is another chalenging factor of the unification process.
geogrphic region which has symmetric shocks on supply and demand and satisfies the following criteria: (i) has a high degree of internal factor mobility and a low degree of external factor mobility, (ii) has a stabil wage and price, and (iii) has a simple labor mobility in the sense of national limitations, such as culture, language, regulation, and welfare.
Moreover, Tinbergen (1963) says that economic integration is a kind of international economic relation which removing all barriers toward free trade implementation by introducing all kinds of cooperation and unification. Krugman and Obstfeld (2007) define OCA as a group of countries in a certain region with an intensive economic cooperation in which trading of goods and services as well as production factors mobility are free. Integarion, therefore, can be seen as a tool for accessing the wider market and stimuling the economic growth to improve national welfare.
Keeping this development in mind, it is interesting to assess whether the ASEAN+3 economies may be seen as an optimum currency area suitable for establishing a single currency. The paper will explore the possibility of currency integration in ASEAN+3 regions by employing the so-called exchange rate variability approach (Bayoumi and Eichengreen, 1998). In this sense, we will adopt the methods introducing by Eichengreen (1998), Horvath (2003), and Falianty (2006). The variability and volatility of exchange rate will be calculated using business cycles synchronization, dissimilarity of export structure, trade intensity, economic’s size, openness of trade, financial development, and inflation differential.
As a comparison, we will also employ the hierarchical cluster analysis to explore the similarity of exchange rate characteristics among the countries.
2. Data and Methodology
In this research we use secondary data of nine countries, i.e., Indonesia, Malaysia, Singapore, Philippines, Thailand, China, Japan, South Korea, and the United State of America, which consist of monthly timeseries data from 1993:1 till 2007:9 (177 observations). All the data compiled from the International Financial Statistics (IFS) and the CEIC Database. The data analysis is carried out using computer softwares Eviews, and Minitab and Microsoft Excel.
OCA Approach
The variability exchange rate analysis is performed by calculating the OCA index estimated by the ordinary least square (OLS) method. The exchange rate variability of all countries is estimated by pegging to US Dollar. The smaller the OCA index, the more stable the currency. A country with smallest index indicates that their currency is the most stable among others.
The model of exchange rate variability was originally developed by Vaubel (1977). He used the model to evaluate OCA on nine countries of European Community. The exchange rate variability is then measured by the deviation standard of the exchange fluctuation between two countries (Bayoumi and Eichengreen, 1997). Furthermore, OCA index has provided an indication on benefit and cost of currency union development. A smaller OCA index indicates a more benefit than its cost, and vice versa, since countries with high symmetric shock and trade linkage tend to have stable exchange rate volatility and ease to perform a single currency.
Hovart (2003) then improves the Bayoumi and Eichengreen model by introducing the following formula:
0 1 2 3 4
5 6 7 ,
ij ij ij ij ij
ij ij ij
L BCS FIN DISSIM INFL
TRADE SIZE OPENESS
α α α α α
α α α ε
= + + + + +
+ + +
The calculation of the variables are as follows. OCA index is calculated by drawing the deviation standard of the nominal exchange rate movements from time t to t + 1, i.e.,
( log ).
ij ij
L =SD Δ e
The business cycles synchronization is determined by
( ), time t. To find the value of dissimilarity of export commodity structure, we exploit the following formula:
where Ait is the share of agricultural trading following the Standard International Trade Classification (SITC) of country i at time t, Bit is that of mining trading, and Cit is that of manufacture trading. The inflation differential is obtained by using the following formula:
(
)
adopt the following approach:1 import of country i at time t. The variable of economic size is determined as follows:
(
)
The last variable --the openess of trade-- is computed by the following formula:
1
In order to confirm and to examine the robustness of the results, we also employ the cluster analysis. Cluster analysis is basically a multivariate tool to provide a description or a reduction in the dimension of the data. It clasifies a set of objects or observations into two or more mutually exclusive groups or clusters based on combinations of some variables. It aims to construct groups or clusters in such a way that the profiles of objects in the same clusters are relatively homogenous, whereas the profiles of objects in different clusters are relatively heterogenous.
In this sense, the classification procedure is carried aout based on the similarities or distances among the objects. Consider two points and , the generalized distance can be described as follows:
where we use in this research m = 2 and it is called Euclidean distance. For a distance between two p
-dementional objects and we define the Euclidean distance as
In general, cluster analysis could be devided into hierarchical clustering and non-hierarchical clustering. Here we employ the hierarchical clustering technique in order to perform a step-by-step clustering where the process consists of a series of mergers of the objects.
In this sense, hierarchical clustering analysis is used to measure the similarities between the exchange rate characteristics of the ASEAN+3 countries in order to assess the possibility as well as step-by-step of currency unification in the region.
3. Empirical Results and Discussion
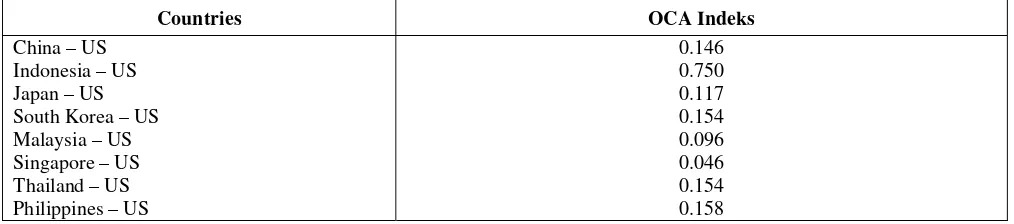
Table 1 presents the OCA index of each country. Here we consider US as the pegging country and therefore all the exchange rates are against US Dollar. The results show that the Singaporean Dollar is the most stable currency with the lowest OCA index followed by Malaysian Ringgit, Japanese Yen, Chinese RMB, Thailands Bath, Korean Won, Philippines Peso and Indonesian Rupiah.
Table 1: OCA indices of ASEAN+3 currencies (against US Dollar).
Countries OCA Indeks
China – US 0.146
Indonesia – US 0.750
Japan – US 0.117
South Korea – US 0.154
Malaysia – US 0.096
Singapore – US 0.046
Thailand – US 0.154
Philippines – US 0.158
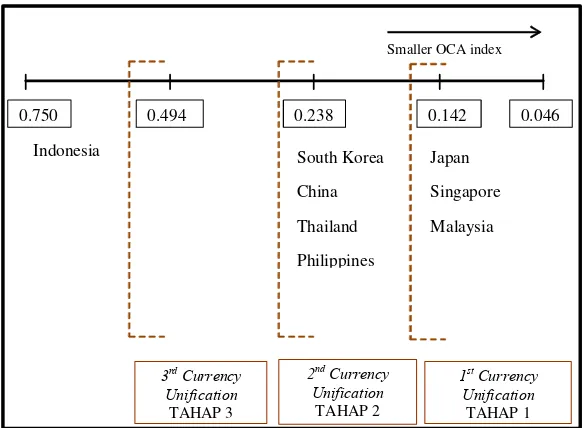
Figure 1: Currency integration process among ASEAN+3 countries.
0.750 0.494 0.238 0.142 0.046
Smaller OCA index
Indonesia Japan
Singapore Malaysia South Korea
China Thailand Philippines
1st Currency
Unification TAHAP 1 2nd Currency
Unification TAHAP 2 3rd Currency
Unification TAHAP 3
The results of the OCA approach is relatively consistent with those of the hierarchical clustering. Using US Dollar as the bechmark, cluster analysis shows that countries with high similarity are Malaysia – Singapore, Philippines – South Korea, and China – Japan. Meanwhile, Thailand and Indonesia have totally different characteristics (see Figure 2). Therefore, considering this results, the integration process can be undertake by respectively unifying Malaysian Ringgit and Singaporean Dollar (step 1), followed by Philippines Peso and Korean Won (step 2), and then Chinese RMB and Japanese Yen (step 3) and the Thailand Baht (step 4). Again, the results show that the Indonesian Rupiah seems to be inappropriate in joining the single currency due to its high dissimilarity with other currencies in the region.
Figure 2: The dendogram of currency integration process among ASEAN+3 countries.
Note:
1 = China, 2 = The Philippines, 3 = Indonesia,, 4 = Japan
4. Concluding Remarks
The objective of this research is to analize the possibility of currency integration in ASEAN+3 regions. It has shown not all of the countries ready to join the currency union, especially Indonesia. Both methods --OCA and clustering approaches— suggested that the integration process should be started by unifying Singaporean Dollar and Malaysian Ringgit followed then by Japanese Yen, Chinese RMB, Korean Won, Philippines Peso and Thailand Bath. Both approaches also showed that Indonesian Rupiah seems to be different with other currencies in the region. By these results, we statistically conclude that Indonesia may be the only country which not ready yet for ASEAN+3 currency integration.
The results also showed that the Singaporean Dollar was the most stable currency in the region. It is therefore interesting to re-examine the process using this currency as the benchmark (instead of the US Dollar).
References
[1] Achsani, N.A. and H. Siregar, 2007, Financial and Economic Integration: Experience of the EU and Future Prospect of ASEAN+3, In Dong, L and G. Heiduk (Eds), The EU’s Experience in Integration: A Model for ASEAN+3?, Peter Lang, Bern - Switzerland.
[2] Achsani, N.A. and H. Siregar, 2005, Toward East Asian Economic Integration: Classification of ASEAN+3 Economies using Fuzzy Clustering Approach, Paper was presented at the International Conference “EU-ASEAN Facing Economic Globalization” at the Center for European Studies, Chulalongkorn University, Thailand. July 20-22,2005.
[3] Artis, M dan W. Zhang, 1998, Membership of EMU: A Fuzzy Clustering Analysis of Alternative Criteria,European University Institute Working Papers RSC No 98/52.
[4] Bayoumi, T and B. Eichengreen, 1997, Even Closer to Heaven? An Opimum-Currency-Arean Index for European Countries, European Economic Review 41, 1997.
[5] Falianty, T.A., 2006, Optimum Currency Area: Case Study of ASEAN-5 Countries [Dissertation], Faculty of Economics, the University of Indonesia.
[6] Horvart, R., 2003, Exchange Rate Variability, Pressures and Optimum Currency Area Criteria: Implications for the Central and Eastern European Countries, Working Paper UK FSV-IES No 78, Charles University, Pergue.
[7] Kim, D., 2007, An East Asian Currency Union? The Empirical nature of Macroeconomic Shocks in East Asia, Department of Economics, the University of Sydney.
[8] Mundell, R., 1961, A Theory of Optimum CurrencyAreas. AmericanEconomic Review, 51, pp. 657-665