DOI: 10.12928/TELKOMNIKA.v14i3.3589 948
Application of Nonlinear Dynamical Methods for Arc
Welding Quality Monitoring
Shuguang Wu*, Yiqing Zhou
Department of Electronics and Information Technology, Jiangmen Polytechnic, Jiangmen 529090, Guangdong, China
*Corresponding author, e-mail: [email protected]
Abstract
Owing to its diverse, the stability of arc signals in high-powered submerged arc welding is not very salient, and weld defects are difficult to detect automatically. Aimed at this problem, this paper proposes a noise robustness algorithm for calibrating the singularity points and denoting the kinetics and stability of arc. Firstly, reconstruct a vector, which is the calculation of the approximate entropy in phase space, denotes the distortion of arc. Then, a algorithm for calculation is given based on reconstruction of chaotic time series in phase space. Finally, we apply the calculation of approximate entropy algorithm in phase space to flaw detection for arc signals, which is efficient proved by experimental results.
Keywords: weld defects, singularity points, phase space, approximate entropy
Copyright © 2016 Universitas Ahmad Dahlan. All rights reserved.
1. Introduction
With the development and application of automation technology and computer technology, the digitization and intelligent of welding has become a focus of the development of welding technology nowadays.Welding process is a complex physical and chemical process with various interference, and the stability of welding quality control is a more complex and difficult nonlinear problem [1-3]. Electrical signals,such as welding current and welding voltage,contains abundant information of welding process.If we can extract the feature information accurately,and then using the scientific method to undertake statistical analysis and calculation,will surely can be better sight into the characteristics of the mechanism of welding process [4, 5]. Many scholars have studied in this respect: to reduce the subjectivity of double wire pulsed welding welding process stability evaluation. Considering weld strength as the quality characteristic in the selection of process parameters, fume formation in a pulsed gas metal arc welding (GMAW) process is investigated by coupling a time-dependent axi-symmetric two-dimensional model, which takes into account both droplet detachment and production of metal vapour, with a model for fume formation and transport based on the method of moments for the solution of the aerosol general dynamic equation [6]. Three geometry changes to the inner bore of a welding nozzle and their effects on weld quality during gas metal arc welding (GMAW) were investigated through the use of computational fluid dynamic (CFD) models and experimental trials [7]. An adaptive technique based on estimation of signal parameters via rotational invariance technique (ESPRIT) is proposed that optimizes the accuracy and computation time for harmonic/interharmonic estimation of stationary as well as nonstationary power supply signals [8]. The use of fuzzy rule based systems to model the relationship between weld control parameters and the weld bead geometry features is explored in this paper. The system is tested on three datasets and the performance is found to be satisfactory compared to the multilayer perceptron (MLP) and radial basis function (RBF) neural networks based systems [9]. Simpson S W elucidates the signature image approach to welding fault detection, covering the calculation of signature image data objects from blocks of welding electrical data (voltage and current), the definition of appropriate vector operations, and the manipulation of the signatures to permit detection of welding faults [10].
parameters in chronological associated factors, such as the thermal inertia of arc space. Therefore, in time series,da ta gather of every moment reflects as dependence relationship. In
the early 1960, in order to overcome the difficulty to solve the entropy in the chaos phenomenon, Pincus proposed a concept of approximate entropy, which is a non-negative quantitative description of the complexity of the nonlinear time series. If the physical process of a nonlinear complex degree is higher, the approximate entropy will be bigger [11-13]. This method is of the advantages of short demanded data and the advantages of strong anti-interference capability. In practice, it often be used to a diagnostic criterion,and already have tried and is a huge success in the fields of atmospheric research [14], mechanical equipment fault diagnosis [15], telecommunications [16, 17], power transmission [18].
Although ApEn method can identify dynamic structure mutation of time series, it will not be able to give jump time and the detected mutation interval that heavily rely on the choice of the subsequence. Therefore,the author built calculation of approximate entropy algorithm to solve the dynamic arc time series of approximate entropy value. The present paper is mainly devoted to theproblem of exploring arc and process stability in high-powered submerged by virtue of the chaotic parameter, ApEn. In particular, the goal of the paper is to attempt to propose a new numerical standard to accurately quantify and evaluate the arc stability in high-powered submerged arc welding.
2. Research Method
2.1. The Definition of Burst Detection ApEn Algorithm
Step 1. Mirror the data f n
( )
and expand to L, that build-up the new sequence g n( )
;( )= (− +2 )+ ( ), =1, 2,...,
g n f n L f n n L (1)
Step 2. Reconstruct T n
( )
as aL-dimensional of phase space;(
)
{
}
( )= +1 , ( +2),..., ( + ) , =1, 2,...
T n g i g i g i L i L (2)
Step 3. Calculate the ApEn value of d T n n( ), =1, 2,...L by fast approximate entropy calculation;
Step 4. Reconstruct Y n n( ), =1, 2,...L as aL-dimensional of phase space;
Step 5. Sequence the Y n
( )
, if the record breakdown threshold point, record the breakdown point coordinates x0, at (x0, x0 + L) within the scope of retrieving the maximum entropy point of singularity.2.2. The Definition of Fast ApEn
In order to define ApEn(r,m,N) for an N-dimensional time series
{
ε ε
1, 2,...,ε
N}
, giventhe parameters m,r, the m-dimensional embedded vector x i
( ) {
=ε ε
1, 2,...,ε
i m+ −1}
, have been to be considered. Then, the ApEn is defined as [10]:( )
1( )
( , , ) limφ φ +
→∞
= m − m
N
ApEn m r N r r (3)
Where:
( )
1( )
1
1
ln 1
φ − +
=
= − +
∑
N m
m m
i j
r C r
N m (4)
( )
1(
(
)
)
1
1
,
1 θ ε ε
− +
=
= −
− +
∑
N m
m m m
i i j
j
C r d r
( )
1 00
θ = >
if x
x
otherwise (6)
And,
(
) (
)
maxε ε , 0 1
= + − + ≤ ≤ −
ij
d i k j k k m (7)
( )
( )( )2
1 1 1... 2
− −
=
∑
∩ = −i ij i j
C r d d j N (8)
( )
( )( ) ( )( ) 31 1 2 2 1... 2
− − − −
=
∑
∩ ∩ = −i ij i j i j
C r d d d j N (9)
Obviously, the value of the estimate depends on mand r. As suggested by Pincus, m can be taken as 2 and ras (0.1–0.25) SD, where SD is the standard deviation from the original data sequence. As a rule, in engineering practice, more than 100 data are needed to meet the requirements for estimating a robust value of ApEn. Consequently, in this paper the ApEn is calculated under the following conditions:
100, 0.15 , 2.
≥ = =
N r SD m
2.3. The Calculation of Approximate Entroy Algorithm Properties
Definition 1: The ApEn values have just as much periodic to original signal. Proof: If we now define f x
( )
as a periodic function with a periodT,(
+)
=( )
f x T f x (10)
Then,
(
)
( )
( + )= ( )
ApEn f x T ApEn f x (11)
The vector ApEn f x T(
(
+)
) show the periodic intensity modulation in the chaos domain. Also, the maximum and minimum of ApEn values are shown in a sameperiodic property.(
)
(
( + ))
=(
(( )
))
Max ApEn f x T Max ApEn f x (12)
(
)
(
( + ))
=(
(( )
))
Min ApEn f x T Min ApEn f x (13)
Definition 2: The new system consists of a stable system is not necessarily stable. System A and System B are stable system. When the system A is converted into system B, system A will not always in a stable state.
Proof: If,
( )
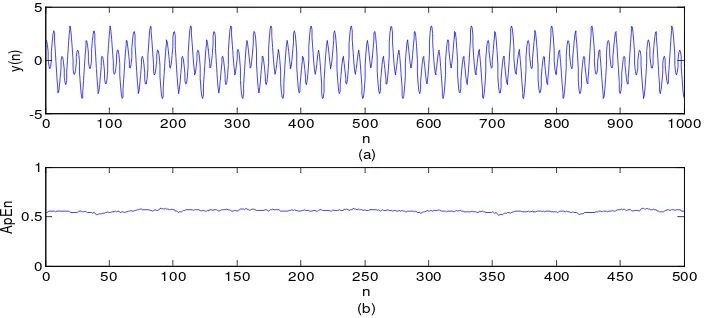
=2 sin(0.2 ) 1 1+ ≤ ≤500y n n n (14)
( )
=1.5sin(0.2 )+2 cos(0.5 )−0.2, 1≤ ≤500z n n n n (15)
( )
( )
( )
1 500500 1000
≤ ≤
= < ≤
z n n
f n
y n n (16)
( ( ))
=
( ( ))
=
B
S ApEn z n (18)
( ( ))
=
f
S ApEn f n (19)
As seeing from Figure 1b and Figure 2(b):
<
A B
S S (20)
Then,
( ( ))< ( ( )), ∈[400, 500]
ApEn f n ApEn z n n (21)
The new system f n
( )
is not always in a stable state,see in Figure 3.Figure 1. (a)The Time Series of Equation14; (b) the ApEn of (a)
Figure 2. (a)The Time Series of Equation15; (b) the ApEn of (a)
Definition 3: Any signal can be reconstructed by sinusoidal function. Proof: If we now define fT
( )
t as a periodic function with a period T,( )
( )
lim
→∞ T =
T f t f t (22)
0 50 100 150 200 250 300 350 400 450 500 -2
0 2 4
y(n
)
n (a)
n
0 50 100 150 200 250 300 350 400 450 500 0.17
0.175 0.18 0.185
Ap
En
(b)
0 100 200 300 400 500 600 700 800 900 1000 -5
0 5
y(n
)
n
(b) (a)
0 50 100 150 200 250 300 350 400 450 500 0
0.5 1
Ap
En
The single sinusoid g t
( )
is defined as:( )
= sin(2πϖ ϕ
+ )g t A t (23)
The parameters in Equation 23 are the amplitudeA,the frequency
ω
and phase φ. Itwas Fourier’s hot idea to consider a sum of sinusoids as a model for f t
( )
distribution.( )
0 1sin( ϖ ϕ )
∞
=
= +
∑
+ nn
f t A A n t (24)
Any signal can be reconstructed by sinusoidal function.
Figure 3. (a) The Time Series of Equation16; (b) the ApEn of (a)
Definition 4: A breakdown of the system point mutation into the system B,the burst point flag ApEn value is defined as:
0.2
ψ = (25)
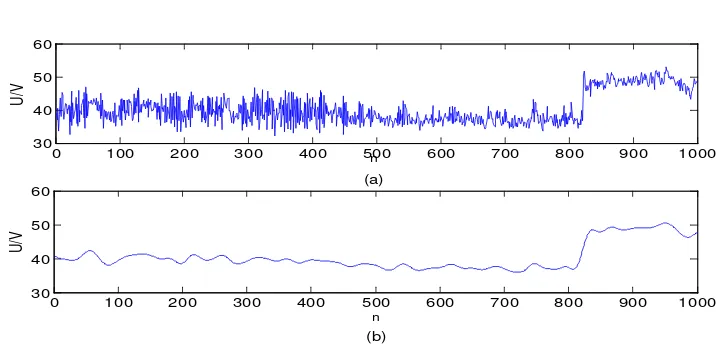
Figure 4. Extract Waveform of arc Withwavelets Algorithm. (a) Original Arc; (b) the Denoise with Wavelets Algorithm of (a)
0 100 200 300 400 500 600 700 800 900 1000 -5
0 5
y(n
)
0 100 200 300 400 500 600 700 800 900 1000 0
0.5 1
Ap
En
n (b) (a) n
0 100 200 300 400 500 600 700 800 900 1000 30
40 50 60
U
/V
(a)
n
(b)
0 100 200 300 400 500 600 700 800 900 1000 30
40 50 60
U
/V
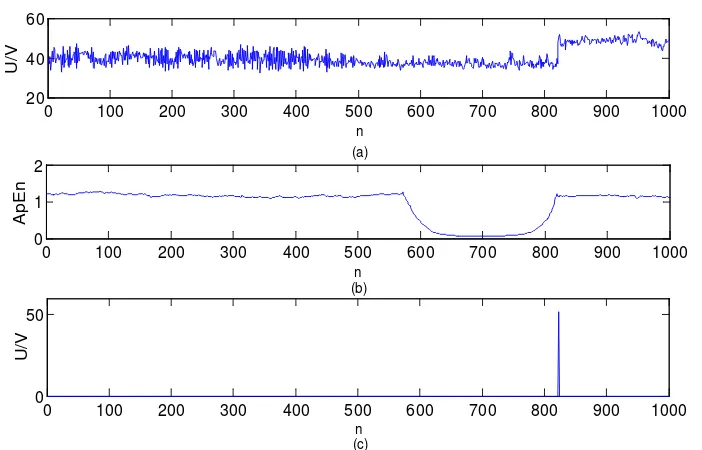
Figure 5. Get the Burst Point. (a Original Arc;(b)the ApEn of (a); (c)the burst point of (a)
3. Results and Analysis
3.1. Comparative Analysis of Algorithms
Wavelet algorithm,MC-ApEn algorithm (moving cut data approximate entropy), BD-ApEn (Burst detection data approximate entropy)algorithm are high-power welding arc signal Figure 4a, Figure 5a analysis.
Wavelet analysis method to eliminate signal noise, accurate waveform feature extraction as illustrated in Figure 4b.
A vector that denotes the magnitude and direction of weld arc, is reconstructed MC-ApEn algorithm,as illustrated in Figure 5b.
BD-ApEn algorithm not only reconstructe A vector that denotes the magnitude and direction of weld arc,but also extract burest point,as illustrated in Figure 5c.
3.2. The influence of the phase space size for the classification
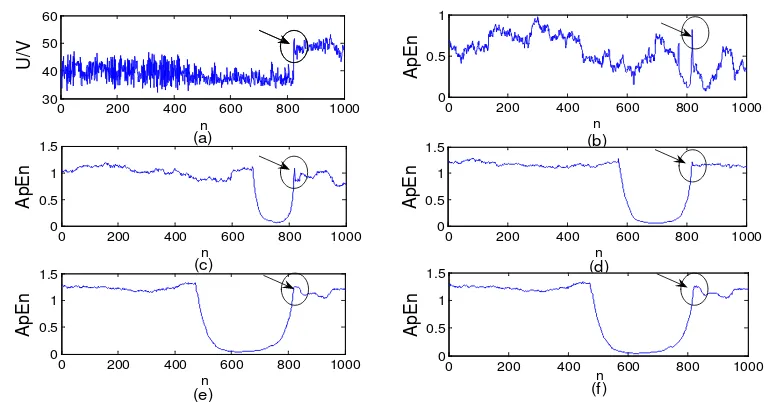
Here,we select a fault arc data, shown in Figure 6a, and then fixe the different sizes of phase space D, respectively D=50, D=150, D=250, D=350, D=450, calculate its approximate entropy in phase space.
Fixed D=50, approximate entropy drill-down to zero,and the approximate entropy gap dislocation, see in Figure 6b. The size of phase space is increased sufficiently to 150 and there is a clear approximate entropy concave gap, see in Figure 6c. Then, the scanning range is increased sufficiently to 250, and the gap dislocation would come even soonerin Figure 6c. Finally, the size of phase space is increased again to D=350, the form of approximate entropy become further smother, see in Figure 6(e).
0 100 200 300 400 500 600 700 800 900 1000 20
40 60
U
/V
n
(c) (b) (a)
0 100 200 300 400 500 600 700 800 900 1000 0
1 2
Ap
En
n
0 100 200 300 400 500 600 700 800 900 1000 0
50
U
/V
Figure 6. (a) original arc; (b) the ApEn of (a) where D=50;(c)the ApEn of (a) where D=150; (d) the ApEn of (a) where D=250; (e) the ApEn of (a) where D=350; (e) the ApEn of (a) where
D=400
Figure 7. (a) original arc; (b)the burst point of (a) where D=150; (c) the burst point of (a) where D=250; (d) the burst point of (a) where D=350
Experimental results show algorithm is robust to calibrate the singularity points and denote the kinetics and stability of arc, see Figure 7.The resolution and separation efficiency were improved greatly by regulating the sizes of phase space. The larger of phase space , The hole of arc is more obvious and vice versa. In practice, the effect of phase space will be considered.
4. Conclusion
In essence, the method of digital filtering is used first, and then restored to its original feature. However, it is unable to denotes the non-linear dynamical features. The calculation of the approximate entropy in phase space,which is different from wavelet signal detection method,will not only calibrate the singularity points but also denote the kinetics and stability of arc. A vector, which is with the calculation of the approximate entropy in phase space,denotes the distortion of arc. The calculation of the approximate entropy in phase space, which is a complexity measure suitable for short data, evolve as a problem-state monitoring system.
0 200 400 600 800 1000 30 40 50 60 n (f) (e)
(c) (d)
(b) (a)
0 200 400 600 800 1000 0 0.5 1 Ap En n
0 200 400 600 800 1000 0 0.5 1 1.5 Ap En n U /V
0 200 400 600 800 1000 0 0.5 1 1.5 Ap En n
0 200 400 600 800 1000 0 0.5 1 1.5 Ap En n
0 200 400 600 800 1000 0 0.5 1 1.5 Ap En n
0 200 400 600 800 1000 30 40 50 60 U /V n (d) (a) (c) n
0 200 400 600 800 1000 0 20 40 60 U /V (b)
0 200 400 600 800 1000 0 20 40 60 U /V n
Acknowledgements
This work was supported by pdjh2016b0752,2014ZJ002.
References
[1] Zhang Weichao, Yang Lijun, Lü Xiaoqing. Approximate entropy based meso-spray transfer analysis of Al-alloy pulsed metal inert-gas welding under self-adapting control. Acta Phys. Sin. 2011; 60(2): 020601.
[2] Nilsiam Y, Haselhuhn A, Wijnen B, et al. Integrated Voltage-Current Monitoring and Control of Gas Metal Arc Weld Magnetic Ball-Jointed Open Source 3-D Printer. Machines. 2015; 3(4): 339-351. [3] Yao P, Xue JX, Zhu Qiang. Quantitative evaluation of double wire pulsed welding stability based on
probability density distribution. Transactions of the China Welding Institution. 2014; 35(7): 51-54. [4] Zade F, Talenta A. Editors. Advanced Fuzzy Control System. Yogyakarta: UAD Press. 2010.
[5] Wu SG, Chen JX. Design of Distributed Pulse Data Acquisition System. Advanced Materials Research. 2013: 756-759.
[6] Boselli M, Colombo V, Ghedini E, et al. Two-dimensional time-dependent modelling of fume formation in a pulsed gas metal arc welding process. Journal of Physics D: Applied Physics. 2013; 46(22): 224006.
[7] Campbell SW, Galloway AM. Ramsey GM, et al. A computational fluid dynamic analysis of the effect of weld nozzle geometry changes on shielding gas coverage during gas metal arc welding. Journal of Manufacturing Science and Engineering. 2013; 135(5): 051016.
[8] Jain SK, Singh SN, Singh JG. An adaptive time-efficient technique for harmonic estimation of nonstationary signals. Industrial Electronics. IEEE Transactions on. 2013; 60(8): 3295-3303.
[9] Ghanty P, Paul SM, Roy AB, et al. Fuzzy rule based approach for predicting weld bead geometry in gas tungsten arc welding. Science and Technology of Welding and Joining. 2008; 13(2): 167-175. [10] Simpson SW. Signature images for arc welding fault detection. Science and Technology of Welding
and Joining. 2007; 12(6): 481-486
[11] Pincus SM. Approximate entropy as a measure of system complexity. Proceedings of the National Academy of Sciences of the United States of America. 1991; 88(6): 2297-2301.
[12] Pincus SM. Assessing Serial Irregularity and Its Implications for Health. Annals of the New York Academy of Sciences. 2001; 954(1): 245–267.
[13] Pincus SM, Goldberger AL. Physiological time-series analysis: What does regularity quantify?. American Journal of Physiology. 1994; 1643-56.
[14] Wang Liu, He Wen-Ping, Wan Shiquan. Evolutionary modeling for parameter estimation for chaotic system. Acta Phys. Sin. 2014; 63(1): 019203.
[15] Koyuncu I, Ozcerit AT, Pehlivan I. Implementation of FPGA-based real time novel chaotic oscillator. Nonlinear Dynamics. 2014; 77(1-2): 49-59.
[16] Li L, Keqi L, Gen H. Recognition of Fission Signals Based on Wavelet Analysis and Neural Network. TELKOMNIKA Telecommunication Computing Electronics and Control. 2016; 14(3).
[17] Yun H, Liu R, Shangguan L. Transformer Fault Diagnosis Method Based on Dynamic Weighted Combination Mode. TELKOMNIKA Telecommunication Computing Electronics and Control. 2016; 14(3). DOI: http://dx.doi.org/10.12928/telkomnika.v14i3.3545.