“I hereby declare that I have read through this report entitle “Multi-Contingency Cascading Analysis Of Smart Grid Based On Self Organizing Map (SOM)” and found that it has been comply the partial fulfilment for awarding the degree of Bachelor of Electrical Engineering (Industrial Power).
Signature : ……….
Supervisor‟s Name : EN. ZUL HASRIZAL BIN BOHARI
MULTI-CONTINGENCY CASCADING ANALYSIS OF SMART GRID BASED ON SELF ORGANIZING MAP (SOM)
MUHAMMAD ASYRAF BIN MAT YUSOF
A report submitted in partial fulfilment of the requirements for the degree of Bachelor of Electrical Engineering (Industrial Power)
Faculty of Electrical Engineering
UNIVERSITI TEKNIKAL MALAYSIA MELAKA
I declare that this report entitle “Multi-Contingency Cascading Analysis Of Smart Grid Based On Self Organizing Map (SOM)” is the result of my own research except as cited in the references. The report has not been accepted for any degree and is not concurrently submitted in candidature of any other degree.
Signature : ……….
Name : MUHAMMAD ASYRAF BIN MAT YUSOF
ACKNOWLEDGEMENT
All praise to Allah, the Almighty, the Benevolent for His guidance and blessing for giving me a good health, strength, patient and inspiration for me in completing this final year project. With His blessing, this thesis is finally accomplished. First and foremost, I would like to express my genuine gratitude to my supervisor FYP 1 and FYP 2, Mr Zul Hasrizal Bin Bohari, who has been my source of inspiration and guiding me throughout the progress of this project. All of the generous support and encouragement given was the most importance and always been remembered.
Secondly, I would like to give my biggest gratitude to Universiti Teknikal Malaysia Melaka (UTeM) especially to the Faculty of Electrical Engineering in providing me the essential skills towards the electrical & engineering. I would also like to thank to FKE PSM Committee of UTeM in providing programs and preparation in order to complete the final year project and thesis.
ABSTRACT
ABSTRAK
TABLE OF CONTENTS
CHAPTER TITLE PAGE
ACKNOWLEDGEMENT i
ABSTRACT ii
ABSTRAK iii
TABLE OF CONTENTS iv
LIST OF TABLES vii
LIST OF FIGURES viii
LIST OF ABBREVIATIONS ix
LIST OF APPENDICES x
1 INTRODUCTION
1.1 Research Background 1
1.2 Motivation 3
1.3 Problem Statement 4
1.4 Objective 4
1.5 Scope of Work 5
2 LITERATURE REVIEW
2.1 Theory and Basic Principles 6
2.1.1 Load contingency analysis 6
2.1.2 Smart Grid Network 8
2.1.4 SOM Algorithm 14
2.1.5 SOM Visualization 15
2.2 Review of Previous Relates Works 16
2.2.1 Clustering of self organizing map (SOM) 16 2.2.2 Topological analysis of cascading failures 16 2.2.3 Self organizing formation of topologically correct
feature maps 17
2.3 Summary and Discussion of the review 17
3 RESEARCH METHODOLOGY
3.1 Principles of the methods or techniques used in the
previous works 19
3.2 Selected Methodology 19
3.3 Description of work to be undertaken 20
3.4 Project Gantt Chart and Key Milestones 20
3.4.1 Gantt Chart 22
3.4.2 Key Milestones 23
3.5 Data Organization 23
4 RESULT AND ANALYSIS
4.0 Introduction 26
4.1 SOM Classification Performances 26
4.1.1 IEEE 14 Bus System 26
4.1.2 IEEE 57 Bus System 32
4.2 U Matrix (Unified Distance Matrix) 36
4.2.2 Results for IEEE 57 Bus System 42 5 CONCLUSION
5.1 Conclusion 47
5.2 Recommendation 48
5.3 Achievement 48
REFERENCES 49
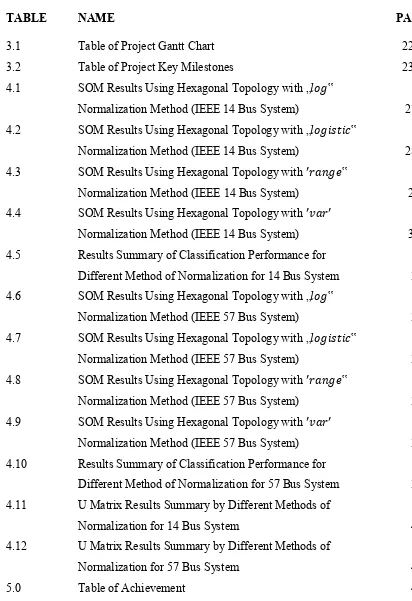
LIST OF TABLES
TABLE NAME PAGE
3.1 Table of Project Gantt Chart 22
3.2 Table of Project Key Milestones 23
4.1 SOM Results Using Hexagonal Topology with „ ‟
Normalization Method (IEEE 14 Bus System) 27 4.2 SOM Results Using Hexagonal Topology with „ ‟
Normalization Method (IEEE 14 Bus System) 28 4.3 SOM Results Using Hexagonal Topology with ‟
Normalization Method (IEEE 14 Bus System) 29 4.4 SOM Results Using Hexagonal Topology with
Normalization Method (IEEE 14 Bus System) 30 4.5 Results Summary of Classification Performance for
Different Method of Normalization for 14 Bus System 31 4.6 SOM Results Using Hexagonal Topology with „ ‟
Normalization Method (IEEE 57 Bus System) 32 4.7 SOM Results Using Hexagonal Topology with „ ‟
Normalization Method (IEEE 57 Bus System) 33 4.8 SOM Results Using Hexagonal Topology with ‟
Normalization Method (IEEE 57 Bus System) 34 4.9 SOM Results Using Hexagonal Topology with
Normalization Method (IEEE 57 Bus System) 35 4.10 Results Summary of Classification Performance for
Different Method of Normalization for 57 Bus System 36 4.11 U Matrix Results Summary by Different Methods of
Normalization for 14 Bus System 41 4.12 U Matrix Results Summary by Different Methods of
Normalization for 57 Bus System 46
[image:11.595.79.491.176.777.2]LIST OF FIGURES
FIGURE NAME PAGE
1.1 Schematically of the Kohonen model 3
2.1 The structure of a SOM 10
2.2 Colors are represented in 3D 10
2.3 2D array of weight vector 11
2.4 The map size and the number of iterations to perform 13
3.1 Flow Chart of Methodology 21
3.3 IEEE 14 Bus and 57 Bus System 24
3.4 Load Data IEEE 14 Bus System 25
3.5 Load Data IEEE 57 Bus System 25
4.1 U Matrix for normalization using 200 Neurons 37 4.2 U Matrix for normalization using 180, 200
and 220 Neurons 38
LIST OF ABBREVIATIONS
LIST OF APPENDICES
APPENDIX TITLE PAGE
A Coding for U-Matrix 52
B1 Load Data IEEE 14 Bus System 53
B2 Load Data IEEE 57 Bus System 54
C1 U Matrix for Method using 100, 120, 140,
160, 180, 220, 240, 260 and 280 Neurons 55 C2 U Matrix for Method using 300, 320, 340,
360, 380 and 400 Neurons 56
C3 U Matrix for Method using 100, 120, 140,
160, 240 and 260 Neurons 57
C4 U Matrix for Method using 280, 300, 320,
340, 360, 380 and 400 Neurons 58
C5 Matrix for Method using 100, 120, 140, 160,
180, 240, 260, 280 and 300 Neurons 59 C6 U Matrix for Method using 320, 340, 360,
380 and 400 Neurons 60
C7 U Matrix for Method using 100, 120, 140, 160,
180, 220, 240, 260, and 280 Neurons 61 C8 U Matrix for Method using 300, 320, 340,
360, 380 and 400 Neurons 62
D1 U Matrix for Method using 100, 120, 140,
D2 U Matrix for Method using 280, 300, 320,
360, 380 and 400 Neurons 64 D3 U Matrix for Method using 100, 120, 140,
160, 180, 200, 220, 240, and 260 Neurons 65 D4 U Matrix for Method using 280, 300,
320, 340, 360 and 380 Neurons 66
D5 U Matrix for Method using 100, 120, 140,
160, 180, 200, 220, 260 and 280 Neurons 67 D6 U Matrix for Method using 300, 320, 340, 360,
380 and 400 Neurons 68
D7 U Matrix for Method using 100, 120, 140, 160,
180, 200, 220, 240, and 260 Neurons 69
D8 U Matrix for Method using 260, 300, 320,
CHAPTER 1
INTRODUCTION
1.1 Research Background
Power system are worked with the goal that over-burdens don't happen either progressively or under any measurably likely contingency. This is regularly called keeping up framework " security". Test system is outfitted with devices for dissecting possibilities in a programmed manner. Contingency can comprise of a few activities or components that is straightforward case for blackout of a solitary transmission line and intricate for blackout of single of a few lines, various generators, and the conclusion of typically open transmission line. The Power grid security is one of the huge perspectives, where the correct move needs to be made by the operational specialists for the unseen contingency. In this way the contingency investigation is key for the power grid security. The contingency positioning utilizing the execution list is a strategy for the line blackouts in a power grid, which positions the most noteworthy execution record line first and returns in a plummeting way focused around the computed PI for all the line blackouts. This serves to make the former move to keep the grid secure. In the present work the Newton Raphson burden stream strategy is utilized for the power grid contingency positioning for the line blackout focused around the active power and voltage performance index [1]. The positioning is given by considering the general execution record, which is the summation of Active power and voltage performance index.
examples, called a map. "Self Organizing" is on the grounds that no supervision is needed. SOMs learn all alone through unsupervised aggressive learning. "Maps" is because they attempt to map their weights to conform to the given input data [2] . The nodes in SOM network attempt to become like the inputs presented to them. Holding guideline "Features Maps" of the info information is a crucial standard of SOMs, and one of the things that makes them so important. Particularly, the topological connections between data information are saved when mapped to a SOM system. "Training" forms the guide utilizing info samples (a focused procedure, likewise called vector quantization), while "mapping" naturally orders another data vector.
Smart grid is system made through the blend of data engineering, correspondence innovation and electrical power framework. Smart grid is conveys electrical power to the shoppers utilizing two way computerized engineering. Monitors is the supply to the customers and estimations. Numerous nations and power markets are taking a gander at Smart Grid as progressive arrangements in conveying blend of upgraded qualities going from higher security, dependability and power quality, lower expense of conveyance, interest streamlining and vitality productivity. Smart grid arrangements empower utilities to build vitality profit and power dependability while permitting the clients to deal with the use and expenses through on going data trade. It affects all the parts of the power grid like generation, transmission and distribution [3].
Figure 1.1 : Schematically of the Kohonen model [4].
1.2 Motivation
1.3 Problem Statement
Nowadays, there are many researchers study about design and concepts of self organizing maps in smart grid. The analysis also focus on the cascading failure analysis in multi-contingency scenarios has been a challenge due to its topological complexity and computational cost. The contingencies are chosen by computing a sort of seriousness indices known as Performance Indices (PI). These indices are ascertained utilizing the conventional power flow algorithms for individual possibilities in a logged off mode. In view of the qualities acquired the contingencies are positioned in a way where the most noteworthy estimation of PI is positioned first. The analysis is carried out beginning from the contingency that is positioned one and is proceeded till no severe contingencies are found. There are two sort of performance index which are of extraordinary utilize, these are active power performance index ( ) and reactive power performance index ( ). Hence, modern computers are furnished with possibility investigation programs which show the power system and are utilized to study blackout occasions and alarm the administrators of potential over-burdens and voltage infringement. The most troublesome methodological issue to adapt inside contingency investigation is the exactness of the strategy and the rate of arrangement of the model used.
1.4 Objectives
The objectives of this research are :
1) Define contingency cascading analysis for power system.
2) Utilize of ability Self Organizing Map (SOM) method using smaller and bigger data.
1.5 Scope of work
CHAPTER 2
LITERATURE REVIEW
2.1 Theory and Basic Principles 2.1.1 Load Contingency Analysis
Contingency analysis is the investigation of the blackout of components, for example, transmission lines, transformers and generators, and examination of the ensuing impacts on line force streams and transport voltages of the remaining framework. It speaks to a vital device to study the impact of components blackouts in power framework security amid operation and arranging. Contingency alluding to unsettling influences, for example, transmission component blackouts or generator blackouts may cause sudden and expansive changes in both the setup and the condition of the framework [5]. Contingencies may bring about extreme infringement of the working imperatives. Thusly, getting ready for contingencies structures an essential part of secure operation.
blackouts will result in force streams or voltages to go out of their breaking points. So as to anticipate the impacts of blackouts, contingency investigation system is utilized. Contingency investigation strategies demonstrate a solitary gear disappointment occasion, that is one line or one generator blackout, or various supplies disappointment occasions, that is two transmission lines, a transmission line and a generator, one after an alternate in arrangement until all dependable blackouts have been examined. For every blackout tried, the contingency examination system checks all force streams and voltage levels in the system against their individual breaking points [6].
successfully addressed by changing the exponent of the performance index from 2 to higher values. The post contingency line flows and bus voltages are obtained from the load flow solution after the application of the outage simulation. The exponent (m) of the performance index is changed in the range from 2 to 30 to avoid masking errors. Outages are then ranked on the basis of their corresponding performance indices. In this study the contingencies are ranked on the basis of line loading in equation 2.1 :
∑
(2.1)
Where:
:The post-contingency active power flow on line (i).
:The active power flow limit on line (i).
:The weight factor of active power flow on line (i).
:Number of transmission lines.
:Is a positive integer.
2.1.2 Smart Grid Network
2.1.3 Self Organizing Maps (SOM)
The Self-Organizing Map is a standout between the most mainstream neural system models. A sorting toward oneself out guide (SOM) is a sort of simulated neural system (ANN) that is prepared utilizing unsupervised figuring out how to create a low-dimensional (ordinarily two-low-dimensional), discretized representation of the information space of the preparation examples, called a map. "Self Organizing" is on the grounds that no supervision is needed. SOMs learn all alone through unsupervised aggressive learning. "Maps" is on the grounds that they endeavor to guide their weights to fit in with the given info information. The hubs in a SOM system endeavor to wind up like the inputs displayed to them. Holding guideline "Features Maps" of the info information is a crucial standard of SOMs, and one of the things that makes them so important. Particularly, the topological connections between data information are saved when mapped to a SOM system. "Training" forms the guide utilizing info samples (a focused procedure, likewise called vector quantization), while "mapping" naturally orders another data vector [10]. A self-organizing map consists of components called nodes or neurons. Associated with each node is a weight vector of the same dimension as the input data vectors and a position in the map space. The usual arrangement of nodes is a two-dimensional regular spacing in a hexagonal or rectangular grid. The self-organizing map describes a mapping from a higher-dimensional input space to a lower-dimensional map space.