DOI: 10.12928/TELKOMNIKA.v15i2.6109 733
In this paper, we introduced statistical techniques in creating a gas dispersion model in an indoor with a controlled environment. The temperature, air-wind and humidity were constant throughout the experiment. The collected data were then treated as an image; which the pixel size is similar to the total data available for x and y axis. To predict the neighborhood value, linear interpolation technique was implemented. The result of the experiment is significantly applicable in extending the total amount of data if small data is available.
Keywords: gas mapping, gas dispersion, linear interpolation, statistical
Copyright © 2017 Universitas Ahmad Dahlan. All rights reserved.
1. Introduction
Environmental monitoring is very crucial nowadays, especially when dealing with gas detection. It is extremely important in protecting the public, workers and the environment in general from toxic and hazardous gas and the environment. On site, in improving safety, gas detectors are used and the placement is performed by experts using computer modeling [1]. The mapping process determines the perfect location to place detectors for optimal response.
Maurizio, et al., defines a gas mapping approach into two main approaches. The first was a model-based approach which needs a complex numerical model [2]. This approach relied on generating simulation which was not suitable for practical situation. Ishida et. al for example, used simple analytical model, the Gaussian to develop the gas mapping [3]. This methodwas only suitable for constant and uniform wind speed environment.
The second approach was a model-free approach which highly relies on variable and parameters that available in the environment. This approach was powerful as it did not rely on any model as reference. Liliental et al. propose Kernal DM+V algorithm, a statistical approach to observing the gas distribution [4]. They treated the gas sensor measurement as random variables. Their model was represented as a pair grid map which was distribution mean and corresponding predictive variance per grid cell.
Hayes et.al [5] proposed an algorithm which tried to define the source of gas by searching for a transition between high and low intensities in the upwind direction. Their
algorithm consists of a wind direction that was performed for a set distance whenever an “odor packet” was encountered, and followed by a spiral searching behavior for other gas patches. At
the head of a plume, the spiral surge algorithm surged into the low concentration area, and then
spiral back to the origin of the surge before receiving another “odor hit”. The area of the gas
source was expected to be appearing as a series of small distances between the locations
where the robot senses consecutive “odor hits”.However, this approach highly relied on
sufficiently constant and strong airflow where the anemometer is required throughout the work. Typically, researchers used a Gaussian model in predicting gas dispersion either indoor or outdoor [6]. C. Stachniss et.al introduced a sparse Gaussian process mixture model in his work [7]. The estimation problem that they introduced was addressed as a regression problem which they implemented Gaussian processes (GP) in solving the regression problem.
This technique was highly usable in doing estimation with a small set of data. The Goodness of the technique is tested using some performance indicators such as means absolute error (MAE), normalized absolute error (NAE), root mean square error (RMSE), prediction accuracy (PA), coefficient of determination (R2) and index of agreement (d2). The efficiency of the estimation data was tested using distribution techniques which are Weibull, Gamma and Longnormal. It was observed that, the linear interpolation technique capable to give high efficiency result based on performance indicator.
Apart from that, P. Jamjuntr and N. Dejdumrong introduced linear interpolation to recognize a font in object character recognition application (OCR) in Thai Font Type Recognition [9]. This work involves two main parts which are image processing and character recognition. They applied linear interpolation to their sampling pixel to preserve the shape of the collected character and Euclidian algorithm to classify the character pattern. Using these techniques, they were able to classify the character with more than 80% similarity.
In industry the mapping is done manually by the engineers with complete personal protective equipment (PPE) to collect data manually at site or by using complex and expensive computer programs to do the data prediction, mapping and modeling. As data needs to be taken in real-time with no point left, a complete modeling and mapping solution needs to be figured on giving reliable and accurate mapping and modeling results. Hence, in this study, a simple gas distribution modeling technique is being introduced.
2. Research Method
Interpolation is a mathematical technique that can be used to fill blanks in the dataset. It calculates the unknown heights of interested points by referring to the elevation information of neighbouring points. There are more, a lot of techniques available in interpolation [10]. For this study, the linear Interpolation technique is used for data prediction.
2.1. Linear Interpolation
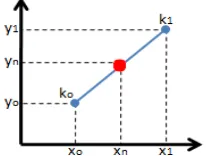
Linear Interpolation is the simplest method in getting values between two data points. It is a curve fitting technique; where two coordinates which is k0 (x0, y0) k1 and (x1, y1) are
assumed to fall in a one straight line as in Figure 1.
Figure 1. Point xn and yn are located between x0,y0 and x1,y1 in similar straight line
Therefore, both lines are having same slope, m and this applies to all lines that are falling between those two lines which m is mathematically defined as:
(1)
Based on Figure 1, difference between both points can be defined as:
(2)
Where xn and yn points are the unknown points which falls between k0 and k1.
(3)
To identify yn, at least five values are needed to identify the unknown value which is xn,
xo, x1, yo and y1. yn value is the unknown value and xn value is X-value for yn.
2.2. Experiment Setup
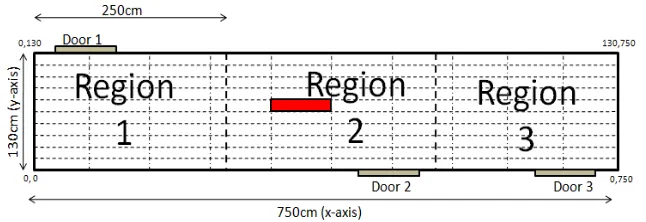
Experiments were conducted in a rectangular shape room with a size of 750cm x 130cm. Room floor plan is shown in Figure 2 below. To control the room temperature and eliminate any external constant airflow, the air-conditioner in the room was switched-off, besides all doors were sealed properly. The room was divided into a smaller-grid, which each grid size was 75cm x 13cm. This is because in real gas detection practice, measuring gas concentrations up to centimeters value in an area is less applicable as gas is detected if the area is filled with large volumes of the gas. In total, the room consists of 100 small grids. The centre for each gridwere marked which was used for data collection point throughout the experiment.
To collect the gas reading, MQ7 Gas Sensor was used. The sensor was connected to the analog pin on the controller. The sensor was mounted 1 meter from the floor on a pole which was located at the centre for the mobile robot. The correct sensor height location is very crucial as each has different specific gravity value. The Carbon Monoxide specific gravity value is 0.9667, which is estimated to be around 1 meter from the floor. For reference, the specific gravity of air is 1 and Oxygen (O2) is 1.1. MQ7 is an electrochemical sensor which capable to
read Carbon Monoxide gas (CO) up to 2000ppm.
To counter-check the gas reading, an OEM Carbon Monoxide Meter with 1000ppm gas detection range and Macurco Carbon Monoxide Gas Detector with 500ppm gas detection range were mounted on the pole with similar height. To ensure no external airflow was available during the experiment, an OEM Digital Anemometer was installed on top of the pole. The anemometer was capable to read up to 0.01 m/s air speeds, besides able to measure the air temperature. To collect data, Arduino controller was used as data acquisition module in this experiment. This simple controller was capable to monitor analog and digital input. The programming script for this module was easy that makes this controller, powerful and reliable to be used throughout the experiment. Analog reading from the sensor was monitored through Serial Communication using Putty software which is installed in Android mobile.
Carbon Monoxide gas source (CO) was located at one of the grid, which was defined
as “Source” in Figure 2. Figure 3 shows the actual point marking in the room. Getting a high
volume pure Carbon Monoxide gas concentration was challenging. However, this was realized by using smoke from cigarettes and coal as Carbon Monoxide can be produced by burning any carbon-based substance [10]. A burning cigarette and smoke were placed on a fireproof plate.
It took 5 minutes for the gas to fill throughout the room area. During this warm-up period, alarm buzzer from wall-mounted gas detector was monitored.
Figure 3. Actual point marking in the room
Figure 4(a). Developed portable stand frame for data collection
Figure 4(b). Isometric and Front View for developed portable stand frame
2.3. Data Acquisition
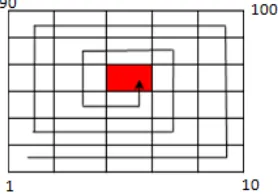
In this work, data was collected in circular approach, where data were recorded from the initial point in circular shape method. The approach method is sketched as in Figure 3. Data was collected from Grid 1 to Grid 10, and then it went up from Grid 20 to Grid 100 vertical, from Grid 99 to Grid 90 horizontally and finally from Grid 89 downward to Grid 11. The approach continued from Grid 12 to Grid 19 onwards. The process took up to 90 minutes per cycle. To ensure the result accuracy, 3 cycles were performed in this approach.
Figure 3. Circular Approach where the gas source is located at the centre of the room
3. Result and Analysis
Throughout the experiment, the room temperature is 30° Celsius with humidity at -23% RH and 0m/s wind speed. Data was collected at 100 points. Out of 100 points, 50 points were
assumed to be “unknown” value. Figure 4 and 5 show data that were collected and data
Figure 4. Gas Dispersion Model for Collected Data based on Circular Approach
Figure 5. Gas Dispersion Model for Calculated Data based on Circular Approach
The data collected are assumed to be a 10 x 10 image pixels. As all parameters are constant, all neighboring values are expected to be not much different. Linear Interpolation as explained in 2(a) is a simple method which passes in a straight line through two consecutive points of input signals [11, 12]. Therefore, Linear Interpolation technique is implemented in this work to test the efficiency of the predicted result. Out of 100 points, 50 points were assumed to
be “unknown” value. By using Linear Interpolation, those “unknown” value was calculated and
the results were compared with the actual collected data. As a result, percentage difference between calculated and collected data can be figured out and suitability in using Linear Interpolation techniques can be defined.
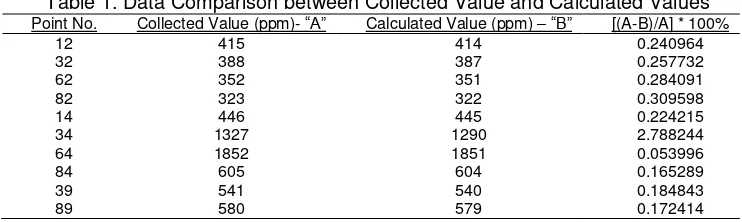
From data and model that is generated, it can be observed that the difference between calculated data and the collected data is very minimal. Some of the data is shown in Table 1. Comparing the collected data and the calculated result, it can be observed that, in average the difference between collected and calculated data is more than 93%.
Some readings are having only 2 decimal value differences which makes the total average result is more than 95%. In industry, the observed results are considered accurate. By considering 5% to 7% gas detector acceptance error by sensor manufacturer recommendation, 93% accuracy is highly acceptable.
Table 1. Data Comparison between Collected Value and Calculated Values Point No. Collected Value (ppm)- “A” Calculated Value (ppm) –“B” [(A-B)/A] * 100%
From this experiment, in predicting data, Linear Interpolation technique is suitable to be used in controlled and constant environment. It is also able to extend the total amount of data if only a small data set is available during data collection.
References
[1] Det-ronics. Mapping Fixed Gas Detectors and Flame Detectors. 2016.
[2] M Di Rocco, M Reggente, A Saffiotti. Gas Source Localization in Indoor Environments using Multiple Inexpensive Robots and Stigmergy. Intelligent Robots and Systems (IROS 2011). San Francisco, USA. 2011.
[3] H Ishida, T Nakamoto, T Moriizumi. Remote sensing of gas/odor source location and concentration distribution using mobile system. Sensors and Actuators B. 1997; 49: 52-57.
[4] AJ Lilienthal, M Reggente, M Trincavelli, JL Blanco, J Gonzalez. A Statistical Approach to Gas Distribution Modelling with Mobile Robots – The Kernel DM+V Algorithm. International Conference on Intelligent Robots and Systems (IROS 2009). St. Louis. 2009.
[5] A Hayes, A Martinoli, R Goodman. Distributed Odor Source Localization. IEEE Sensors Journal, Special Issue on Electronic Nose Technologies. 2002; 2(3): 260-273.
[6] Draeger. Gas Dispersion. 2016.
[7] O Brock, J Tinkcle, F Ramos. Gas Distribution Modeling using Sparse Gaussian Process Mixture Models. Autonomous Robot. 2009; 26: 310-317.
[8] Norazian MN, A Shukri Yahaya, N Azam Ramli, M Mustafa Al Bakri. Using The Linear Interpolation Technique To Estimate Missing Values For Air Pollution Data. Universiti Sains Malaysia. 2016. [9] P Jamjuntr, N Dejdumrong. Thai Font Type Recognition using Linear Interpolation Analysis. Sixth
International Conference on Computer Graphics, Imaging and Visualization. Tianjin. 2009. [10] J Foulds. Carbon monoxide in cigarette smoke. 2016.
[11] AH Joarder. Six Ways to Look at Linear Interpolation. International Journal of Mathematical Education in Science and Technology. 2016.