Human Biasin Construction Industry
and ReducingIts Effect
Usingthe Last Planner System Method
(Case Study inPT. XYZ)
Mutmainah
*, Ahmad Andreas Tri Panudju
* *Program Studi Teknik Industri, Universitas Muhammadiyah Jakarta [email protected], [email protected]
ABSTRACT
Research on decision-making in lean environment has not been studied enough, and that inspired us to run more precise investigation in that area. Nowadays, with the implementation of lean in numerous companies all over the world, it is important to understand not only the truisms of lean, but also what impact does it have on sub processes of activities of the organization.
As it is known, decisions are made by human and that means those decisions are influenced by many human factors. One of those factors is biases and framing effects, that had been closely studied by Noble prize winner Daniel Kahneman and his co-author Amos Tversky. They studied those effects from a point of view of economical psychology, yet not going into details. We took their work as a basis for our study of human biases and decision-making under uncertainty in off-shore construction.
In this research, we try to take a closer look into three theories (lean planning, the last planner system and
decision-making under uncertainty). We connect them in order to achieve an understanding of how those aspects of organization’s
activities are connected and how they influence on each other.
This study was performed with two main goals in mind. The first goal was on one hand to understand and identify the main sources of uncertainty in the engineering process; and on the other hand to identify the main human biases that affect the decisions made in the engineering process. The second goal was to see the theoretical aspects of decision-making through the process of lean planning and lean information flows implementation and to identify ways to reduce the impact of the human bias on the decisions made.
Results of this research are lean knowledge not sufficient, uncertainty can be handled better with lean, and overall improvement not enough. Human biases exist in engineering department are availability bias, representativeness bias, reliability bias and anchoring bias.
To minimize the effect of biases can be done through multi process which involved many parties, such as six thinking hats technique, the premortem technique, checklists and memos. Besides that lean planning and the last planner system in the engineering process make the process having better certainty.
Be on time, adapt to customer demand, inter-department coordination and information flow in general have been improved 25% after applied lean planning.
Future research can be much more focus on evaluation and the way to handle human biases.
Keyword: Human Bias, Lean Planning, The Last Planner System, decision making, uncertainty.
INTRODUCTION
Human life full of decision making moments which have many problem varieties, from simple and clear to unclear problem, full of risk and uncertain. This kind of problems caused structured decisionandunstructured decision.
Rational decision making approachment was developed with expected utility theory (Plous, 1993). This theory simply said that human made decision making based on nett maximum value of utility which can be attained from a decision making which has been made.
TverskyandKahneman (1981) developed a model decision making in that kind of situation with different scenario, which is having changesfrom positif result into negative result:
- Choice A lost Rp1.000.000, fix.
- Choice B lostRp2.000.000 with probability 50% andprofit Rp0, with probability 50%. Based on expected utility theory, people would be indifferent to that situation. But, TverskyandKahnemanshown us that people would prefer to choose B. At once, this case show that risk factor influenceson someone decision making process,
by economical behavior (behavioral economics), in finance recognized as behavioral finance, and in accountancy recognized as behavioral accounting, as well as at discipline of science of psychology and sociology.
In construction industry, various decision perpetrators in value chain make assorted of decision as according to their function each. It is very clear that to increase company profit can be through the waste elimination in the plan and also production process. Intention of applying lean is to lessen the lead-time, and work in process, to get the complete delivery frequency level from supplier in small size measure (small of lot sizes) and for aligning of all activity in the plan, development and construction development. In organization, before designing and implementation a plan or production system, it is important for management to comprehend the information of what have to be known in all value chain, who analyze and take the point and decision mentioned told to succeed. This examination ascertain the availability and qualityevery decision made.
Uncertainty in offshore construction can be classified under three main categories:
• suppliers’ uncertainty, • production uncertainty • project-owners’ uncertainty
Whereas of each category could be explaining in some points, they are:
1. Suppliers’ uncertainty, consist of :
- Late deliveries
2. Production uncertainty consist of:
- Quality problems
3. Project-owners’ uncertainty consist of:
- Variation orders( VO)
Another important factor affecting the decisions is framing effect. With framing effect, depending on how questions are formulated people attitude toward risk varies. They become risk averse when the problem is put in a positive frame or gain aspect and risk seeking when the
problem is presented in a negative frame or loss aspect (Kahneman and Tversky, 1979). Therefore, asking the incorrect question can affect considerably the outcome (Wallace, 2005). Pieters (2004) who studied framing effect in petroleum impossible to have all the information required to make a decision; there should be a tailored decision-making process, which allows to reduce as much as possible the impact of the above mentioned systematic errors (ibid)
The aims of this research are:
- The first goal was on one hand to understand and identify the main sources of uncertainty aspects of decision-making through the process of lean planning and lean information flows implementation and to identify ways to reduce the impact of the human bias on the decisions made
METHOD
Our research has been done at PT. XYZ, located in Ds. Bojonegara – Serang, BANTEN.
Our research was done through three questionnaires in cooperation withthe management. Questionnaires wereaddressed to the engineers of the engineering department. These questionnaires addressed different aspect of our study. Questionnaire 1 was related to uncertainty and leanplanning. Questionnaire 2 was made to identify the main human biases and reveal theexistence of framing effect. The third questionnaire permitted to evaluate professional maladjustment. The results of these questionnaires served as basis for our analysis and we did not have any interview for data collection. During our research period, we stayed most of the time on site and had different meetings with themanagement to reframe the research and questionnaires. Meetings were arranged with the engineers as well to give them an idea of the purpose of our research. Data obtained
RESULT
The result in general give the idea that uncertainty much more because of human being factor, where causing stream process the information which do not go properly, unavailable required document, and others.
Owner and worker leader have the periodic and weekly meeting to discuss the deviation that happened from planning which have been decided and monitor the activity which underway. In the meeting usually expostulated problems that happened by all concern party in the work.
However, wrong assessment or calculation of all possibility which is possible happened, can make entire group take the wrong decision and direction. Further, way of meeting or issue scheduled can form a framing; what in the end will only yield a same decision effect. Oftenhappened individually,anengineer has to prepare the design and themodel of 2 dimension or 3 dimension without having all information needed. In this contextthe use of heuristics can cause the diffraction which induces at decision which they make.
To prevent that matter, various approaches can be used so thatlessening effect from human bias in decision making that happened individually and also decided in weekly meeting.
Others, require to benotice that, researcher had not yet seen the applying multi-person process in decision making especially the six thinking hats technique. Following step is proper several things to lessen the effect human deflect in decision making.
Planning Process
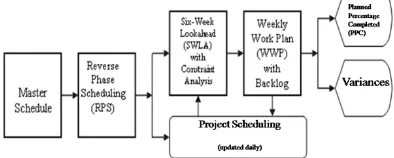
In the matter of planning which is paid attention to that all member of team have to design the last planner system which can fulfill the specification matching with requirement, condition and challenge which possible arise during project take place. To prevent the happening of waste generated because of mistake in decision making, traditional system of push scheduling technique have been replaced by pull scheduling technique and planning team. The matter also is to develop the communications system in two directions. Figure 1 below depicts the sequence in applying of the last planner system in construction industry.
Figure 1: The Sequence of Last Planner Process
The process involved the following steps: 1. A master schedule was developed by the
project manager which utilized a push system approach and cumulative experience from similar projects;it included an overall schedule with all phases. The master schedule and drawings with pouring sequences were distributed to all planners and the rebar supplier before the Reverse Phase Scheduling meeting.
2. Before the Reverse Phase Scheduling (RPS) meeting, lean concept and Last Planner procedures were explained to all Last Planners. All Last Planners and the rebar supplier participated in team planning, and developed network of detailed activities for Phase I of RPS. One RPS meeting was conducted at the start of the project. Using a long sheet of paper on the wall and post-its, Phase I was split into activities with the feedback of all Last Planners. First, the planners wrote down activities, with their durations, on the post-its, one activity per sheet, and stuck those sheets on a long sheet of paper that was posted on the wall forming a timeline, from a target completion date backward. Next, all planners identified the logic between these activities and adjusted the sequences if needed by moving the sheets, and they discussed and decided which activities would dominate the critical path. Then, float, used as the schedule contingency, was added to the activities that were on the critical path and contained some uncertainty. The milestone of the master schedule was an important guideline for RPS production. Finally, the final schedule adjustment was taking the place. A detailed schedule was prepared and some constraints appeared. The RT observed the whole process and then produced an electronic RPS file from this new set of detailed schedule. 3. Six-week look-ahead (SWLA) is a six- week
rolling schedule with constraints indicated. The project schedule updated daily which was adjusted from the actual project schedule. SWLA was produced by the project manager based on the results of the RPS and the project schedule. RT documented constraints with indication by the project manager, and performed the constraints analysis. SWLA was distributed to all last planners at WWP meetings.
4. The participants in the WWP meeting included all Last Planners and the RT. The meetings were held each Thursday. Each
trade submitted its own upcoming week’s
safety, 5S (clean-up and material lay down area issues especially), construction methods, delivery schedules, and any problems from the job site were discussed as part of the planning process during the meeting. Open and two-way communication was the key to the success of this meeting.
5. At the end of each week or on the following Monday, the researcher interviewed the project manager and documented the actual schedule for each activity that was performed. They then reproduced an electronically updated WWP schedule and variance control table, and analyzed them. PPC charts and PPC calculations were also prepared by the researcher. The PCC calculation is based on the actual start and finish dates of activities. In addition to the overall Percent Plan Complete (PPC) of the project, individual PPC Charts for each trade were prepared to compare their individual progress. Each planner received both PPC charts during the WWP meeting.
Mapping Process
The process starts with the master schedule which is used as a basis for delivering the project delivery and meeting milestones. It contains major project milestones including: entitlements, submittal of first design increment, submittal of second design increment, submittal of third design increment, start of demolition, start of construction, and commissioning of hospital operations.
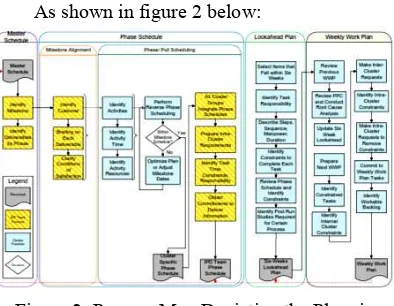
As shown in figure 2 below:
Figure 2: Process Map Depicting the Planning Processes at CHH (Modified from The Last
Planner Handbook at CHH, 2009)
The first step is identifying a milestone to map and highlighting the deliverables to release when the milestone is complete. However, it is crucial at this stage to align the perspectives of various project partners for each milestone that needs to be mapped.
Schedule Development
Next step is making a Schedule Development. Figure 3 below showsa layout of the fourth planning process that formed the last planner system.
Figure 3: The LPS Scheduling Development Model (Hamzeh 2009)
The first process is master scheduling which
incorporates owner’s expectations, logistics plans,
and work strategies into a master schedule. The master schedule presents milestones and phase level activities. Phases are represented by boulders to characterize coarse level of detail involved.
Information Flow
In planning, to avoid mistakesin decision makingit requires designing transparent pathways for information flow. Figure 4 presents a model mapping information flow between pull /phase scheduling sessions, cluster group meetings, and team planning meetings.
Figure 4: Information Flow Model for Planning Processes (Modified from The Last Planner
Handbook, 2009)
Before the beginning of a phase, each individual cluster group meets and develops a phase schedule. The master scheduler incorporates phase schedules into the master schedule which is built and updated biweekly in a meeting involving cluster-group representatives.
User Acceptance also is evaluated to determine if uncertainty have earned overcome by lean planning effectively, evaluating progress by totally and amenity to remain at schedule which have been determined.
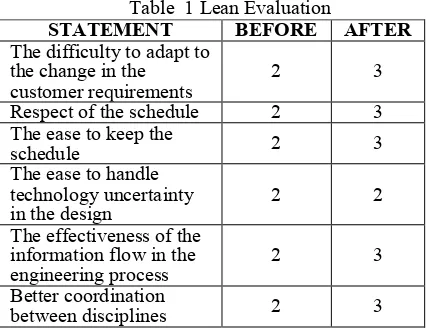
Then all engineer asked to do the evaluation to some different statement, as summarized in tables 1 which deal with accomplishment of schedule and adaptation to consumer request when before and after applying of lean planning. Evaluate scale is between 1 until 4 (where 4 is the highest point). From this evaluation is gotten information that schedule accomplishment which have been determined, adaptation to consumer request, coordination of inter department and good information stream have had the improvement in general equal to 25 % after applying of lean planning ( scale of 2- 3).
Table 1 Lean Evaluation
STATEMENT BEFORE AFTER
The difficulty to adapt to the change in the management area and economic. They are:
- Pranoto, Y (2005) in its dissertation explain how effect human deflect in management performance enchain the pasok. He concluded that decision influenced by human bias systematically gave deviation into effort to maximize the profit. Similarity which researcher has been done is the topic of how human bias influence the decision-making processes. The difference is, Pranoto discuss it in supply chain management context and analyze the advantage which possible happened improvement had been done.
- Welsh, BeggandBratvold (2009) in his research explain how human bias in oil and gas industry has been the cause of the loss of billion
dollars. Research was conducted to 51 students of final year of Australian petroleum school, with questionnaire method. The result showed how systematic training can be done to prevent the loss which possible happened. This research is shown the influence of human bias in decision making. This was in line with what we have done.
- TraoreandRymarava (2011) in his research explained how human bias in decision making happened in shipbuilding industry and their types. The method used was questionnaire method its sample is engineering department. This research has similarity with what we have done that is confirm the theory which have been explained by Kahneman and Tversky.
Company Implication
From the result and what we have demonstrated in engineering department, can be shown the potency of performance improvement. Besides respect to the schedule, company can make re-documentation of projects that have been done, ongoing and is going on. So the time target and performance improvement can be achieved. As shown in figure below:
Figure 6: Changing EPC flow that has been expected
Limitation
The study faced a limitation that relies on the availability of resources. The researcher was able to get data from a company only. But, the result was sufficient to get a picture of all process that we have done.
Conclusion
This research was based on an interdisciplinary framework combining decision making under uncertainty, lean planning and information in supply chain. The research was conducted in the engineering department of XYZ permits to identify some of the main sources of uncertainty, which cause delays on the planning. We also identify the main biases occurring in the department. The presence of bias due to the use of heuristics as availability and representativeness lead to decision-making errors and wrong estimate of value and probabilities. They cause wrong decisions in case of uncertainty and affect the planning.
wrong decisions create more delays and affect the planning. It is therefore important to keep the lean planning and take advantage of this planning coordination of the engineering work and the third party activities is due mainly to ineffective information flow and lack of capacity. The delays in the execution of the different steps of the work come principally from imprecise and unavailable technical documentation. These delays are caused
also by late customers’ requests and rework.
The evaluation of lean planning reveals an improvement of 25 % of the respect to the schedule and the coordination between the disciplines. The overall improvement brought by lean planning on the engineers’ work is
not enough. However as evaluated by the engineers, it permits to reduce significantly the level of uncertainty in the engineering process.
The human biases above-mentioned cannot be completely eliminated but their impact on the decisions can be reduced. This allows decision makers to tackle uncertainty more effectively and provide some flexibility in the engineering process.
The techniques use to reduce the impact of biases on the decisions are multi-person processes through six thinking hats technique, the premortem technique, checklists and memos. Besides that lean planning and the last planner system in engineering processcan make the process to have a better certainty. Therefore it is important to get benefit of them.
Future Works
Further researches can evaluate the impact of each of the techniques on the reduction of the reduce uncertainty level and human bias level.
REFERENCES
Anikin, A.B. (2001). Logitics. Moscow: Infra-M,
Art of lean: Eiji Toyoda on the roots of TPS. Available from:
http://artoflean.com/files/Eiji_Toyoda_On_The_Roots_o Construction Institute Monterey, Ca. Available on the
Lean Construction Institute's web site
http://www.leanconstruction.org
Ballard, G.(2000) "Lean Project Delivery System", White Paper 8, Lean Construction Institute.
Ballard, G. & Howell, G. (2000). “Implementing Lean
Construction: Stabilizing Work Flow”.
Ballard, G. (2000) “The last planner system of production control” Thesis for Doctor of Philosophy, Faculty of Engineering of the University of Birmingham
Ballard, G. (2004). “The Last Planner”. Monte rey: Northern California Construction Institute,
Ballard, G., Hamzeh, F. R., and Tommelein, I. D. (2009). “Is The Last Planner System Applicable To Design? A Case Study.” Proceedings for the 17th Annual Conference of
the International Group for Lean Construction
Bereby-Meyer, Y., J. Meyer, et al. (2003). "Decision making under internal uncertainty: the case of multiple-choice tests with different scoring rules”.
ActaPsychologica112(2): 207-220.
Bulsuk, K.G. (2009) “Taking the first step with the PDCA
(Plan-do-Check-Act) cycle” Available from
: http://blog.bulsuk.com/2009/02/taking-first-step-with-pdca.html#axzz1MJIac1lj
Campbell, A. and J. Whitehead. (2010) “How to test your
decision-making instincts” McKinsey Quarterly.
Available from:
www.mckinseyquarterly.com/How_to_test_your_decisio n-making_instincts_2598
Chen, I. J. and A. Paulraj. (2004). "Towards a theory of supply chain management: the constructs and measurements."
Journal of Operations Management 22(2): 119-150. De Bono, E. (1985). “Six Thinking Hats”. Boston: Little,
Brown
Elfving, J. A., I. D. Tommelein, et al. (2005). "Consequences of competitive bidding in project-based production."
Journal of Purchasing and Supply Management 11(4): 173-181.
Emblemsvag, J. (2010). “Implementing lean planning at STX Norway Offshore AS Søviknes”.
Gordon, J. R. (1993). “A diagnostic approach to organizational behavior”. Boston, Allyn and Bacon.
Gunasekaran, A. and E. W. T. Ngai. (2004). "Information systems in supply chain integration and management."
European Journal of Operational Research 159(2): 269-295.
Hamzeh, F.R. (2009). Improving Construction Workflow- The
Role of Production Planning and Control. Ph.D. Diss., Civil and Environmental Engineering, University of California Berkeley, CA.
Haselton, M. G., and Funder, D. C. (2004). “The Evolution of Accuracy and Bias in Social Judgment”. Psychology Press, UCLA.
Hobbs, D. P. (2003). “Lean Manufacturing Implementation: A Complete Execution Manual for Any Size Manufacturer”
Ilyasov, F.N. (2011) “Representativeness of the survey
results in market research” Sociological Research. 3: 112-116.
Kahneman, D. and G. Klein. (2010) “Strategic decisions when can you trust your gut” Mckinsey Quarterly. Available from:
https://www.mckinseyquarterly.com/Strategic_decisions _When_can_you_trust_your_gut_2557
Kahneman, D. and Tversky, A. (1979). “Prospect theory: An
analysis of decision under risk”. Econometrica, 47, 263-291
Kahneman, D. and Tversky, A. (1984)."Choises, Values, and Frames." American
Psychologist: 341-350
Kahneman, D., Slovic, P. and Tversky, A. (1987). “Judgement
under uncertainty: Heuristics and Biases”. Cambridge: Cambridge University Press.
Karoway, C. (1997). “Superior supply chains pack plenty of byte”. Purchasing Technology 8(11): 32 - 35.
Kirshina, M.V. (2001). “Commercial Logistics”. Moscow: Centre for Economics and Marketing.
pressure, incentives, and the quality of decision-making."
Journal of Economic Behavior & Organization 61(3): 375-392.
Korte, R. F. (2003). “Biases in Decision Making and Implications for Human Resource Development”. Advances in Developing Human Resources Vol. 5, No. 4 November 2003, 440-457.
Kruglanski, A. W. and Ajzen, I. (1983). “Bias and error in human judgment”. European Journal of Social Psychology 19: 448-468.
Kalsaas, B. T. (2012). “The Last Planner System Style of Planning: Its Basis in
Learning Theory”. Journal of Engineering, Project, and Production Management 2012, 2(2), 88-100.
Kuhberger, A. (1998) “The influence of framing on risky
decision: A meta-analysis” Organizational Behavior and
Human Decision Processes 75:23-55,
Lacksonen, T., B. Rathinam, et al. (2010). "Cultural Issues in
Implementing Lean Production." IIE Annual Conference.
Proceedings: 1.
Lindhard, S. &Wandhal, S. (2013). Improving Onsite Scheduling: Looking Into the Limits of the Last Planner
System. The Built & Human Environment Review,
Volume 6, 2013
March, J. G. (1994). “A Primer on Decision Making: How
decisions happen”. New York : W. W. Norton
Maule, A. J., G. R. J. Hockey, et al. (2000). "Effects of time-pressure on decision-making under uncertainty: changes in affective state and information processing strategy."
ActaPsychologica104(3): 283-301.
McManus, H., A. Haggerty et al. (2005). “Lean engineering doing the right thing right” 1st International Conference on Innovation and Integration in Aerospace Sciences. 4-5 August 2004-5, Queen’s University Belfast, Northern Ireland, UK.
Na’im, A. (2010). “PENGAMBILAN KEPUTUSAN,
PERTIMBANGAN DAN BIAS”.
PidatoPengukuhanJabatan Guru
BesarpadaFakultasEkonomikadanBisnisUniversitasGadj ahMada
O'Brien, London, danVrijhoef. (2002) "Construction Supply
Chain Modeling: A Research Review and
Interdisciplinary Research Agenda", Proc.10th Annual Conf. of the International Group for Lean Construction. Ordofiez, L. and B. Lehman III. (1997). "Decisions under
Time Pressure: How Time Constraint Affects Risky
Decision Making" Organizational Behavior and Human
Decision Processes 71(2) :121-140
Pranoto, Y. (2005). “EFFECTS OF HUMAN DECISION BIAS ON SUPPLY CHAIN PERFORMANCE”. A dissertation doctor, Industrial and System Engineering, Georgia Institute of Technology.
Pieters, D. A. (2004). “The influence of framing in oil and gas
decision-making”. Lionheart publishing Inc USA
Riezebos, J. and W. Klingenberg. (2009). "Advancing lean manufacturing, the role of IT” Computers in Industry
60(4): 235-236.
Riezebos, J., W. Klingenberg, et al. (2009). "Lean Production
and information technology: Connection or
contradiction?" Computers in Industry 60(4): 237-247 Sacks, R., M. Radosavljevic, et al. (2010). "Requirements for
building information modeling based lean production management systems for construction." Automation in Construction 19(5): 641-655.
Sibony, O. (2011) “How CFOs can keep strategic decisions
on track” Mckinsey Quarterly.
Availablefrom:https://www.mckinseyquarterly.com/How
_CFOs_can_keepstrategic_decisions_on_track_2750
Wallace, S. W. (2005). “Decision Making Under uncertainty:
the art of modeling”. Molde University college,
compendium.
Welsh, Begg and Bratvold. (2009). Efficacy of Bias
Awareness in Debiasing Oil and Gas Judgments”.
Research paper. Australian School of Petroleum, Australia.
Steve, L. H. (2003). "An introduction to lean production
systems." FDM 75(13):58.
Taghizadegan, S. (2006) “Road Map to Lean Six Sigma
Continuous Improvement Engineering Strategy”
Essentials of Lean Six Sigma, Pages 107-174.
Tchernikh, E. (2009)."Operational planning and quality: domestic and foreign experience." Quality Management. Tokarev A.S. (2006). “Examples of TRIZ using” Moscow
public institution of technical art, Moscow.
Traore, Y. and Rymarava, Y. (2011). “The Human Bias in Shipbuilding Decision Making”. Tesis. Molde University College, Norwegia.