ISSN: 2155-9600
The International Open Access
Journal of Nutrition & Food Sciences
Editor-in-Chief
Weiqun (George) Wang
Kansas State University, USA
Executive Editors
Song Won O
Michigan State University, USA
Arun K Bhunia
Purdue University, USA
Masayoshi Yamaguchi
The University of Missouri-Columbia, USA
Yuanyuan Li
University of Alabama, USA
T
his article was originally published in a journal by OMICS
Publishing Group, and the attached copy is provided by OMICS
Publishing Group for the author’s beneit and for the beneit of
the author’s institution, for commercial/research/educational use
including without limitation use in instruction at your institution,
sending it to speciic colleagues that you know, and providing a copy
to your institution’s administrator.
All other uses, reproduction and distribution, including without
limitation commercial reprints, selling or licensing copies or access,
or posting on open internet sites, your personal or institution’s
website or repository, are requested to cite properly.
*Corresponding authors: Dina Keumala Sari, Department of Nutrition, Medical Faculty of Sumatera Utara, Jl. Dr. Mansur, No. 5, Kampus USU, Padang Bulan, Medan, Indonesia, Tel: +62 61 8212296, +62 8174894768; E-mail [email protected]; [email protected]
Received October 25, 2013; Accepted November 23, 2013; Published November 25, 2013
Citation: : Sari DK, Damanik HA, Lipoeto NI, Lubis Z (2013) Is Micro Evolution in Tropical Country Women Resulting Low 25(OH)D Level?: A Cross Sectional Study in Indonesia. J Nutr Food Sci 4: 246. doi: 10.4172/2155-9600.1000246
Copyright: © 2013Sari DK, et al. This is an open-access article distributed under the terms of the Creative Commons Attribution License, which permits unrestricted use, distribution, and reproduction in any medium, provided the original author and source are credited.
Is Micro Evolution in Tropical Country Women Resulting Low 25(OH)D
Level?: A Cross Sectional Study in Indonesia
Dina Keumala Sari1*, Harun Alrasyid Damanik1, Nur Indrawaty Lipoeto2 and Zulkili Lubis3
1Department of Nutrition, Medical Faculty of Sumatera Utara, Medan, Indonesia 2Department of Nutrition, Public Health Faculty of Sumatera Barat, Padang, Indonesia
3Zulkili Lubis (ZL), Department of Food Science and Technology, Agriculture Faculty of Sumatera Utara, Medan, Indonesia
Abstract
Background: Low serum 25(OH)D levels often occur during the winter and spring of temperate countries due
to low sun exposure but there are many other factors linked with vitamin D deiciency that can occur in tropical
countries.
Objectives: to assess 25(OH)D serum levels, to compare the difference of associated factors, and to ind the
factors that independently associated with 25(OH)D level.
Method: This cross sectional study was conducted on 156 healthy Indonesian women during the dry season. This study measured serum 25(OH)D levels, examined two single nucleotide polymorphisms of vitamin D receptor gene (TaqI and BsmI), assessed lifestyle factor, and body fat percentage.
Results: The mean serum 25(OH)D level was 18.8 ± 7.0 ng/mL, there were 148 subjects categorized as either
deicient and insuficient, and eight were categorized as suficient. However, none of the subjects achieved normal
25(OH)D values (normal value in sunny countries: 54-90 ng/mL), all participants were heterozygous (T>C for TaqI
and A>G for BsmI). There were associations between vitamin D deiciency-insuficiency and suficiency with indoors
occupation (p<0.001), low vitamin D intake (p=0.046), less than 1 hour sun ray exposure (p<0.001), and low physical activity (p=0.01). Logistic regression showed that prediction factors that independently associated with the risk of low 25(OH)D level were sun ray exposure, occupation, and vitamin D intake.
Conclusion: The results showed that vitamin D deiciency may occur in women with indoors occupation, low
vitamin D intake, less than one hour sun ray exposure, and low physical activity. All participants were heterozygous
(T>C for TaqI and A>G for BsmI). Factors that most inluenced vitamin D serum were sun ray exposure, occupation,
and vitamin D intake.
Keywords:
25(OH)D levels; Micro evolution; WomenIntroduction
Vitamin D deiciency and insuiciency occurs in approximately one billion people around the world [1], not only in four season, but also subtropical country with three season. A study in female South Asian immigrants in Europe showed vitamin D deiciency and studies in India, found vitamin D deiciency in pregnant women and post menopausal women [2,3]. Vitamin D deiciency is also found in individuals living in tropical countries with two seasons, a study in Southern India also showed vitamin D deiciency, 52% of 164 post-menopausal women had vitamin D insuiciency, and 30% had a vitamin D deiciency [4]. A study by Rahman et al. [5] found 27% of post-menopausal women had a vitamin D deiciency (based on a serum 25(OH)D level examination), and 71% had a vitamin D insuiciency, however, there are no study report in healthy adult women in Indonesia.
he impacts of such deiciency includes decreased bone mineral density in 10-18 year-olds [6], while rickets and osteomalacia is increasing in infants and children and have become one of the causes of high mortality in Southern Asia [7,8]. he risk of osteoporosis has also increased in post-menopausal women living in this area [8]. Vitamin D deiciency is not only afected by season, but also occurs due to lifestyle factors [9,10]. Such factors include occupation, duration of sun exposure, dressing style, the use of sunscreen, physical activity, and vitamin D intake from both regular meals and vitamin D supplements [11]. Another factor found to be able to afect vitamin D level is obesity; studies have shown an association between the amount of body fat and vitamin D levels. Obesity is deined as an excess of fat in adipose tissue
that may afect health [12]. Obesity can be quantiied by measuring body fat using either the Bioelectrical Impedance (BI) method or, more simply, by calculatingthe Body Mass Index (BMI). Studies have shown that as body fat increases, 25(OH)D level decrease. his is because vitamin D is stored in the adipocytes and the excess fat makes it is diicult for vitamin D to be released into the bloodstream [13].
Citation: Sari DK, Damanik HA, Lipoeto NI, Lubis Z (2013) Is Micro Evolution in Tropical Country Women Resulting Low 25(OH)D Level?: A Cross Sectional Study in Indonesia. J Nutr Food Sci 4: 246. doi: 10.4172/2155-9600.1000246
Page 2 of 7
percentage being higher in the group with the TaqI (T>C genotype) in the VDR gene (TaqI T>C= 82.98%, TT=12.77%, and CC=4.25%). he increasing of vitamin D deiciency was also associated with lower intestinal calcium absorption, inverse relation with serum parathyroid hormone, and afecting the mineral density of the bones. Almost 200 polymorphisms have been found in the VDR gene, but their efect on VDR function remains unclear [18]. Most of the polymorphisms are located in the 3’ untranslated regions of the gene. his region plays a role in gene expression, especially in modulating mRNA stability [19]. he VDR gene is located in chromosome 12q13.1, is larger than 100 kbp, contains 14 exons, and has a promoter region that is continuously being transcribed in various tissues [20].
As far as the authors are aware, this is the irst study to examine serum 25(OH)D in female Indonesians, to compare the diference of associated factors, and to ind the factors that independently associated with 25(OH)D level. he variables were anthropometry, lifestyle, vitamin D intake, and two single nucleotide polymorphisms in the VDR gene (TaqI and BsmI) with serum 25(OH)D levels in women. he results of this study will help us identify ways of preventing vitamin D deiciency among Indonesian women, which could improve their quality of life.
Participants and Methods
Study design
his study was a cross sectional study, conducted at participant’s work place, in the City of Medan, North Sumatera, Indonesia. his study was carried out ater ethical approval was obtained from the Health Research Ethics Committee of Sumatera Utara University Medical School (No. 171/KOMET/FK USU/2012).
Study participants
he subjects of this study consisted of 156 women, the inclusion criteria were healthy women between 20-50 years old. Exclusion criteria were subjects with history of diabetes mellitus, myocardial infarction, or gastrointestinal, renal or liver dysfunction. In addition to those exclusion criteria, subjects who were pregnant, lactating, or using medications that may alter lipid proile were also excluded. his study was conducted between July and October 2012, during the dry season in Indonesia is between April and October.
All participants stated how long they were exposed to the sun throughout the day and were asked to choose between one of three options, <1 hour, 1-3 hours, and > 3 hours per day. Dressing style was also included as variable, because women wearing hijabs are less exposed to the sun compared to ones who do not. A woman wearing a hijab usually covers her whole body except her face and hands. Participants were also asked whether they regularly used sun cream (yes/no answer) to gain information as to whether the participant adhered to a sun-avoiding lifestyle (Table 2).
he whole observation was carried out in the participant’s workplace. Participants from a variety occupations were included in the study (including teachers, bank employees, doctors, and nurses), most of whom worked indoors. he subjects were included in the study ater completing an interview; also all subjects had read and signed an informed consent without any pressure.
Nutrition intake, anthropometric status, and body fat
Nutrition intake was assessed using food recall for two days (one on working day and one on holiday), and included in this assessment was
the intake of vitamin D. Calculation was perfomed using Nutrisurvey 2005, including the data of Indonesian cuisine. Assessment of the intake of vitamin D includes vitamin D obtained from meal sources and supplemental vitamin D.
Body mass index and body fat percentage was assessed using the Body Composition Monitor with Scale (HBF-362, KaradaScan-Omron, Japan). BMI categories were based on Asia-Paciic criteria using the following categories: Underweight (<18.5 kg/m2), Normal weight (18.5-22.9 kg/m2), overweight (23-24.9 kg/m2), obese I (25-29.9 kg/m2) and obese II (≥ 30 kg/m2), for subject’s grouping: obese (>25 kg/m2) and non-obese (<24.9 kg/m2) [12].
Body fat percentage based on body fat mass represents the amount of body fat mass to total body weight. his calculation was based on simple formula of bioelectrical iimpedance. Categories for body fat percentage are: normal (<29.9%) and high (>30%).
Waist circumference was measured using a non-elastic measuring tape, and the results were categorized into: normal (<80 cm) and high (>80 cm) for Asian 12]. Participant height was measured using a free standing stadiometer with nonstretchable tape (microtoise). Systolic and diastolic blood pressures were measured using Automatic Blood Pressure Monitor (Omron, Japan). Physical activity was analysis using Baecke Questionnaire (21), questioning habitual physical activity, classiied into three categorized which were low, moderate, and high physical activity.
Biochemical analysis
In this study, we measured serum 25(OH)D levels because of it has a longer half life (2-3 weeks) than 1.25(OH)DE serum, which was 4-6 hours (1). his analysis was using chemilluminescent immunoassay (CLIA) technology (Diasorin, Stillwater, MN). his measurement can detect levels ranging from 4.0 to 150 ng/mL, based on 3.90% CV inter-assay precision. Serum 25(OH)D levels were categorized into: deiciency (<20 ng/mL), insuiciency (20-32 ng/mL), suicient (33-53 ng/mL), normal for tropical countries (54-90 ng/mL), excessive (100-150 ng/ mL) and intoxication (>150 ng/mL), in this study, all participants were categorized into: deiciency-insuiciency (<32.9 ng/mL) and suiciency (>33 ng/mL) [21,22].
Serum calcium levels were measured using ADVIA (Bayer Assayed Chemistry Controls). he reaction was measured on 545/658 nm. he normal level of serum calcium is 8.3-10.6 mg/dL, we categorized normal (>8.3 mg/dL) and low (<8.29 mg/dL).
Analysis of single nucleotide polymorphisms in VDR genes
Analysis of single nucteotide polymorphisms (SNP) in VDR gene through three steps: irst step was DNA isolation using ‘salting out method’, second step was checking for purity of DNA isolation, and the third step was SNP genotyping with Applied Biosystem Step One Plus Real-Time PCR Systems.
(7) Add 100 μl protein precipitations to the solution and then vortex for 20 seconds. (8) Centrifuge for 13000 rpm for 3 minutes in room temperature. (9) Add the supernatant into 1.5 Eppendorf Steril Tube illed with isopropanolol 300 μl and then vortex for 3 seconds. (10) Centrifuge 13000 rpm for 1 minute, observe for DNA pellet. Carefully remove supernatant. (11) Ater remove supernatant, add 70 ethanol 300 μl, centrifuge 13000 rpm for 1 minute. (12) Remove supernatant, air dry inside laminar hood for one night. Dilute with 100 μl DNA rehydration solution, and keep in 4°C for one night, for next day, keep in freezer -20°C.
he second step was checking for DNA purity, using nanophotometer (IMPLEN; P360). Ratio 260/280 in the range 1.8-2.2, showed good purity of DNA extraction from the irst step. he third step was SNP genotyping using 1-10 ng DNA. Both VDR gene polymorphism (TaqI and BsmI) were tested by allele discrimination using StepOnePlusTMReal Time PCR device (Applied Biosystems, Foster City, CA, USA), with added TaqMan probes (Applied Biosystems, Foster City, CA, USA). ‘Fast’ method was used to operate the PCR, beginning with the activation of DNA polymerase at 95°C for 20 seconds, followed by 40 cycles, and then succeeded by a denaturation process at 95°C for 3 seconds and annealing process at 60°C for 30 seconds. Fluorescence detection occurred at 60°C. he whole assay was operated in a 10 µL reaction, using TaqMan genotyping Master Mix with 96-Well Reaction plates, and using MicroAmp Fast Optical 96-Well Reaction plate covered with MicroAmp Optical Adhesive Film (Applied Biosystem, Foster City, CA, USA).
In assay genotyping using two alleles with probes for each allele, one of the tip of the probe were labelled with luorescence staining FAM and VIC. he label was used with the help of a reporter located at the 5’ end of the molecule in the form of high energy luorescence staining (FAM and VIC) and a quencher located atthe 3’ end of the probe
Statistical analysis
Sample size was determined based on the conidence interval of 95%, a study power of 90%, and assuming an efect size of 20%. A total of 156 subjects were recruited with consecutive sampling. Numerical
variables were used to indicate mean ± standard deviation, while categorical variables were used to indicate the percentage values of proportion. Association between numerical independet variable and 25(OH)D concentration were analized using pearson correlation and expressed as r, a correlation greater than 0.8 is generally described as strong, 0.5-0.8 moderate, and less than 0,5 is generally described as weak; association between dichotomous categorical independet variable and vit D concentration were analized using independent t-test and expressed as geometric mean (95%CI); association between polikotom categorical independet variable and vit D concentration were analized using oneway anova and expressed as geometric mean (95%CI); 25(OH)D concentration was transformed by log10 and was backtransformed for data presentation. Logistic regression analysis was used to look for prediction factors. For genotyping data analysis, individuals were divided into groups based on the genotypes and alleles of VDR gene. he groups were: heterozygotes, homozygous wildtypes, and homozygous mutants. Subsequent analysis was conducted to look for associations with serum 25(OH)D level. his study used SPSS program (version 11.5; SPSS Inc, Chicago, IL) for data analysis.
Results
All participant were based on general characteristic (age), anthropometry (BMI, waist, and body fat percentage), vitamin D intake, sun ray exposure, dressing style, sunscreen application, physical activity, and serum calcium level were listed in Table 1. he mean age of the subjects was 35.60 ± 7.68 years with a mean BMI of 25.49 ± 4.70 kg/m2.
Table 2, a mean serum 25(OH)D level of 18.7 ± 7.0 ng/mL. he result of this study show that serum 25(OH)D levels did not reach normal category for a sunny country (normal serum 25(OH)D level is 54-90 ng/mL). Only 8 out of the 156 participants showed a suicient serum level of 25(OH)D. here were no subjects with a normal or excessive level of 25(OH)D found in this study. that geometric mean of 25(OH)D levels were 17.71 ng/mL with CI95% 16.22-19.34, it also showed that 94.9% were categorized vitamin D deiciency-insuiciency and 5.1% categorized in vitamin D suiciency, none of the study
Parameters All n=156 OG n=78 NG n=78 p-value
Age (years) 35.60 ± 7.68 37.71 ± 6.64 33.5 ± 8.11 0.001*
Blood pressure
Systolic blood pressure (mmHg) 123.22 ± 10.03 127.45 ± 14.56 118.99 ± 15.18 0.01* Diastolic blood pressure (mmHg) 78.74 ± 10.03 81.13 ± 9.23 76.35 ± 10.29 0.742
Anthropometry
BMI (kg/m2) 25.49 ± 4.70 29.17 ± 3.70 21.82 ± 1.85 0.001*
Waist circumference (cm) 83.35 ± 11.04 91.27 ± 8.77 75.42 ± 6.42 0.007*
Body fat percentage (%) 31.99 ± 5.42 35.91 ± 3.34 28.06 ± 4.11 0.001*
Nutrient intake per day
Energy (kcal) 1413.12±543.19 1462.86±549.97 1363.37±535.21 0.062 Vitamin D intake (µg) 1413.12 ± 543.19 1462.86 ± 549 1363.37 ± 535.21 0.062
Carbohydrate (g) 188.29±85.06 188.68±82.46 187.91±88.12 0.703
Protein (g) 44.52±18.37 45.52±19.89 43.52±16.78 0.459
Fat (g) 46.23±38.65 51.47±42.44 40.99±33.92 0.041*
Cholesterol 238.73±210.68 239.09±199.37 23836±222.71 0.554
Fiber 5.8±6.9 6.59±9.29 5.03±3.14 0.076
Biochemical biomarkers
Calcium serum (mg/dL) 9.11±0.49 9.05±0.58 9.169±0.37 0.603
25-hydroxy vitamin D serum 9ng/mL) 18.75±7.01 18.34±5.99 19.16±7.92 0.917
Citation: Sari DK, Damanik HA, Lipoeto NI, Lubis Z (2013) Is Micro Evolution in Tropical Country Women Resulting Low 25(OH)D Level?: A Cross Sectional Study in Indonesia. J Nutr Food Sci 4: 246. doi: 10.4172/2155-9600.1000246
Page 4 of 7
participant reached normal categorized in sunny area. Percentile 50 of 25(OH)D value was 18.4 ng/mL, with minimum percentile was 7.1 ng/ mL and maximum percentile was 42.5 ng/mL.
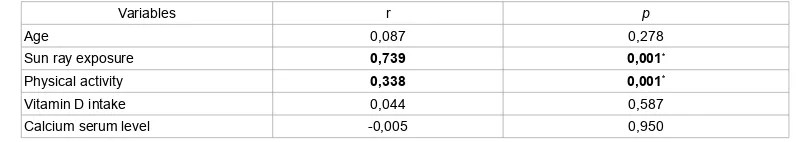
Table 3 showed associations between demographic, anthropometry, lifestyle, intake, and calcium serum with 25(OH)D serum concentration. Association showed that indoor occupation [p<0.001, 14.81 ng/mL (CI95% 13.98-15.70)], less vitamin D intake [p=0.046, 17.03 ng/mL
(CI95% 15.98-18.16)], ≤ 1 hour sun ray exposure per day [p<0.001, 14.29 ng/mL(CI95% 13.28-15.39)], low physical activity [p<0.01, 15.97 ng/mL(CI95% 14.90-17.11)] were signiicantly association with vitamin D deiciency. Table 4showed the results from multivariate analyses, ater adjusting for all related factors, the multivariate model revealed that less than 1 hour sun ray exposure per day, indoor occupation, and low vitamin D intake were all signiicant independent correlates of
Characteristics1 Obese Group n=78 n(%)
Non-obese Group
n=78 n(%) p-value
Vitamin D deiciency-insufiency
n=148 n(%)
Vitamin D uficiency
n=8 n(%) p-value Ethnicity2
Javanese 24(30.8) 48(61.5) 0.334 61(41) 2(25) 0.591
Bataknese 39 (50) 23(29.5) 59(40) 4(50)
Others 19(19.2) 7(9) 36(19) 2(25)
Occupation
Indoors 56(71.8) 51(65.4) 0.388 107(72.3) 0 0.001*
22(28.2) 27(34.6) 41(27.7) 8(100)
Sun exposure per day(mean±SD)
=60 minutes (38.2±10.12 minutes) 39(50) 34(43.6) 0.422 75(50.7) 0 0.007*
>60 minutes (218.33±99.34 minutes) 39(50) 44(56.4) 73(49.3) 8(100) Dressing style
Wearing hijab 27(34.6) 33(42.3) 0.323 91(61,.5) 5(62.5) 1.00
Not wearing hijab 51(65.4) 45(57.7) 57(38.3) 3(37.5)
Physical activity (mean±SD)
Low(4.70±0.59) 52(66.7) 50(64.1) 0.860 100(67.6) 2(25) 0.014*
Moderate (6.94±0.16) 26(33.3) 28(35.9) 48(32.4) 6(75) OR:6.25
CI 95%
1.21-32.12
Vitamin D intake(mean±SD)
Less (2.81±2.80mg/day) 68(87.2) 61(78.2) 0.204 125(84.5) 4(50.0) 0.012*
Moderate (17.12±8.9mg/day) 10(12.8) 17 (21.8) 23(15.5) 4(50.0) OR:5.43
CI 95%
1.26-23.29
Body fat percentage (mean±SD)
Normal (26.21±3.34%) 2(2.6) 54(69.2) 0.001* 49(33.1) 1(12.5) 0.003*
High (35.19±3.33%) 76(97.4) 24(30.8) OR:0.012 99(66.9) 7(87.5) OR:14.14
CI 95% CI 95%
0.17-0.35
25(OH)D serum categorized (mean±SD)
Deiciency-insuficiency (17.78±5.68ng/
mL) 77(98.7) 72(9.3) 0.152
Suficiency (37.37±4.79ng/mL 1(1.3) 6(7.7)
1Lifestyles: occupation, sunlight exposure per day, dressing style, sunscreen application, physical activity; 2Ethnicity: Bataknese: Batak, Mandailing, and Karo; Others: Aceh, Minangkabau, Malay, Chinese, Nias; * = p value with signiicance at p<0.05
Table 2:Associations in obese and vitamin d deiciency-insuiciency groups.
Variables r p
Age 0,087 0,278
Sun ray exposure 0,739 0,001*
Physical activity 0,338 0,001*
Vitamin D intake 0,044 0,587
Calcium serum level -0,005 0,950
Analysis using Pearson’s correlation; signiicant value: p<0.05
Correlations: weak (r<0.4), moderate (r=0.4-0.6), strong (r>0.6).
vitamin D deiciency-insuiciency.
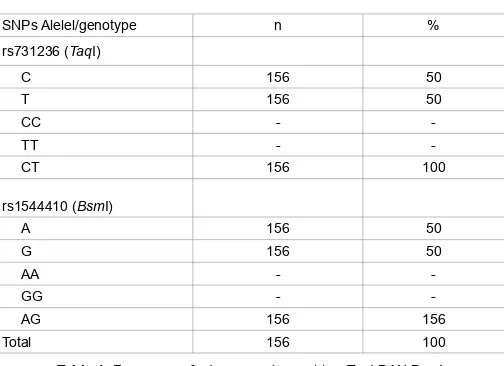
Table 4 showed the frequency of alleles and genotype of single nucleotide polymorphisms of VDR gene. On examining single nucleotide polymorphism of vitamin D receptor gene TaqI, it was apparent that the whole group were heterozygous (CT). hus, only one cluster was visible. Examination of single nucleotide polymorphism of vitamin D receptor gene BsmI showed similar results with TaqI, and the whole group were found to be heterozygous (AG). Based on there was only one cluster, so to analysis association between single nucleotide polymorphism of vitamin D receptor gene TaqI and BsmI with 25(OH) D serum, using abductive analysis; a form of logical inference that goes from observation to a hypothesis that accounts for the reliable data (observation) and seeks to explain relevant evidence. So, based on this analysis, there was an association between single nucleotide polymorphism of vitamin D receptor gene TaqI and BsmI with low level of 25(OH)D serum.
Discussion
his study was conducted in the Sumatera Island (North Sumatera, Medan), in the 3.57°N latitude and 98.65°E longitude. Average temperature was ± 32C (90°F) with eicient UV B exposure for absorption and producing suicient amount of vitamin D3 [23,24], in contrast to areas with high latitudes (more than 37°C) and a very slant sun ray angle that results in low production of vitamin D3 [25,26. It was shown that in some areas with latitudes higher than 51°, there was no vitamin D production in the skin [26]. A study was conducted using an angle greater than 70°, and it was found that dermal vitamin D synthesis can be absent from 5th October through 10th March ive months [26].
In our study, we found a very diferent result compared to other studies. We found that the average level of serum 25(OH)D was lower, and was not afected by body mass index or body fat percentage. he indings of this study were interesting, because the low level of serum 25(OH)D may occur in tropical countries apart from whether the women (20-50 years) have high BMI or body fat percentage. A study by Khor et al. [27] showed a diferent result, the subjects were school children, which was a contrasting association between serum 25(OHD) level and BMI in accordance to age, especially in boys. he association between serum 25(OH)D level and BMI produced a risk factor of 5.958 times more likely of developing vitamin D deiciency with appropriate BMI for older age [27]. Another factor associated with this condition was low intake of vitamin D. Vitamin D-fortiied meal was said to be consumed in very low amounts. Other factors that could lowering
25(OH)D serum level in children were sun exposure, indoor activities, and dressing style [27]. In our research, factors that associated with deiciency-insuiciency were occupation, sun exposure, physical activity, and vitamin D intake.
In previous study [27], low 25(OH)D level because of high body fat mass causes low levels of 25(OH)D in circulation, by trapping vitamin D inside fat cells. he study also stated that high amount of body fat decreases the bioavailability of vitamin D and suggest a direct examination of adipocyte cells, and not the examination of serum 25(OH)D level in blood serum, because examination of adipocyte cell is the appropriate indicator for subjects with high amount of body fat.
A study by Ferrarezi et al. [28] aimed to see the correlation between the variation of vitamin D receptor genes and the height of children (pre-pubertal and pubertal children). he study reported an inverse correlation between the level of serum 25(OH)D and the BMI in pubertal children. In this research reported that BsmI and TaqI genotypes were signiicantly associated with the height in pubertal children, but the association did not reach statistical signiicance in prepubertal children. he study concluded that the polymorphism afected the function of vitamin D receptor gene, and also afected body height by afecting bone growth in puberty.
In this study, we found that the body fat percentage is evenly distributed in all participants because of most results showed that the participants had greater amount of body fat percentage. Most studies used BMI to describe body fat, but this study used a more accurate measure, bioelectrical impedance. his measured showed that the majority of subjects in our study could be categorized as having high or very high body fat percentages. his study showed contrasting results with a previous study [29,30], where we found that subjects with high body fat percentages have low serum 25(OH)D levels, but similar result were also found in subjects with normal and low of body fat percentage.
However, despite the fact that low level of vitamin D is associated with body fat, in this study, most of the subjects with low and normal body fat percentage also developed vitamin D deiciency. It means that there are other factors causing vitamin D deiciency in women with low or normal body fat percentage. his result showed that the average level of serum 25(OH)D fell into the deiciency-insuiciency category. Serum 25(OH)D levels falling into suicient category were considered outliers, or in other words, the normal value was lying outside the average level of serum 25(OH)D of the overall study subjects.
Brock et al. mentioned that vitamin D intake was a predictive factor of the development of vitamin D deiciency [31]. Main food source for this vitamin is fortiied milk. Another factor that was found to be strongly correlated with the level of vitamin D was continuous physical activities. It was said that, compared to the sun exposure, a continuous physical activity can maintain the body status of vitamin D [31]. In this study resulting an equation to predict the probability of deiciency and insuiciency vitamin D, and inding that factors that independently associated with the risk of low 25(OH)D level are sun ray exposure per day, occupation, and classiication of vitamin D intake.
he underlying cause of low level of serum 25(OH)D is perhaps the single nucleotide polymorphism of vitamin D receptor genes. his result was shown in all subjects who were heterozygous, meaning that the receptor gene carried the genotype TC for the polymorphism of vitamin D receptor gene TaqI, and the genotype AG for BsmI [15]. Even though the mutation only occurred in one base (silent mutation), it seems that this mutation afected the level of serum 25(OH)D. hese results were apparent in categories of deiciency, insuiciency, and suiciency.
SNPs Alelel/genotype n %
Citation: Sari DK, Damanik HA, Lipoeto NI, Lubis Z (2013) Is Micro Evolution in Tropical Country Women Resulting Low 25(OH)D Level?: A Cross Sectional Study in Indonesia. J Nutr Food Sci 4: 246. doi: 10.4172/2155-9600.1000246
Page 6 of 7
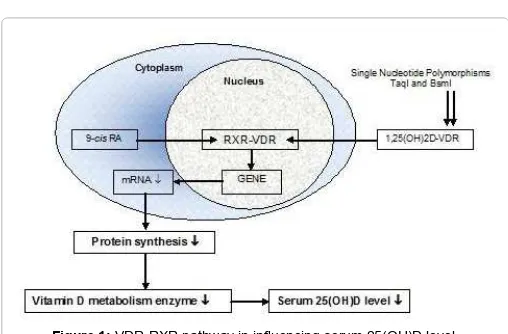
Level of 1,25(OH)2D is an indicator for the level of vitamin D, and an active form of vitamin D. he level of 1,25(OH)2D was maintained by human body until a deiciency in vitamin D occurred, but it is not a good indicator for an early-stage vitamin D deiciency, instead of 25(OH)D level [31,32]. he examination of 25(OH)D level in the circulation is recommended in assessing the normal function of vitamin D. he disturbed cellular pathways of vitamin D may afect the level of vitamin D with serum 25(OH)D level as a parameter [33].
he activity of 1,25(OH)2D form is homologous to steroid hormones, and the activity with the target cell is achieved through VDR, which is a nuclear transcription factor 34,35]. Additionally, VDR is a transcriptional factor that will form a ligand and will bind to vitamin D through a carboxy-terminal bond. VDR is also a nuclear receptor, along with steroid, thyroid, and retinoic acid receptors [36].
When 1,25(OH)2D difuses into a target cell, it binds toVDR and increases the heterodimer formation with RXR. Dimers form activates or suppresses transcription of target genes by binding the stimulating (co-activator) or inhibiting (co-suppressor) coregulators. his activity is diferent in each tissue,and eventually represents the activity of 1,25(OH)2D and its production. he co-activator complex contains histone acetylate, and subsequently transcription occurs on the exposed DNA, which forms a bridge between the initiation complex and the dimer, increasing the RNA polymerase II [37]. he VDR-RXR dimer then bonds to speciic sequence in the target promoter region called vitamin D response elements (VDRE). Some genes involved in the regulations of calcium, phosphor homeostasis and vitamin D metabolisms found present with VDRE [36,37] (Figure 1).
his study showed that the frequency of minor allele found for T and C was 0.5%, and this is similar to the result found by Vupputuri et al. [17]. A study by Jain (2010) on Southern Asian women living in New Zealand showed 0% frequency genotype for homozygous wild type and 156 (65.3%) for heterozygous, while the frequency for heterozygous mutant was 69 (28.9%). hese results were obtained using the same device on 225 female samples. For BsmI, of the 238 samples, only 1 sample (0,4%) showed homozygous wild type form, while 194 (81.5%) showed heterozygous form and 43 (18.1%) showed homozygous mutant form [38].
his study proved that the level of vitamin D was afected by the genetic mutation, based on the fact that the examination of single nucleotide polymorphism of VDR genes TaqI and BsmI showed that all subjects carried the genotype TC and AG. he similarities found were associated with linkage disequilibrium between both genes that
commonly occurred through polymorphism in TaqI as well as BsmI [16]. he genetic variance of VDR genes plays a role in metabolic disturbances. Single nucleotide polymorphism occurring only in one base is called missense, but a silent mutation may cause a change in the coded protein. Ogunkulade et al.[39] have suggested that single nucleotide polymorphisms (SNPs) within the VDR gene may inluence the stability, quantity, and activity of VDR protein and the rate of VDR gene transcription.
he limitation of this study lies in the fact that it does not have any data about the level of phosphorus and the concentration of the parathyroid hormones, no association can be made regarding those parameters. In addition to that, the design of this study limits the capability of concluding a causal association. To show associations, a randomized controlled trial is recommended on a larger sample size, and with more between-ethnic variations especially in Indonesia, with abundant sun exposure (tropical area). his study found that from all varieties of single nucleotide polymorphism, only one heterozygous cluster was found. here were no homozygous wild type or homozygous mutant gene found in associaton with the low level of 25(OH)D. his silent mutation form eventually may cause a micro evolution in human, with afects the susceptibility against diseases.
Conclusion
he result of this study showed that there was an association between allele frequency of the genotype T>C of TaqI and A>G of BsmI with the serum 25(OH)D level in the subjects. In this study we found only one heterozygous cluster, both for TaqI (TC) and for BsmI (AG), so it can assumed that lower level of 25(OH)D serum. However, based on the existing theory, the presence of heterozygous form may prevent the serum 25(OH)D level from reaching normal values. We can only found levels categorized as deiciency, insuiciency and suiciency. here were associations between deiciency-insuiciency vitamin D with occupation, sun ray exposure, physical activity, vitamin D intake, and body fat percentage in women with single nucleotide polymorphism TaqI and BsmI in this area.
References
1. Holick MF (2007) Vitamin D deiciency.N Engl J Med 357: 266-281.
2. Sachan A, Gupta R, Das V, Agarwal A, Pradeep KA, et al. (2005) High
prevalence of vitamin D deiciency among pregnant women and their newborns
in Northern India. Am J Clin Nutr 81: 1060-1064.
3. Roy DK, Berry JL, Pye SR, Adam JE, Swarbrick CM, et al. (2007) Vitamin D status and bone mass in UK South Asian women. Bone 40: 200-204.
4. Harinarayan CV (2005) Prevalence of vitamin D insuficiency in postmenopausal
South Indian Women. Osteoporosis Int 16: 397-402.
5. Rahman SA, Chee WS, Yassin Z, Chan SP (2004) Vitamin D status among postmenopausal Malaysian women. Asia Pac J Clin Nutr 13: 255-260.
6. Marwaha RK, Tandon N, Reddy D, Reddy HK, Aggarwal R, et al.(2005) Vitamin D and bone mineral density status of healthy schoolchildren in Northern India. Am J Clin Nutr 82: 477-482.
7. Lips P (2001) Vitamin D deiciency and secondary hyperparathyroidism in the
elderly: consequences for bone loss and fractures and therapeutic implications. Endocr Rev 22: 477-501.
8. Siddiqui TS, Rai MI (2005) Presentation and predisposing factors of nutritional rickets in children of Hazara division. J Ayub Med Coll Abbottabad17: 29-32.
9. Ogunkulade WB, Boucher BC, Bustin SA, Burrin JM, Noorian K, et al. (2006)
Vitamin D metabolism inperipheral blood mononuclear cells is inluenced by
chewing “betel nut” (Areca catechu) in vitamin D status. J Clin Endocr Metab 91: 2612-2617.
10. Masood SH, Iqbal MP (2008) Prevalence of vitamin D deiciency in South Asia. Pak J Med Sci 24: 891-897.
11. Holick MF (2006) high prevalence of vitamin D inadequacy and implication for health. Mayo Clin Proc 81: 353-373.
12. WHO-WPRO (2000) The Asia-Paciic perspective: Redeining obesity and its
intervention. pp 22. Health Communications Australia Pte. Limited.
13. Wortsman J, Matsuoka LY, Chen TC, Lu Z, Holick MF (2000) Decreased bioavailability of vitamin D in obesity. Am J Clin Nutr 72: 690-693.
14. Tangpricha V, Pearce EN, Chen TC, Holick MF (2002) Vitamin D insuficiency among free-living healthy young adults. Am J Med 112: 659-662.
15. Forrest KYZ, Stuhldreher WL (2011) Prevalence and correlates of vitamin D
deiciency in US adults. Nutr Res 31: 48-54.
16. Al-Daghri NM, Al-Attas O, Alokail MS, Alkharfy KM, Draz HM, et al. (2012) Vitamin D receptor gene polymorphism and HLA DRB1*04 cosegregation in Saudi type 2 diabetes patient. J of Immunol 188: 1325-1332.
17. Vupputuri MR, Goswami R, Gupta N, Ray D, Tandon N, et al. (2006) Prevalence
and functional signiicance of 25-hydroxyvitamin D deiciency and vitamin D
receptor gene polymorphisms in Asian Indians. Am J Clin Nutr 83: 1411-1419.
18. Uitterlinden AG, Fang Y, van Meurs JB, van Leeuwen, Pols HA (2004) Vitamin D receptor gene polymorphism in relation to vitamin D related disease states. J Steroid Biochem Mol Biol 89-90: 187-193.
19. Almasan A, Mangelsdorf DJ, Ong ES, Wahl GM, Evans RM (1994) Chromosomal localization of the human retinoid X receptors. Genomics 20: 397-403.
20. Miyamoto KI, Keestrerson RA, Yamamoto H, Taketani Y, Nishiswaki E, et al. (1997) Structural Organization of the Human Vitamin D Receptor Chromosomal Gene and Its Promoter. Mol Endocrinol 11: 1165-1179.
21. Baecke JA, Burema J, dan Frijters JE (1982) A short questionnaire for the measurement of habitual physical activity in epidemiology studies. Am J Clin Nutr 36: 936-942.
22. Grant WB, Holick MF (2005) Beneit and requirement of vitamin D for optimal health: A review. Altern Med Rev 10: 94-111.
23. www.indonesia.com/whether_of_Indonesia.html
24. World Atlas (2012) Explore your world.
25. Holick MF (2005) Vitamin D for health and in chronic kidney disease. Semin Dial 18: 266-275.
26. Engelsen O (2005) Daily duration of vitamin D synthesis in human skin with the relation to latitude, total ozone altitude, ground cover, aerosols, and cloud thickness. Photochem photobiol 81: 1287-1290.
27. Khor GL, Chee WSS, Shariff ZM, Poh BK, Arumugam M, et al. (2011) High
prevalence of vitamin D insuficiency and its association with BMI-for-age
among primary school children in Kuala Lumpur, Malaysia. BMC Public Health 11: 95.
28. Ferrarezi DAF, Bellili-Muñoz N, Nicolau C, Cheurfa N, Guazzelli IC (2012) Allelic variations in the vitamin D receptor gene, insulin secretion and parents’ heights are independently associated with height in obese children and adolescents. Metab Clin Exp 20: 1-9.
29. Liel Y, Ulmer E, Shary J, Hollis BW, Bell NH (1998) Low circulating vitamin D in obesity. Calcif Tissue Int 43: 199-201.
30. Bell NH, Epstein S, Greene A, Shary J, Oexmann MJ, et al. (1985) Evidence of alteration of the vitamin D-endocrine system in obese subjects. J Clin Invest 76: 370-373.
31. Brock K, Graubard B, Fraser DR, Weinstein SJ, Stolzenberg-Solomon RZ, et al. (2010) Predictors of vitamin D biochemical status in a large sample of middle-aged male smokers from Finland. Eur J Clin Nutr 64: 280-288.
32. Bikle DD (2010) Vitamin D: newly discovered actions require reconsideration of physiologic requirements. Trends in Endoc and Metab 638: 1-10.
33. Holick MF (2008) The vitamin D deiciency pandemic and consequences for nonskletal health: Mechanisms of action. Mol Asp of Med 29: 361-368.
34. Bikle DD (2009) Extra renal synthesis of 1, 25-dihydroxyvitamin D and its health implications. Clin Rev in Bone and Min Metab 7: 114-125.
35. Walters MR (1992) Newly Identiied Actions of the Vitamin D Endocrine System. Endoc Rev 13: 719-764.
36. Baker AR, McDonnell DP, Hughes M, Crips TM, Mangelsdorf DJ, et al. (1988) Cloning and Expression of Full-Length cDNA Encoding Human Vitamin D Receptor. Proc Natl Acad Sci USA 85: 3294-3298.
37. Kerner SA, Scott RA, Pike JW (1989) Sequence elements in the human osteocalcin gene confer basal activation and inducible response to hormonal vitamin D3. Proc Natl Acad Sci USA 86: 4455-4459.
38. Jain R (2010) When too much sun is never enough: Association of VDR gene polimorphism with insulin resitancy. Thesis. Aucland University of Technology.
39. Ogunkolade BW, Boucher BJ, Prahl JM, Bustin SA, Burrin JM, et al. (2002) Vitamin D receptor (VDR) mRNA and VDR protein levels in relation to vitamin D status, insulin secretory capacity, and VDR genotype in Bangladeshi Asians. Diabetes 51: 2294-2300.
Citation: : Sari DK, Damanik HA, Lipoeto NI, Lubis Z (2013) Is Micro Evolution in Tropical Country Women Resulting Low 25(OH)D Level?: A Cross Sectional Study in Indonesia. J Nutr Food Sci 4: 246. doi: 10.4172/2155-9600.1000246
Submit your next manuscript and get advantages of OMICS Group submissions
Unique features:
• User friendly/feasible website-translation of your paper to 50 world’s leading languages • Audio Version of published paper
• Digital articles to share and explore
Special features:
• 300 Open Access Journals • 25,000 editorial team • 21 days rapid review process
• Quality and quick editorial, review and publication processing
• Indexing at PubMed (partial), Scopus, EBSCO, Index Copernicus and Google Scholar etc • Sharing Option: Social Networking Enabled
• Authors, Reviewers and Editors rewarded with online Scientiic Credits
• Better discount for your subsequent articles