DESIGN AND VIBRATIONAL ANALYSIS OF ELECTRIC POWER
GENERATOR
MUHAMMAD HUDZAIFAH BIN ABDUL HABIB
i
SUPERVISOR DECLARATION
“I hereby declare that I have read this thesis and in my opinion this report is sufficient in terms of scope and quality for the award of the degree of Bachelor of Mechanical
Engineering (Automotive)”
Signature : …..………...
Supervisor : DR. MOHD AZMAN BIN ABDULLAH
ii
DESIGN AND VIBRATIONAL ANALYSIS OF ELECTRIC POWER
GENERATOR
MUHAMMAD HUDZAIFAH BIN ABDUL HABIB
This thesis is submitted in partial fulfillment of the requirements for the Bachelor
of Mechanical Engineering (Automotive)
Faculty of Mechanical Engineering
Universiti Teknikal Malaysia Melaka
iii
DECLARATION
“I hereby declare that the work in this thesis is my own except for summaries and quotations which have been duly acknowledged.”
Signature : ……….
Author : MUHAMMAD HUDZAIFAH BIN ABDUL HABIB
iv
DEDICATION
I dedicate this thesis to my beloved family especially to my father and mother, Dr. Mohd Azman Bin Abdullah, Dr. Md Fahmi Bin Abd Samad @ Mahmood and my
v
ACKNOWLEDGEMENT
First of all, I would like to thank to Allah because I managed to complete the Projek Sarjana Muda 1 (PSM) report successfully. Eventhough, I face several problems but I can solve it calmly. The huge help and support received from many persons who generously advice and assist me while I was doing my project which is compulsory to all Universiti Teknikal Malaysia Melaka (UTeM) students to pass before awarded.
I would like to thanks to my beloved family especially my mother who always give me much motivation and never stop prayed for my success in study. They are the root for my strength.
I owe a debt of thanks to all those time, concern and efforts were given during the process of completing this report. Thus, our heartfelt gratitude is extended my beloved supervisor Dr, Mohd Azman bin Abdullah for giving the support morally and physically, never stops giving guidance and also shared his expertise and knowledge with me.
vi ABSTRACT
vii ABSTRAK
viii
TABLE OF CONTENT
CHAPTER TITLE PAGE
SUPERVISOR DECLARATION i
DECLARATION iii
ACKNOWLEDGEMENT v
ABSTRACT vi
ABSTRAK vii
TABLE OF CONTENTS viii
LIST OF TABLES xii
LIST OF FIGURES xiv
LIST OF SYMBOLS
LIST OF ABBREVIATIONS
xvi xvii
CHAPTER 1 INTRODUCTION 1
1.1 Background 1
1.2 Problem Statement 1
1.3 Objectives 3
ix
CHAPTER 2 LITERATURE REVIEW 4
2.1 Introduction 4
2.2 Tachometer 4
2.3 Power Monitor 5
2.4 Motor Starter 6
2.5 Automotive Battery 7
2.6 LEGO Mindstorm EV3 10
2.7 Power Generator 12
2.7.1 Background 2.7.2 History
2.7.3 Parts of Power Generator
12 13 16
CHAPTER 3 METHODOLOGY 17
3.1 Introduction 17
3.2 Gantt Chart 17
3.3 Flow Chart of The Project 18
3.4 The Selection of Design Concept 20
3.5 Design 20
3.5.1 The First Design 3.5.2 The Second Design 3.5.3 The Third Design
21 22 23
x 3.6.1 Stainless Steel 3.6.2 Mild Steel 3.6.3 Cast Iron
24 24 25
3.7 Decision Matrix 25
CHAPTER 4 RESULTS AND DISCUSSION 32
4.1 Introduction 32
4.2 Data from Tachometer 32
4.3 Collecting Data by using Ammeter 34
4.4 Collecting Data by using Power Monitor 36 4.5 Analysis Data and Results of Data Acquisition (DAQ)
4.5.1 Analysis Graph for Pitch, Yaw and Roll motion 4.5.2 Analysis Graph for Ax, Ayand Az acceleration
38 40 48 4.6 Force Analysis by using CATIA software 55
4.6.1 Von Misses Stress 56
4.6.2 Displacement 57
CHAPTER 5 CONCLUSION AND RECOMMENDATIONS 58
5.1 Conclusion 58
xi
REFERENCES 60
APPENDIX A 63
APPENDIX B 64
xii
LIST OF TABLES
NO. TITLE PAGE
2.1 The Name Parts of Automotive Battery and Its Function 9
3.1 Dimension of The First Design 21
3.2 Dimension of The Second Design 22
3.3 3.4 3.5
Dimension of The Third Design Properties of The Stainless Steel Properties of The Mild Steel
23 24 24
3.6 Properties of The Cast Iron 25
3.7 The Comparison of Properties between Three Types of Material
26
3.8 Weighted Decision Matrix 28
3.9 The Score, Rating and Ranking of The Designs 29 3.10 Evaluation Scheme for Design Alternative or Objectives 31 4.1 Results for RPM of Generator on without load and with load
by using Tachometer
33
4.2 Results for Minimum and Maximum RPM of Motor Starter by using Tachometer
34
xiii
4.5 The Percentage Difference between without load and apply load
46
4.5 The Pitch, Yaw and Roll on without load and with load for Angular Velocity and Frequency
47
4.6 The Acceleration Ax, Ay and Az for upper and lower peak
average against without and with load
xiv
LIST OF FIGURES
NO. TITLE PAGE
2.1 The Tachometer 5
2.2 The Power Monitor 6
2.3 The Motor Starter 7
2.4 The Automotive Battery 8
2.5 The Intelligent Brik EV3 10
2.6 2.7
The Accelerometer and Gyro sensor The Flow of the Data Acquisition (DAQ)
11 12
2.8 Single Phase Portable Power Generator 13
2.9 3.1 3.2 3.3 3.4 3.5
Parts of Power Generator Flow Chart of The Project The First Design
The Second Design The Third Design Weighting Factor 16 19 21 22 23 27
4.1 The Tachometer is measured RPM 33
xv
4.3 The Connecting Wire between Ammeter, Motor Starter and Automotive Battery
35
4.4 Power Monitor 36
4.5 The Petrol Generator EUROPOWER 38
4.6 Location of DAQ and gyro, pitch, yaw and roll axis 39 4.7 4.8 4.9 4.10 4.11 4.12
The graph of pitch against time with zero load The graph of pitch against time with load The graph of roll against time with zero load The graph of roll against time with load The graph of yaw against time with zero load The graph of yaw against time with load
40 41 42 43 44 45 4.13 4.14 4.15 4.16 4.17 4.18
The graph of Ax against time with zero load
The graph of Ax against time with load
The graph of Ay against time with zero load
The graph of Ay against time with load
The graph of Az against time with zero load
The graph of Azagainst time with load
48 49 50 51 52 53 4.19 The Product for Frame and Mounting Generator by CATIA
software
55
4.20 Von Misses Stress Analysis 56
xvi
LIST OF SYMBOLS
A = surface area
Ax = horizontal acceleration
Ay = vertical acceleration
Az = acceleration at z-axis
v = velocity
P = pressure
cm = centimeter
T = temperature
p = density
cp = specific heat
k = thermal conductivity
µ = viscosity
xvii
LIST OF ABBREVIATIONS
FYP Final Year Project
PSM Projek Sarjana Muda
CAD Computer-aided Design
DAQ Data Acquisition System
1 CHAPTER 1
INTRODUCTION
1.1 BACKGROUND
This chapter will cover on the problem statement, objective of the project and project scope. Furthermore, the information of the project will be stated clearly to enhance the understanding as a method to achieve the project goal.
1.2 PROBLEM STATEMENT
2
fossil fuel such as petrol or diesel is affected and not good for environment. Internal combustion engine that in system of the generator must be changed and develop to overcome the problem of earth’s environment. These generators produce power independently, but the smoke emission and noise pollution are still the main issues for green environment effects. Moreover, these generators are using fossil fuel which is not sustainable.
In addition, while the overall death rate from unintentional carbon monoxide (CO) poisoning has decreased in the United States due to improved automobile emissions controls and a decline in CO poisoning from motor vehicles, exposures have not changed from some sources of CO. One of these is the operation of portable electrical generators in poorly ventilated spaces. This study sought to describe the population poisoned from CO produced by portable electric generators, and to determine the reasons that generators are operated in a hazardous fashion.
3
1.3 OBJECTIVES
The objective of this project is to study the vibration and its concept. Then, the objective is to design and sketch CAD model. Besides that, the electric power generator need to analyze the mounting design.
1.4 SCOPES
4 CHAPTER 2
LITERATURE REVIEW
2.1 INTRODUCTION
This chapter includes an overview of the project consists of a description of introduction about the devices are uses in the project where are tachometer, power monitor, motor starter, automotive battery, Lego Mindstorm EV3, accelerometer and power generator.
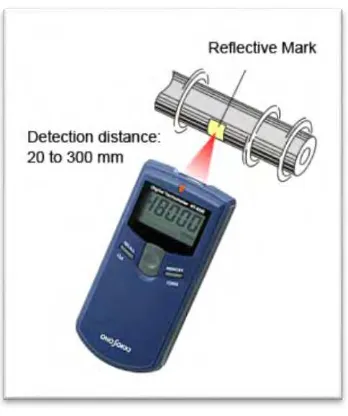
2.2 TACHOMETER
5
[image:23.612.241.415.150.358.2]multiple marks are fixed to the target of measurement object, the measurement can be performed at a lower speed.
Figure 2.1 : The Tachometer
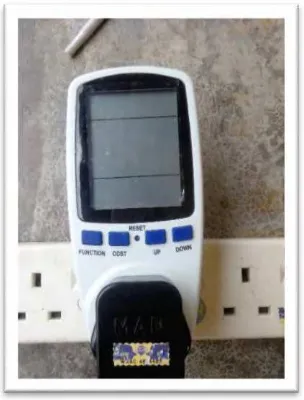
2.3 POWER MONITOR
The Figure 2.2 is a device that will help people to understand the consumption of
electricity in a house. The power monitor can be used and measured on any devices with an electrical, but it is only intended to measure 120V loads for standard household loads. It also can be used to understand how much electrical appliances cost under two different rate structures which are flat rate and Time of Use (TOU). Moreover, it can be used to compare how much appliances would cost to operate under one’s current usage patterns versus how much users would cost to operate under different usage patterns.
6
[image:24.612.252.404.165.365.2]usage a device over time. In power monitor, various data and results can be collected by install the device on any plug of the electrical appliances. Basically, the results can be collect such as voltage (V), current (A), low and high power (W), power per hour (kW/h), frequency (f) and power factor.