DOI: 10.12928/TELKOMNIKA.v14i1.2395 707
Fuzzy-based Spectral Alignment for Correcting DNA
Sequence from Next Generation Sequencer
Kana Saputra S1, Agus Buono2, Wisnu Ananta Kusuma*3
1,2,3
Department of Computer Science, Bogor Agricultural University
1,3Bioinformatics Research Group, Bogor Agricultural University,
Jl. Meranti, Wing 20 Level 5, Darmaga, Bogor 16680 Telp./Fax.: +62-251-8625584
*Corresponding author e-mail: [email protected]
Abstract
Next generation sequencing technology is able to generate short read in large numbers and in a relatively short time in single running programs. The graph based DNA sequence assembly, that is used to handle these big data in assembly step, is very sensitive to DNA sequencing errors. This problem can be solved by performing an error correction step before the assembly process. This research proposed fuzzy inference system based spectral alignment method which can detect and correct DNA sequencing errors. The spectral alignment method was implemented as a pre-processing step before the DNA sequence assembly process. The evaluation was conducted using Velvet assembler. the total nodes yielded by the Velvet assembler become a measure of the success of error correction. The results showed that the based spectral alignment method generated small total nodes for k = 53. It was concluded that the fuzzy-based spectral alignment method is successfully able to detect and correct DNA sequencing errors.
Keywords: DNA Sequencing Errors, Fuzzy Inference System Model, Next Generation Sequencing, Spectral Alignment Method
Copyright © 2016 Universitas Ahmad Dahlan. All rights reserved.
1. Introduction
In the Biology and Health science, deoxyribonucleic acid (DNA), a very important macromolecule, has a function to store all of information about the genetic of creatures. Sequencing process is required to determine DNA sequences. This process produces DNA sequence which is required to find gen, area that has specific protein code, and to compare homologous DNA sequences among different organisms [1]. Nowadays, sequencing process has been applied into varieties sample of tumor as an effort to identify mutations associated with cancer [2].
Sequencing technology has been continuously evolved from traditional Sanger Shotgun sequencing to next generation sequencing (NGS) such as Illumina Genome Analyzer (Solexa), ABI SOLiD System, 454 Genome Sequencer FLX, and Helicos Heliscope [3]. Eventough, NGS as a high throughput and fast sequencer is better than traditional Sanger Shoutgun sequencing, NGS still produces DNA sequencing errors. There are several types of errors generated by the sequencer, i.e. substitution, insertion and deletion [4]. The results of sequencing reads by Ilumina, one of the most famous NGS technologies and commonly used to produce 35 bp – 125 bp reads, are still containing 0.5 to 2.5% sequencing errors. Almost all of them are substitution errors [5]. The existence of substitution errors tends to generate more branches in the graph. Consequently, the numbers of nodes are increased. The increasing of nodes will make the graph in the DNA sequence assembly process become more complex [6]. Therefore, error correction is required to improve the quality of DNA produced by NGS [7] and reduce the complexity of the graph.
sequencing errors correction based on quality score has been also developed, for instance RECOUNT, a software for detecting and correcting sequencing errors which was developed based on base quality score (Phred score) and using expectation maximization algorithm (EM) and statistic model [10].
Deciding which tuples are included into solid tuples or weak tuples is not enough by using only multiplicity because sometimes tuples that have low qualities can be classified as solid tuples. Thus, in this research, we combined the parameter of multiplicity and base quality score of each reads to handle the problem of correcting sequencing errors. In this study, we proposed to represent the multiplicity and the base quality score in term of fuzzy. The fuzzy approaches were actually has been proven successful in solving the problem in the real world, such as integrating production capability and load balancing during scheduling activity [11], classify likelihoods of purchasing health insurance [12], predict the cases of Failed Back Surgery Syndrome (FBSS) [13], classify and analyze Microarray Gene data by using data mining and fuzzy logic [14], analyze the relationships between genes and help decipher a genetic network [15], building lighting system based on fuzzy logic scheme to automate fluorescent lamps in order to achieve illumination according to Indonesian National Standard (SNI) [16], and handle ambiguity perceived symptoms the patient and the certainty factor method to handle the relationship between the symptoms of the disease [17].
The aim of this research is to apply and obtain fuzzy inference system model in order to detect and correct the DNA sequencing errors by using the spectral alignment method as a preprocessing step before conducting DNA assembly process. The evaluation was conducted by using the Velvet assembler for showing the decreasing of the total nodes after implementing a correction step.
2. Research Method 2.1. Datasets
The dataset was obtained from Hobbes Genome Sequence Mapping [18]. These dataset was represented in FASTQ format. In the FASTQ format, we could have the information of reads and the base quality score of each nucleotide in reads [19]. Table 1 described the characteristics of the dataset.
Table 1. The characteristics of data set
Organism Number of reads Mean
Caenorhabdities Elegans (WormBase WS201) 1,000,000 100 bp
Human Genome (HG18) 1,000,000 100 bp
These reads actually were generated from Illumina sequencer. Reads produced by Illumina have sequencing errors and other symbols besides Adenine (A), Cytosine (C), Guanine (G) and Thymine (T), namely N. N is a symbol stating the incapability of NGS in reading certain bases [7]. This research was also focused only on substitution error.
2.2. Spectral Alignment Method
This research focused on the pre-processing step of the DNA sequences. Fuzzy based spectral alignment method is a method for detecting and correcting DNA sequencing errors. The research improved the spectral alignment method that was performed in 2001 [8] by including base quality score. The first step of the spectral alignment method is to determine the multiplicity. After the multiplicity is obtained, tuples were classified into solid tuples and weak tuples. Tuple is a subsequence of read that have a certain length. For instance, supposed we have read = {ACGACGACCGAT}. Thus, a set of tuples with the length of 5 are ACGAC, CGACG, GACGA, CGACC, GACCG, ACCGA, and CCGAT. This research used 5 length tuple [9].
tuples members using Levenshtein distance. The string matching process was done to replace the weak tuple with the solid tuple which had the nearest similarity score. This process was repeated for each reads. In this research, we improved the spectral alignment method by employing fuzzy concept to represent tuple quality. Steps of our proposed method using fuzzy-based spectral alignment method could be described as follows.
2.3. Fuzzy-based Spectral Alignment
2.3.1. Determining Multiplicity and Tuple Quality
In this research, we used two parameters from a tuple, ie multiplicity and tuple quality. We used FASTQ format data that represent base quality score using the American Standard Code for Information Interchange (ASCII). The quality score can be obtained by converting the ASCII value in the FASTQ file into Phred score. Base quality score is used to calculate tuple quality. Tuple quality is the sum of base quality score divided by the number of bases. In addition, multiplicity is the number of tuple occurrence in certain length in every read. If the same tuple appears twice or more in the same read, it will be count as one. The quality of tuple is the total number of base quality scores that is divided by the number of bases.
The multiplicity and quality score should be normalized since the range values were too big. The formula of normalization used is linear scaling normalization or it is usually called max-min [20]. The multiplicity and tuple quality would be calculated for every reads. Normalization data calculated using Equation (1) as follow:
(1)
2.3.2. Determining Solid Tuple and Weak Tuple
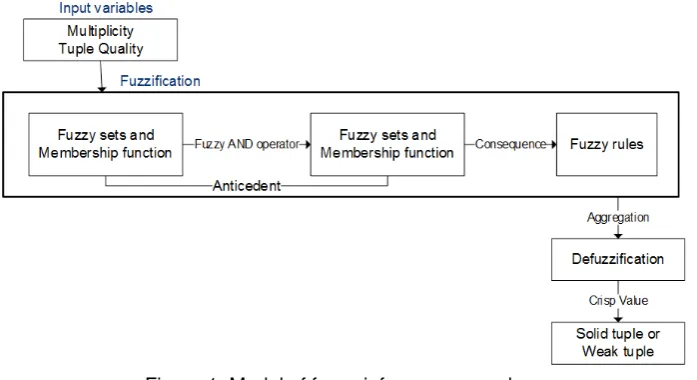
In the proposed method, we modified the spectral alignment method by employing fuzzy inference system. In this research, we used Mamdani inference [21] which allows a system to take in a set of crisp input values and apply a set of fuzzy rules to those values, in order to derive a single, crisp, output value. The following steps are executed to classify tuples into solid or weak tuple.
Figure 1. Model of fuzzy inference procedure
Step 1: Defining input and output.
The multiplicity and quality score become the input of this Mamdani inference. Moreover, the output of the system is a decision of the classification of tuples.
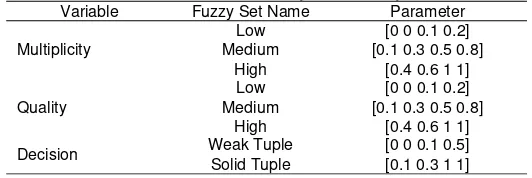
Step 2: Defining fuzzy sets for system variables.
Table 2. The characteristics of fuzzy sets for system variables Variable Fuzzy Set Name Parameter
Multiplicity
Table 2 presents the parameter of each fuzzy set name. Input variables have equal parameter. The parameter affects the output fuzzy. It shows that a tuple can be classified into weak or solid tuple.
Step 3: Defining fuzzy rules.
The next step is defining the If-Then rules to describe system behavior. The rules are designed as to describe the importance of the variables on decision. At this step, multiplicity and quality score from tuples become inputs into the system. Based on the expert knowledge, this study expresses the problem in terms of logical rules. The rules combination can be seen in Table 3.
Table 3. The combination of rules
Code Rules
[R1] IF Quality is low AND Multiplicity is low THEN Weak Tuples [R2] IF Quality is low AND Multiplicity is medium THEN Weak Tuples [R3] IF Quality is low AND Multiplicity is high THEN Solid Tuples [R4] IF Quality is medium AND Multiplicity is low THEN Weak Tuples [R5] IF Quality is medium AND Multiplicity is medium THEN Weak Tuples [R6] IF Quality is medium AND Multiplicity is high THEN Solid Tuples [R7] IF Quality is high AND Multiplicity is low THEN Solid Tuples [R8] IF Quality is high AND Multiplicity is medium THEN Solid Tuples [R9] IF Quality is high AND Multiplicity is high THEN Solid Tuples
The proportional rules for FIS model is the number of input to the power of the number of membership functions [22]. Therefore, this research was used nine rules obtained from three membership functions to the power of two input variables. These rules were the result of experimentation because it is still not yet found the information about multiplicity and tuple quality.
Step 4: Defuzzification process.
Finally defuzification step is needed to convert all input data into three linguistic terms that can be used to classify tuples. The defuzzification process transforms the fuzzy set into a crisp value, a more meaningful representation.
Multiplicity and tuple quality will be processed using fuzzy inference system model. After that process, each tuple have one value from 0 to 1. The value will determine whether the tuple is classified into weak tuple or solid tuple, so we have to determine limit of the tuple value.
2.2.3. Error Correction
assembler referring to set of error-free reads (error correction) together with set of error reads (without error correction).
2.3. Evaluation
To evaluate the effectiveness of the error correction, we compare the results of assembling error-free reads (error correction) and error reads (without error correction). The dataset was used as the input for Velvet assembler. Velvet assembler is a software consisting of algorithms to manipulate De Bruijn graph in doing DNA sequence assembly [24]. This step was required to evaluate the performance of the error correction process. The parameter of the error correction process in this research is the total nodes and execution time of the graph produced. Error reads (without error correction) would tend to produce a more complex graph than that of produced by error-free reads (error correction). This would be used to evaluate whether the error correction process was performed properly.
The total nodes could be calculated from PreGraph file. PreGraph file is Velvet assembler output. There are two files corresponding to graph generated by Velvet assembler. The two files named “PreGraph” and “LastGraph”. Both files contain a list of nodes representing De Bruijn graph by Velvet. In this research only the “PreGraph” would be considered, because the graph represented in “LastGraph” is the final output of Velvet yielded by Velvet’s error removal techniques and graph simplification. The graph represented in “PreGraph” has not processed by Velvet’s error removal techniques and graph simplification. So, it can be used a measure to indicate the success of our DNA sequencing errors correction method. Velvet execution using two commands, namely “velveth” and “velvetg”. “velveth” is command to construct the dataset and “velvetg” is command builds the de Bruijn graph from k-mers obtained from “velveth”. The execution time is calculated by sum of the execution time for “velveth” and “velvetg”.
3. Results and Analysis
3.1. Implementation of Fuzzy-based Spectral Alignment Method
Fuzzy inference system model has perfomed several experiments. The experiments were conducted by changing the parameters of each variable and the membership function. After the calculation of the total nodes only these parameter are suitable for being used in this case. The parameter can classify a tuple into a solid tuple or weak tuple. For the membership function, it has been conducted experiments using sigmoid and trapezoid. The results show that trapezoid is more suitable. It can be seen from the results of the calculation of the total nodes and Velvet execution time.
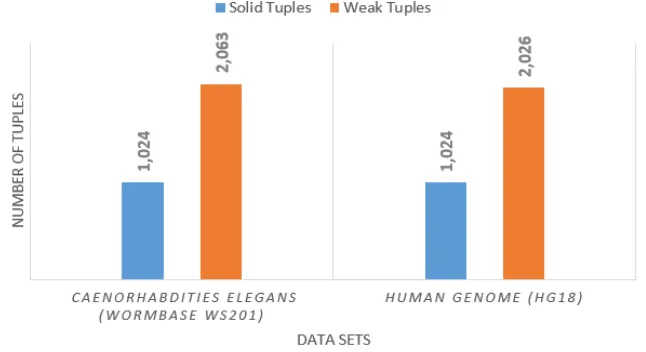
A tuple with fuzzy value of more than 0.4 was classified as a solid tuple; otherwise will be classified as a weak tuple. The number of solid tuples and weak tuples can be seen in Figure 2.
Figure 2 presents the total tuples classified into solid tuples and weak tuples. Weak tuples are more dominant than solid tuples. It shows that fuzzy inference system model detect more error tuples.
3.2. Evaluation
The effectiveness of the proposed method was evaluated using Velvet assembler. For each organism, there would be a pair of file, error reads (without error correction) and containing corrected reads by fuzzy based spectral alignment method. These two pairs of dataset of two organisms were stored in four files in FASTA format. The output of Velvet is a de Bruijn graph constructed from DNA sequences reads.
In the graph construction process, as a part of DNA sequence assembly, either reads containing sequencing error or error-free reads could affect the complexity of graph. Sequencing errors in reads could lead to produce unnecessary branches in the graph. In this case, the complexity of a graph could be measured by calculating the total nodes in a graph generated in the DNA sequence assembly. Assumed, given AATGC and GCCAG. The first subsequence should be read AATGC, instead because of sequencing error, the subsequence was read as AATAC. Then, the graph produced by reads containing sequencing errors (without error correction) will be more complex compared to those of the error-free reads (with error correction).
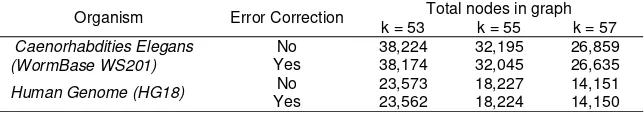
For each DNA sequence assembly process using Velvet, a parameter hash length k must be determined. Hash length is the length of k-mers included in the hash table. The k value must be an odd number and must be smaller than the length of each fragments. In this research, k was set to 53, 55 and 57. The result of DNA sequence assembly process using Velvet for each k values can be seen in Table 4.
Table 4. DNA sequence assembly result using Velvet assembler
Organism Error Correction Total nodes in graph k = 53 k = 55 k = 57
Caenorhabdities Elegans (WormBase WS201)
No 38,224 32,195 26,859
Yes 38,174 32,045 26,635
Human Genome (HG18) No 23,573 18,227 14,151
Yes 23,562 18,224 14,150
Table 4 presents the results generated by Velvet in total nodes produced for each dataset with k = 53, k = 55, and k = 57. It shown that every corrected reads produced fewer total nodes compared to those of error-free reads (without error correction) for every k values. Significant total nodes reduction for data sets was occurred on k= 53. The results shown that the error correction using fuzzy-based spectral alignment method was able to detect and correct DNA sequencing errors and also simplify the constructed graph resulted from DNA sequence assembly step.
De Bruijn graph is particularly suitable for representing the short read overlap relationship. The graph size is determined by the genome size and repeat content of the sequenced sample, and in principle, will not be affected by the high redundancy of deep read coverage [25]. However, sequencing errors can cause de Bruijn graphs to become highly branched and tangled [26]. The branch can be represented by the large of the total nodes. In this research, the success of sequencing errors correction was measured by calculating the total nodes produced by Velvet assembler.
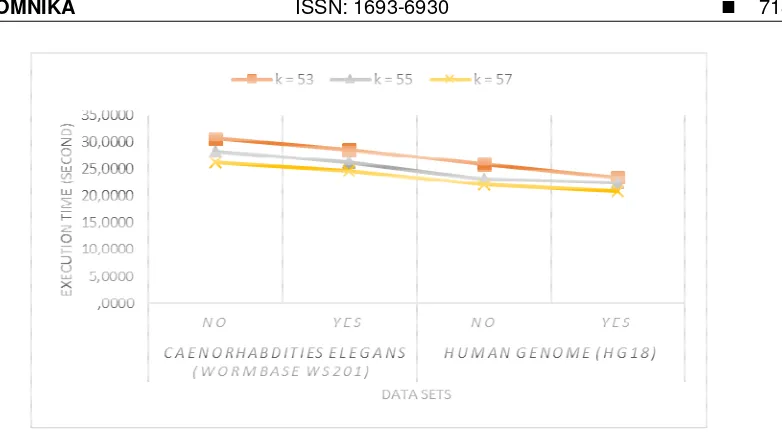
We also calculated the execution time for all k values. The execution time was required to support the information of the graph complexity. The more complex the resulting graph, the more time it takes. The execution time can be seen in Figure 3.
Figure 3. The execution time for uncorrected reads (NO) and corrected reads (YES)
4. Conclusion
The parameter and trapezoid membership function for fuzzy inference system model was suitable for this case. The fuzzy inference system model can classify a tuple into solid tuple or weak tuple. The results showed that the weak tuples were more dominant than solid tuples. The evaluation results using Velvet assembler showed the effectiveness of the proposed method in detecting and correcting sequencing error. The fuzzy-based spectral alignment method can reduce the total nodes of graph using k = 53 and therefore it also successfully reduced the execution time. Thus, it can be concluded that our proposed method can effectively and efficiently detect and correct DNA sequencing errors.
Acknowledgements
The authors would like to give deep gratitude to Ministry of Education and Culture (DIKTI), Republic of Indonesia for funding this research through the BPP-DN.
References
[1] Rogers K. New Thinking about Genetics. New York: Britannica Educational Publishing. 2011: 132. [2] Chong ML, Ku CS, Wu M, Soong R. Characterising Somatic Mutations in Cancer Genome by Means
of Next-generation Sequencing. Chichester: John Wiley & Sons, Ltd. 2012.
[3] Zhao Xiaohong, Palmer LE, Bolanos R, Mircean C, Fasulp D, Wittenberg GM. EDAR: AN Efficient Error Detection and Removal Algorithm for Next Generation Sequencing Data. Journal of Computational Biology. 2010; 17(11): 1549-1560.
[4] Chevreux B. MIRA: An Automated Genome and EST Assembler. German Cancer Research Center Heidelberg, Department of Molecular Biophysics. 2005: 18.
[5] Kelley DR, Michael CS, Steven LS. Quake: Quality-Aware Detection and Correction of Sequencing Errors. Genome Biology. 2010.
[6] Miller JR, Koren S, Sutton G. Assembly Algorithms for Next-Generation Sequencing Data. Genomics. 2010; 95(6): 315–327.
[7] Yang X, Chockalingam SP, Aluru S. A Survey of Error-Correction Methods for Next-Generation Sequencing. Journal of Briefing in Bioinformatics. 2012.
[8] Pevzner PA, Tang H, Waterman MS. An Eulerian Path Approach to DNA Fragment Assembly. Proceedings of the National Academy of Sciences. 2001; 98(17): 9748-9753.
[9] Caesar N, Kusuma WA, Wijaya SH. DNA Sequencing Error Correcting using Spectral Alignment. ICACSIS. 2013: 279-284.
[10] Wijaya E, Frith MC, Suzuki Y, Horton P. RECOUNT: Expectation Maximazation Based Error Correction Tool for Next Generation Sequencing Data. Proceedings Trim. 2009; 17(6).
[11] Othman Z, Subari K, Morad N. Application of Fuzzy Inference Systems and Genetic Algorithm in Integrated Process Planning and Scheduling. International Journal of The Computer, The Internet,
[12] Abdullah L, Rahman MNA. Employee Likelihood of Purchasing Health Insurance using Fuzzy Inference System. International Journal of Computer Science Issues. 2012; 9(2): 112-116.
[13] Qidway U, Shamim MS, Raquib F, Enam A. Failed Back Surgery Syndrome (FBSS) Prediction using
Fuzzy Inference System (FIS). IEEE International Conference on Signal Processing and
Communications (ICSPC). 2007: 880-883.
[14] Bhuvaneswari V, Brintha SJ. Microarray Gene Expression Analysis Using Type 2 Fuzzy Logic (MGA-FL). International Journal of Computer Science. 2012; 2(2): 53-69.
[15] Ressom H, Reynolds R, Varghese RS. Increasing the Efficiency of Fuzzy Logic-based Gene Expression Data Analysis. Physion Genomics. 2003; 13: 107-117.
[16] Panjaitan SD, Hartoyo A. A Lighting Control System in Buildings based on Fuzzy Logic.
TELKOMNIKA. 2011; 9(3): 423-432.
[17] Putra IKGD, Prihatini PM. Fuzzy Expert System for Tropical Infectious Disease by Certainty Factor.
TELKOMNIKA. 2012; 10(4): 825-836.
[18] Hobbes Genome Sequence Mapping Home Page. Available:
http://hobbes.ics.uci.edu/examples.shtml
[19] Cock PJA, Fields CJ, Goto N, Heuer ML, Rice PM. The Sanger FASTQ File Format for Sequences with Quality Scores, and the Solexa/Illumina FASTQ Variants. Nucleic Acids Research. 2009; 38(6): 1767-1771.
[20] Aksoy S, Robert MH. Feature Normalization and Likelihood-based Similarity Measures for Image Retrieval. Elsevier. 2011; 22: 563-582.
[21] Musi IID. Pengembangan Fuzzy Inferensi Sistem Untuk Seleksi Metode Peningkatan Perolehan Minyak Tingkat Lanjut. Thesis. Institut Pertanian Bogor; 2009.
[22] Tang K, Tokinaga S. Optimization of Fuzzy Inference System Rules by Using the Genetic Algorithm and Its Application to the Bond Rating. Journal of the Operations Research Society of Japan. 1999; 42(3): 302-315.
[23] Levenshtein VI. Binary Codes Capable of Correcting Deletions, Insertions and Reversals. Soviet Physics Doklady. 1966; 10(8): 707.
[24] Zerbino DR, Birney E. Velvet: Algorithms for De Novo Short Read Assembly using De Bruijn Graphs.
Genome Research. 2008.
[25] Li Ruiqiang, Zhu Hongmei, Ruan Jue, Qian Wubin, Fang Xiaodong, Shi Zhongbin, Li Yingrui, Li Shengting, Shan Gao, Kristiansen K, Li Songgang, Yang Huanming, Wang Jian, Wang Jun. De Novo Assembly of Human Genomes with Massively Parallel Short Read Sequencing. Genome Research. 2010; 20: 265-272.