THE SEGMENTATION OF GARUDA FREQUENT FLYER
DEVI FITRI YANI
DEPARTMENT OF STATISTICS
FACULTY OF MATHEMATICS AND NATURAL SCIENCES BOGOR AGRICULTURAL UNIVERSITY
PERNYATAAN MENGENAI SKRIPSI DAN
SUMBER INFORMASI SERTA PELIMPAHAN HAK CIPTA*
Dengan ini saya menyatakan bahwa skripsi berjudul The Segmentation of Garuda Frequent Flyer adalah benar karya saya dengan arahan dari komisi pembimbing dan belum diajukan dalam bentuk apa pun kepada perguruan tinggi mana pun. Sumber informasi yang berasal atau dikutip dari karya yang diterbitkan maupun tidak diterbitkan dari penulis lain telah disebutkan dalam teks dan dicantumkan dalam Daftar Pustaka di bagian akhir disertasi ini.
Dengan ini saya melimpahkan hak cipta dari karya tulis saya kepada Institut Pertanian Bogor.
Bogor, Juli 2013
Devi Fitri Yani
ABSTRACT
DEVI FITRI YANI. The Segmentation of Garuda Frequent Flyer. Advised by ASEP SAEFUDDIN dan ENNY KRISTIANI.
Airline loyalty program such as frequent flyer program, is a marketing strategy used by airline industries to maximize their profit and to satisfy their loyal customers. Garuda Frequent Flyer is a program presented by Garuda Indonesia as an appreciation to their loyal customers. The model is created to segment customers based on key airline industry drivers such as yield, frequency, product, distance and activity pattern. RFM analysis is used to score individuals based on Recency, Frequency and Monetary using Principal Component Analysis. This score is used to segment customers using k-means algorithm to interpret Garuda Frequent Flyer member purchasing behavior which is important for marketing strategy.
Scientific Paper
to complete the requirement for graduation of Bachelor Degree in Statistics
at
Department of Statistics
THE SEGMENTATION OF GARUDA FREQUENT FLYER
DEVI FITRI YANI
DEPARTMENT OF STATISTICS
FACULTY OF MATHEMATICS AND NATURAL SCIENCES BOGOR AGRICULTURAL UNIVERSITY
Title : The Segmentation of Garuda Frequent Flyer Name : Devi Fitri Yani
NIM : G14090107
Approved by
Prof Dr Ir Asep Saefuddin, MSc Advisor I
Ir Enny Kristiani, MSc Advisor II
Acknowledged by
Dr Ir Hari Wijayanto, MS Head of Department
ACKNOWLEDGEMENTS
Alhamdulillah wa Syukurillah, many thanks to Allah subhanahu wa ta’ala for the strength opportunity that I can finish my research with the title The Segmentation of Garuda Frequent Flyer.
I realize the completion of this research will not happen without the support from many people. I would like to express my sincere gratitude to my advisors, Prof Asep Saefuddin for his advices and helpful guidance and Ir Enny Kristiani, MSc for her warm suggestions and comments from airline industry point of view.
Thank you for all my friends who have continuously supported me during this research and paper writing. I can not mention one by one and also for both of my parents who always give support that I keep on fighting to finish research.
Finally I hope this research can be useful for many people.
Bogor, July 2013
CONTENT
LIST OF TABLE vi
LIST OF FIGURE vi
LIST OF APPENDIX vi
INTRODUCTION 1
Background 1
Objectives 2
METHODOLOGY 3
Data Sources 3
Methods 3
RESULT AND DISCUSSION 5
Data Exploration 5
RFM Analysis 6
Garuda Frequent Flyer Segmentation 10
CONCLUSION AND RECOMMENDATION 13
Conclusion 13
Recommendation 13
REFERENCES 14
APPENDIX 13
LIST OF TABLE
1 Data type and source 3
2 Average transaction amount of Garuda Frequent Flyer 6
3 Indicator variables for RFM 7
4 Recency score 8
5 Pearson correlation among Recency, Frequency and Monetary 8
6 Garuda Frequent Flyer RFM score 9
LIST OF FIGURE
1 The percentage of Garuda Frequent Flyer based on tier 6
2 The age distribution of Garuda Frequent Flyer 7
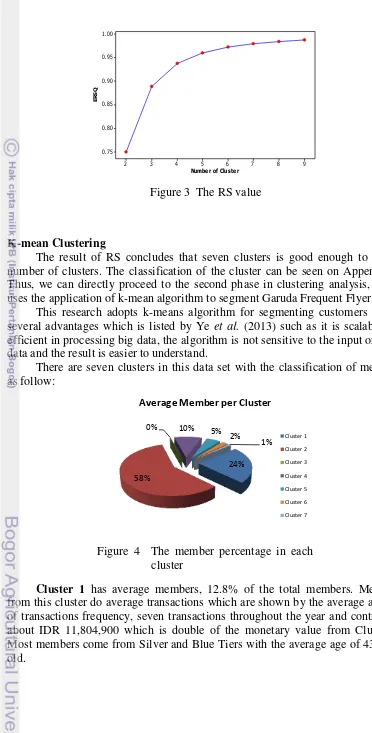
3 The RS value 9
4 The member percentage in each cluster 11
LIST OF APPENDIX
1 Principal component analysis results for RFM score 15
2 Weighted Variable for RFM Score 16
3 Cluster classification using PROC CANDISC 17
4 Cluster centroids 18
INTRODUCTION
Background
Since geographical boundaries are no longer considered as restriction for many people to do business or pleasure, the profit from airline industry nowadays has been massively increased. The growth in air traffic is accelerated by the falling price of air transport and an increase in economic activities. Falling airfares and rising personal incomes have also led to an increase in the demand for leisure trips. Globalization, accelerated economic growth, liberalization of trade and the natural growth of population have had positive impacts on the demand for business travel (Chin 2002).
This situation leads every airline industry to compete each other to attract most passengers in order to use services they are offering. Because most competitors operate more or less technology platform and offer almost similar services, players within airline industries have to battle to present the best services and offerings to their passengers. To win this competition airline needs to work
harder to gain their customer‟s loyalty by offering them the best deals to stay with single airline rather than travel with many airlines. Bolton (2000) stated that naturally companies that offer loyalty reward programs believe that their programs have long-run positive effect on customer evaluations and behavior.
In appreciation of its valued loyal customers, Garuda Indonesia undertakes a frequent flyer program, known as the Garuda Frequent Flyer (GFF). Frequent flyer programs are initially devised by airlines to encourage customers who travel frequently – mainly as a result of increasing switching costs to the competitors. Such strategy is based on rewarding schemes by offering their members upgrades from tourist class to business or first class, free flight tickets or other advantages in check-ins, priority on the waiting lists of overbooked flights, extra baggage allowances or business lounges. These benefits are obtained by converting a
certain number of „air miles‟ which are accrued each time the member flies
(Martin et al. 2011).
FFPs are designed to ensure customer loyalty by offering various forms of bonuses to customers for whom the customers save up each time they fly. It is not something new that airlines industry gains significant profit from FFPs. Dreze and Nunes (2004) stated that the frequent flyer miles represent one of the world‟s most popular currencies, with 100 million people collecting the 500 billion miles that 130 airlines distribute annually. The US loyalty marketing industry, a $6 billion market, contains more than 2,000 loyalty programs, and 90% of Americans in at least one loyalty program (Berman, 2006).
2
Customer segmentation gives quantifiable way to analyze the customer data and distinguish the customers based on their purchase behavior. In this way the customers can be segmented into different groups for which the company can employ targeted marketing and thus retain the customers. Once the customers are segmented, rules can be generated to describe the customers in each group based on their purchase behavior.
RFM method is very effective for customer segmentation. R means recency which indicates the time interval between the present and previous transaction date of a customer. F means frequency which indicates the number of transactions that the customer has done in a particular interval of time. M means monetary which indicates the total value of the customer‟s transaction amount. It has been proven that the value of R, F and M decides the characteristics of the customer behavior.
Segmentation based on RFM has been used for over 50 years by direct marketers to target a subset of their customers. RFM analysis is commonly performed using the Arthur Hughes method, which bins each of the three RFM attributes independently into five equal frequency bins. The resulting 125 cells are depicted in a tabular format or as bar graphs and analyzed by marketers, who determine the best cells (customer segments) to target. Hughes also stated that RFM analysis is easy to perform and results in a good segmentation.
Hughes (1994) mentioned that the three variables in the RFM model are equal in the importance; therefore, the weights of the three variables are identical. On the other hand, some literatures (Liu et al. 2005, Shen et al. 2009, Deng et al.
2008) indicates that the three variables are different in the importance due to the characteristic of industry. Thus, the weights of the three variables are not equal.
In this study it is assumed that the importance of the three variables are not equal so that weighing method using PCA is used to combine RFM score. After that the data mining techniques is used to analyze historical data of Garuda Frequent Flyer Members. These techniques including K-mean algorithm are used to segment customers into groups according to their personal profiles and mileage. As a partitioning method, the k-means algorithm is one of popular heuristic by most of applications (Han et al. 2011).
The idea behind the model is to identify and understand separate customer into several groups. Each customer segment has different behaviors and needs from the airline, and also needs different marketing approach. By creating segmentation, Garuda Indonesia is able to send relevant offers and messages to each of their Garuda Frequent Flyer Members.
Objectives
3
METHODOLOGY
Data Sources
This study uses data from Garuda Frequent Flyer Membership in 2012 with the total population 669,330 members. The explanatory variables are selected from five aspects, which include age, current tier type, frequency, last transaction date and transaction amount.
Table 1 Data type and source
Data Type Source
- Customer‟s Profile Data: gender,
age, location, country, company, tier type
- Transaction Data: transaction date,
frequency balance, flight number, ticket price The methods used in this research are:
1. Choose individuals by proportional systematic sampling. The sampling method following the amount of each tier which is classified to Blue, Silver, Platinum, Kids and Gold. After choosing the tier proportionally, then the individuals are chosen based on systematic random sampling. Behavior Quintiles (Miglautsch 2000). This research implements the second method with the following steps:
a. Select last transaction date as recency variable, transaction frequency as
frequency variable and transaction amount as monetary variable for each customers
b. Combine the Recency, Frequency and Monetary score altogether using Principal Component Analysis.
Principal component analysis is a statistical approach that can be used to analyze interrelationships among a large number of variables and to explain these variables in terms of their common underlying dimensions (Anderson et al. 2010).
4 summarized the contribution from the i-th principal component is:
∑ and for q principal component is:
∑
∑
If the result of eigenvector which is going to be picked is more than one component, because some researchers believe that the optimum amount of components to be picked is when the cumulative variance of those variables is bigger or equal to 70% of the total variance, then weighted value is needed calculated from this formula:
√
The output of this method is a single RFM Score combination.
4. Check the multicolinearity among the explanatory variables by using Pearson‟s correlation.
5. Check the existence of outliers among the explanatory variables.
6. Allocate customers into clusters based on similarity with the following steps: a. Clustering Evaluation.
The good clustering is the one which attain high similarity within cluster and low similarity among clusters. In order to achieve the optimum clustering method, we may use some method to evaluate the number of clusters such as R-square value
RS is used to measure the dissimilarity of clusters. Formally it measures the degree of homogeneity between groups. The values of RS range for 0 to 1 where 0 means there is no difference among the clusters and 1 indicates that there are significant difference among the clusters.
, where
b. Nonhierarchical method using k-means.
means algorithm is the simplest clustering and widely used. K-means requires an input which is a predefined number of clusters. This input is named k. The steps of the k-means algorithm are given below.
5 3. After all points have been assigned, recalculate new centroids of each
cluster.
4. Repeat step 2 and step 3 until the centroids no longer change. 7. Interpret the clustering result
RESULT AND DISCUSSION
Data Exploration
From a total of 26,513 transaction data, there are 9,468 unique members from five different tier types which are Blue, Silver, Gold, Kids and Platinum. Figure 1 shows that 67% of the total population is Blue Tier, 24% is Silver Tier, 6% is Gold Tier, 3% is Kids Tier and the last 1% is Platinum Tier.
Figure 1 The percentage of Garuda Frequent Flyer based on tier
However, based on transaction average point of view I analyze that customers from Platinum Tier reach the highest amount of transactions, in average there are 95 transactions made by each member. This number is high enough compared to the average of transactions which comes from Blue Tier, even though it consists of 67% of the GFF population, there is only three transactions in average per member. The rest of the transaction average is shown in the table below.
Table 2 Average transaction amount of Garuda Frequent Flyer Tier Type Member Quantity Transactions Average
Blue 445626 1324665 3
From the data it can be concluded that customers who come from Platinum Tier give the most beneficial to the company as they travel so frequent with significant number of transactions compared to the rest of the tiers. On the other
6
hand, it needs to be analyzed further to prove the hypothesis using RFM analysis and k-means algorithm where the consideration does not merely come from transaction numbers, but also from the amount of revenue they gave, the record of the time when they did their last transaction, their age and the mileage they kept.
The age distribution of the population is ranged from 3 years old to 115 years old. In term of age, figure 2 shows that most frequent flyers of Garuda Indonesia are around 40 years old ranged from 31 to 45 years old. This actually makes sense as it is the productive age ones can have when they still actively do business and travel frequently.
Figure 2 The age distribution of Garuda Frequent Flyer
The second highest age comes from the range of 46 to 60 years old, this is also considered as the period when the customers are still active to travel and this age is assumed that they are mature enough to make their decision.
RFM Analysis RFM Model Definition
RFM analysis depends on Recency, Frequency, and Monetary measures which are three important purchase-related variables that influence the future purchase possibilities of the customers. According to the literature (Wu et al.
2005), the RFM model measures when people buy, how often they buy and how much they buy. Because past purchases of customers can effectively predict their future purchase behavior. Firms can identify the customers, who are worthy to be contacted based on their past purchase behavior via RFM model. This analysis is widely applied in database marketing and is a common tool to develop marketing strategies.
In another occasion Hughes (1994) also believes that RFM is the most accurate method to predict customer future behavior compared to any possible combination of demographic combination because RFM exactly measures what people do: when they buy, how often they buy, how much they buy.
7 equal in the importance; therefore, the weights of the three variables are identical. On the other hand, Stone (1995) indicated that the three variables are different in the importance due to the characteristic of industry. Thus, the weights of the three variables are not equal.
The detail of variable concept along with its scale is shown in the table below:
Table 3 Indicator variables for RFM
Variable Indicator Data Type
Recency Time period since the last purchase, the more recent the value is, the higher the probability
of giving better response to company‟s
message
Date
Frequency Number of transactions, higher frquency indicates higher loyalty
Ratio Monetary Amount of money spent during a certain time
period
Ratio
In this research it is assumed that the three variables are different in the importance due to the existence of correlation among the three variables. In order to see the importance of each variable, we need to apply certain method where the weight of Recency, Frequency and Monetary can be seen clearly. Here we choose Principal Component Analysis to do so. Since the data type of Recency is not supported the using of Principal Component Analysis so we need to transform the value first into other type of data.
The way of assigning value is adopted based on the quintiles concept where the data will be divided into five equal-sized groups with different score (started from 1 to 5) with the same allocated number of member for each score. The more recent the transaction date is, the higher the score will be given. Below is the score allocation for the Recency score:
Table 4 Recency score detail
Score 1 2 3 4 5
Year 2012 2012 2012 2012 2012
Month
January June August September October
February July November
March December
April
May
Member Qty 984 992 974 993 1000
8
to the different importance among Recency, Frequency and Monetary, the weighting method is needed to combine the values into one single value; in this case we implement the using of Principal Component Analysis.
RFM Scoring: Weighted PCA
First thing to do before generating the analysis is to calculate the correlation among variables. The calculation of Pearson‟s Correlation is used to quantify the amount of dependence which exists among variables, in the concept of Pearson, the data is not necessarily ranked first before conducting the calculation. Another reason to use correlation matrix is because it can prevent the effect of different measurement unit relies on the data, which can not be handled by the variance-covariance matrix. The effect of pushing the use of variance-variance-covariance matrix when the measurement unit is different is that the result will not be optimum because it will be dominated by the variance which comes from the biggest value of data.
In table 5, it is shown that the strongest correlation is 0.70077 which lies between Frequency and Monetary; it means that the higher number of flying is always followed by the higher amount of transaction in financial form, this fact is definitely making sense because the more customers do transaction means the more customers spend money for purchasing activity. On the other hand, the correlation between Recency and Frequency is weak so is the correlation between Recency and Monetary. So that we can assume there is no such a strong relationship between the amounts of transaction activity with the frequencies of this customer doing transactions.
Table 5 Pearson correlation among Recency, Frequency and Monetary
Recency Frequency Monetary Recency 1.00000 0.35538 0.25284 Frequency 0.35538 1.00000 0.70077 Monetary 0.25284 0.70077 1.00000
The next step is determining the number of principal components which are going to be used in this research. Basically, the first principal component extracted from the principal component analysis contributes the maximum amount of total variance in the observed variables. It is usually correlated with many variables or at least some variables from the observed variables under typical conditions. While for the second principal component, it will contribute the maximum amount of variance which is not accounted for by the first principal component. The second principal component will be also correlated with some of the observed variables that did not appear in the first principal component.
9 According to the result of Principal Component Analysis written on Appendix 1, from the proportion column in the eigenvalue table it shows that the first principal component alone accounts for 64% of the total variance, the second principal component alone accounts for 27% of the total variance and the third component accounts for 7% of the total variance.
When researchers use the “cumulative percent of variance accounted for” as the criterion to solve the number of components problems, they will pick enough components so that the cumulative percentage of variance accounted for at least 70% (sometime 80%). If we are using 70% as the “critical value” for determining the number of components to retain, we would retain component 1 and component 2 in this analysis. By adding these percentages together, we will get the sum of 93% of the total variance. This number has passed the criteria and can be classified as optimum amount of components already. So that we can write the combination from the first and second principal component as shown below:
here, the first and second component will be combined to find the equation for RFM Score using weighted method for principal component analysis. Sumertajaya (2005) used the general formula for weighted principal component variable, in this occasion is defined as w:
√
assuming and refers to Recency Score (R), Frequency Score (F) and Monetary Score respectively, so that we find the equation for RFM Score can be written as: score in a distribution as compared to the mean and the variation of scores in the distribution. After standardizing the monetary value now that we will have a new score range from negative to positive. A negative z-score means indicates the score is below the distribution mean while a positive z-score indicates otherwise.
After that we can directly proceed to calculate the RFM Score with the above formula. For Example if one passenger did the last transaction on June 28 2012, means that the Recency Score is 2, and the transactions made on that period is five transactions with the budget of Rp 35,012,274 or after standardized becomes 2.4894, we can calculate the RFM Score for this GFF Member is . The RFM Score for each
customer is referred on table 6, which explains customer‟s purchasing behavior
10
Table 6 Garuda Frequent Flyer RFM score
Member No. Recency Frequency Monetary RFM
100007714 3 13 0.7378 6.458348 clusters, it is enough to look at R square for each variable.
We wish to decide the range of the clusters is between 2 to 9 clusters, and then we can evaluate the optimum cluster by calculating R-square value. RS measures the dissimilarity of cluster. This RS value is interpreted as the proportion of variation explained by a particular clustering from the observations. As we know that RS is written as:
where ∑ ∑ ∑ ̅ , ∑ ∑ ∑ ̅ . ESS refers to Error Sum Square, here we are summing over a; variables, and all of the units within each cluster. In this case, it is comparing the individual observations for each variable against the cluster means for that variable. Note that when the ESS is small, then this suggests that our data are close to their cluster means, implying that we have a cluster with high homogeneity units. TSS refers to Total Sum of Squares which is comparing the individual observations for each variable against the grand mean for that variable.
The graph on Figure 3 shows that the higher the RS is, the more difference the groups are. As it‟s been stated earlier that RS value indicates the percentage of variance explained by particular cluster which is chosen as the model. We see the RS value keeps on increasing in line with the increase of number of clusters. But we may assume that the peak starts to get steady after the seven clusters, on the
other hand it‟s assumed that the significance of variance percentage explained by
11 uses the application of k-mean algorithm to segment Garuda Frequent Flyer.
This research adopts k-means algorithm for segmenting customers due to several advantages which is listed by Ye et al. (2013) such as it is scalable and efficient in processing big data, the algorithm is not sensitive to the input order of data and the result is easier to understand.
There are seven clusters in this data set with the classification of members as follow:
Figure 4 The member percentage in each cluster
12
Cluster 2 has a lot of members, 53% of the total members. Members on this cluster contribute the least benefit for the company, which is IDR 903,838 per year and can be classified as inactive members because not only the monetary but the recency and frequency values are also very low. They only do transaction range from one transaction to no transaction at all. Most members come from Blue Tier with the average age of 39 years old which is relatively still very young and can be assumed to be price sensitive compared to those with older age.
Cluster 3 has a few members, only 0.2% of the total members. Members come from this cluster lead as the first top member the company has. They usually take the international route and consistently using this airline throughout the year. Almost all of the members come from Platinum Tier with the average of age 55 years old. When we see the mileage balance owned by members from this cluster, we can conclude that company has the biggest liability towards these members. So
that it‟s suggested to give such more rewards or bonuses to them.
Cluster 4 has average members, 9.78% of the total members. Members from this cluster do a slightly above average transactions which are shown by the average amount of transactions frequency, seven transactions throughout the year and contributes about IDR 11,804,900. Most members come from Silver and Blue Tiers with the average age of 45 years old. This cluster can be classified as one of the next top member who needs to be targeted intensively by the company due to their consistent engagement of transaction behavior with the company.
Cluster 5 has a few to average members, 5.4% of the total members. Members come from this group can be classified as an above average member, but still can not be called as the best one. With the average recency score, the members have a high frequency amount, about fifteen transactions per year. They in average contribute about IDR 22,911,600 to the company profit. Most members come from Gold and Silver Tier which are two top tiers in Garuda Frequent Flyer right below Platinum. This cluster is also classified as one of the next top member to be targeted.
Cluster 6 has a few members, 2.27% of the total members. Members do frequent transaction, 13 transactions throughout the year also followed by good recency score. This cluster contributes about IDR 39,304,500 per year. Most members come from Silver and Gold with the average age of 48 years old.
13
CONCLUSION AND RECOMMENDATION
Conclusion
This study has introduced the step by step approach of marketing segmentation including: (1) weighing the RFM using principal component analysis and (2) segmenting customers into certain clusters using k-means algorithm. K-means clustering divides Garuda Frequent Flyer into seven clusters. They are mainly grouped as top members which are the best customers the company has with high RFM and consistent purchasing behavior, above average members which are the members with high recency and frequency but lesser monetary score compared to the top members, next top members which are indicated by low frequency but high recency and monetary score, average members which have average transaction record and inactive members which are rarely doing transaction and have been missing from the company. From this segmentation it is expected that company can make a better marketing approach toward each segment thus it can minimize the cost and maximize the profit. Another interesting conclusion found from this research is the fact that member with older age usually engages better toward offerings made by Garuda Indonesia compared to those whose age is younger.
Recommendation
Because it is impossible to implement single marketing strategy to the whole members the company has, and in order to evaluate the membership, it is highly recommended for the company to do segmentation gradually. Because only
by understanding customer‟s behavior company can minimize marketing cost and maximize the profit.
This research has several limitations that still can be improved for further research such as the more fundamental concept of sampling method, the future prediction of customers from customer lifetime value and marketing cost spent by
company which still hasn‟t been analyzed in this research. Other than that, it
14
REFERENCES
Aviliani. 2011. Analisis Segmentasi Nasabah Tabungan Bank berdasarkan Customer Value [disertasi]. Bogor (ID): Institut Pertanian Bogor.
Berman B. 2006. Developing an effective customer loyalty program. California Management Review. 49(1):123-148.
Bolton RN, Kannan PK, Bramlett MD. Implications of Loyalty Program Membership and Service Experiences for Customer Retention and Value. J of the Academy of Marketing Science. 28(1):95-108.
Chin ATH. 2002. Impact of Frequent Flyer Programs on the Demand for Air Travel. J of Air Transportation. 6(2):53-86.
Dreze X, Nunes JC. 2004. Using Combined-Currency Prices to Lower Consumer‟ Perceived Cost. J of Marketing Research. 41(1):59-72.
Everitt BS, Landau S, Leese M, Stahl D. 2011. Cluster Analysis, Fifth Edition. London: John Wiley & Sons, Ltd.
Hair JF Jr, Black WC, Babin BJ, Anderson RE. 2010. Multivariate Data Analysis A Global Perspective, Seventh Edition. New York: Pearson.
Han J, Kamber M, Pei J. 2011. Data Mining: Concepts and Techniques, Third Edition. San Francisco: Morgan Kaufmann Publishers.
Hartigan JA. 1972. Direct Clustering of a Data Matrix. J of the American Statistical Association. 67(337):123-129.
Hartigan J A. 1978. Asymptotic Distributions for Clustering Criteria. Annals of Statistics. 6(1):117–131.
Hughes AM. 1994. Boosting Response with RFM. Marketing Tool. 3(3):4-5. Johnson RA, Wichern DW. 2002. Applied Multivariate Statistical Analysis, Fifth
Edition. New Jersey: Prentice Hall.
Lin SY, Wei JT, Wu HH. 2010. A Review of the application of RFM model. Journal of Business Management. 4(19):4199-4206.
Liu DR, Shih YY. 2005. Integrating AHP and data mining for product recommendation based on customer lifetime value. Information & Management. 42(1):387-400.
Martin JC, Roman C, Espino R. 2011. Evaluating Frequent Flyer Programs from the Air Passenger’ Perspective. J of Air Transport Management. 17(1):364-368. Miglautsch JR. 2000. Thoughts on RFM Scoring. J of Database Marketing. 8(1):3-4. Montinaro M, Sciascia I. 2011. Market Segmentation to Obtain Different Kinds of
Customer Loyalty. J of Applied Sciences. 11(4):655-662.
Morrison DF. 1967. Multivariate Statistical Methods. USA: McGraw-Hill Book Company.
Niyagas W, Srivihok A, Kristin S. 2006. Clustering e-Banking Customer Using Data Mining & Marketing Segmentation. ECTI Transaction on Computer & Information Technology. 2(1): 63-69.
Sarle WS. 1983. Cubic Clustering Criterion. SAS Technical Report A-108. Cary. North Carolina: SAS Institute Inc.
15 Sumertajaya IM. 2005. Kajian Pengaruh Inter Blok dan Interaksi pada Uji Lokasi
Ganda dan Respon Ganda [disertasi]. Bogor (ID): Institut Pertanian Bogor. Ye L, Qiuru C, Haixu X, Yijun L, Guangping Z. 2013. Customer Segmentation
16
17 Appendix 2 Weighted Variable for RFM Score
√ √
√ √
18
20
21
BIOGRAPHY
Devi Fitri Yani was born in Banda Aceh as the eldest daughter of Abri Yani and Nurlela on April 10 1992. She took high school academic on the same city and was graduated from SMAN 10 Fajar Harapan Banda Aceh and SMPN 19 Percontohan Banda Aceh before continuing her study to IPB in 2009.
During her college life, besides taking Statistics in formal academic form, she also joined a debating club and represented IPB in some debate competitions both in national and international level. Several achievements she ever hit are being a delegation for World University Debating Championship 2013 in Berlin, Germany, the second runner up of United Asian Debating Competition 2011 in Macau, China, the first winner novice breaking category of Indonesian Varsity English Debating 2011 in Universitas Hassanuddin, Makassar and the grand finalist of National University Debating Championship 2013 held by DIKTI.