STUDIES ON GROWTH SPURT AND AGING
IN HIGHER PRIMATES
TETRI WIDIYANI
GRADUATE SCHOOL
BOGOR AGRICULTURAL UNIVERSITY
BOGOR
STATEMENT LETTER
I hereby declare that dissertation entitled Studies on Growth Spurt and
Aging in Higher Primates is original result of my own research supervised by supervisory committee and has never been submitted in any form at any
institution before. All information from other authors cited here are mentioned in
the text and listed in the reference at the end part of the dissertation.
Bogor, February 9th, 2012
Tetri Widiyani
ABSTRACT
TETRI WIDIYANI. Studies on Growth Spurt and Aging in Higher Primates. Supervised by BAMBANG SURYOBROTO, SRI BUDIARTI and ALEX HARTANA
Growth is the best global indicator of children’s well-being. It is the single measurement that best defines the health and nutritional status of children, just as it provides an indirect measurement of the quality of life of an entire population. The pattern of human growth reflects the biocultural evolution of our species. The human pattern of growth and development (ontogeny) appears to differ markedly from patterns of ontogeny in other primate species. Three studies are reported here which deal to the growth and
development of human and chimpanzee (Pan troglodytes). These three studies
allow us to contrast the phenomena of adolescence growth spurt and female elderly bone loss in chimpanzee and human as chimpanzee is the closest species to humans within extant nonhuman primates. In the first, a cross-sectional study of growth of the body size and somatotype of 363 Javanese girls and 299 Javanese boys aged 4 to 20 years from Magelang Regency, Indonesia was described. In the second, cross-sectional and longitudinal studies in the growth of chimpanzee second metacarpal bone linear dimensions from individuals aged 0 to 43.6 years were used for comparison. While in the third, cross-sectional and longitudinal studies in the growth of chimpanzee body size (body mass and anterior trunk length) and second metacarpal bone mineral content were derived. In measuring the second metacarpal dimensions and mineral content, a total of 568 radiographs of chimpanzee's proximodistal left hands were used. They were taken from 68 females and 49 males aged 0 to 43.62 years old. We applied an image analysis system, Scion Image Release Alpha 4.0.3.2 software for Windows to measure bone linear dimensions and bone mineral content. Humans present complex and sinuous growth curves for both body weight and height. A clear growth spurt could be demonstrated by cross-sectional analysis in our girl subjects at around aged 11.5 years and in our boy subjects at around aged 12.5 years. In longitudinal series, not in cross-sectional, several representative chimpanzees of both sexes showed a pre-adult growth spurt on the body sizes, bone dimensions and bone mineral content. They ranged at age 4.5 to 8.5 years. This underscore the fact that adolescent growth spurt in linear dimension was not a universal feature of anthropoid primate ontogeny. Bone loss is a well established characteristic of human female aging. Based on cross-sectional analyses the sequential decline of bone mass in female chimpanzee may be said to be genuine. On the other hand, we found in adulthood through elderly, male chimpanzees show a longer plateau than female chimpanzee, that is, bone mineral content is maintained in male.
ABSTRAK
TETRI WIDIYANI. Studi Lonjak Pertumbuhan dan Penuaan pada Primata Tingkat Tinggi. Dibimbing oleh BAMBANG SURYOBROTO, SRI BUDIARTI dan ALEX HARTANA
Pertumbuhan merupakan indikator terbaik untuk menggambarkan status kesehatan dan gizi anak-anak serta kualitas hidup dalam suatu populasi penduduk. Pola pertumbuhan manusia, mencerminkan evolusi biokultural spesies manusia yang nampaknya berbeda dari spesies primata lainnya.
Simpanse (Pan troglodytes) digunakan dalam penelitian ini karena merupakan
spesies terdekat dengan manusia yang belum punah. Penelitian ini terdiri dari 3 bagian yang mengkaji pertumbuhan dan perkembangan manusia dan simpanse.
Bagian pertama merupakan studi cross-sectional untuk pertumbuhan ukuran
dimensi tubuh (bobot badan dan tinggi badan) serta somatotipe dari 363 anak perempuan dan 299 anak laki-laki Jawa usia 4 sampai 20 tahun, di Kabupaten
Magelang, Indonesia. Bagian kedua adalah studi cross-sectional dan
longitudinal untuk pertumbuhan dimensi linear tulang metakarpal kedua (panjang, lebar dan tebal korteks) pada simpanse. Bagian ketiga merupakan
studi cross-sectional dan longitudinal untuk pertumbuhan dimensi badan (massa
tubuh dan panjang badan anterior) serta kandungan mineral korteks tulang metakarpal kedua pada simpanse. Pengukuran dimensi tulang dan kandungan mineral korteks metakarpal kedua dilakukan secara radiografi pada 568 foto radiograf tangan kiri dari 68 simpanse betina dan 49 simpanse jantan usia 0
sampai 43,6 tahun. Pengukuran tersebut dilakukan menggunakan software
pengolah gambarScion Image Release Alpha 4.0.3.2. Rangkaian penelitian ini
memungkinkan untuk membandingkan fenomena lonjak pertumbuhan (growth
spurt) pada tahap remaja dan pengeroposan tulang (bone loss) pada wanita dan simpanse betina di masa tua. Hasil penelitian ini menunjukkan bahwa manusia mempunyai kurva pertumbuhan yang kompleks untuk ukuran bobot badan dan
tinggi badan. Lonjak pertumbuhan yang jelas (dibuktikan dengan analisis
cross-sectional) terjadi pada usia sekitar 11,5 tahun untuk anak perempuan dan sekitar 12,5 tahun untuk anak laki-laki. Pada simpanse, lonjak pertumbuhan tidak dapat
dilihat dengan studi cross-sectional, tetapi hanya dapat dilihat dengan
menggunakan studi longitudinal. Lonjak pertumbuhan ini terlihat pada semua parameter yang diukur pada simpanse jantan dan betina usia 4,5 sampai 8,5
tahun. Beberapa simpanse betina mengalami bone loss, sejak usia 20 tahun.
Berbeda dengan manusia, simpanse tidak mengalami menopause yang merupakan penanda penuaan. Simpanse jantan tidak menunjukkan fenomena tersebut, kandungan mineral tulang tetap dipertahankan.
Kata kunci: pertumbuhan, anak-anak Jawa, lonjak pertumbuhan, simpanse,
SUMMARY
TETRI WIDIYANI. Studies on Growth Spurt and Aging in Higher Primates. Supervised by BAMBANG SURYOBROTO, SRI BUDIARTI and ALEX HARTANA
Growth is the best global indicator of children’s well-being. It is the single measurement that best defines the health and nutritional status of children, just as it provides an indirect measurement of the quality of life of an entire population. The pattern of human growth reflects the biocultural evolution of our species. The human pattern of growth and development (ontogeny) appears to differ markedly from patterns of ontogeny in other primate species. Humans present complex and sinuous growth curves for both body mass and stature. Many bodily proportions change dramatically during ontogeny as we reach sizes that are among the largest of living primates. Perhaps most obviously, humans grow for a long time, with the interval between birth and maturation exceeding that of all other primate species. In human, growth is spurted to attain the genetically determined target size in adult. Growth spurt of body size is a modular and highly evolvable feature of ontogeny. Therefore the first and major interest in the evolution of growth and development study is whether non-human primate species have an adolescent growth spurt corresponding to that of human. Growth spurt could predict the abnormal development which occurred during pre-adult phases.
Bone mineral loss is a well established characteristic of human aging. It is found in all human populations. Thus, it is often considered to be a universal aspect of human ontogeny, although women experience a greater decline in bone mass during aging than men do. It is well-known that menopause had a major effect to the evidence of bone loss in many older women. With demographic shifting into older cohort in population pyramid, bone porosity raises medical concern. Historically, some species of non-human primates were also generally considered to exhibit age-related bone loss although they never had menopause. Comparative investigation on age change of bone mineral content (BMC) in non-human primates is therefore necessary for the evolutionary consideration of
growth (ontogeny) and aging and to find suitable model to study bone loss.
In considering the evolution of biological characteristics of primates and the interrelationships of species-specific life history, ecology, and life-style, comparison of growth and development of several primates are essential. Specifically, to understand the evolutionary characteristic of human life history we investigate the growth pattern of the closest species to humans within extant
nonhuman primates, the chimpanzee (Pan troglodytes). Longitudinal and
x
proximodistal left hands using an image analysis system, Scion Image Release Alpha
4.0.3.2 software.
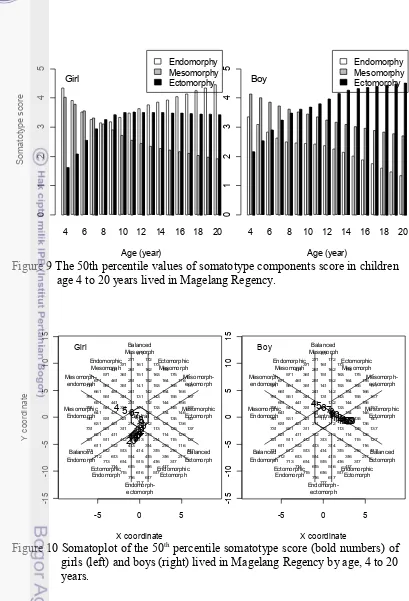
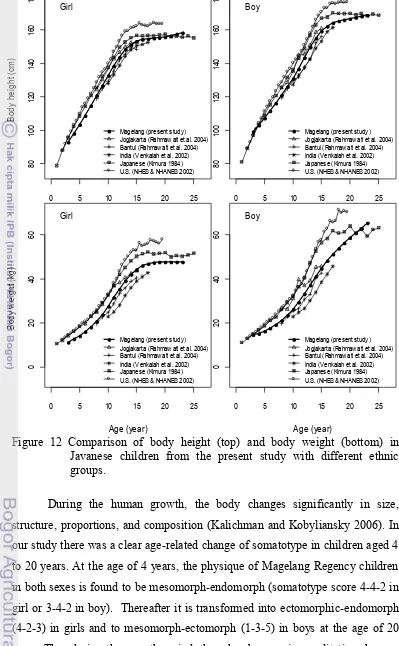
We evaluated the growth pattern of Javanese population in updating data for infants, children and adolescence cross-sectionally to overcome the cost and the long time period required for a longitudinal study in human growth. We selected children (aged 4 to 20 years) from Magelang Regency, Central Java Province Indonesia. They were observed from the viewpoint of anthropometrical characteristics. Body size of girls at the age of 4 years were 13 kg in body weight and 100 cm in body height, while the boys’s were 15 kg in body weight and 100 cm in body height. Girls’s increased to 47 kg in body weight and 150 cm in body height, while boys’s increased to 58 kg in body weight and 167 cm in body height at the age of 20 years. They were shorter and lighter than reference children from U.S., Japan, and Yogyakarta but they improved when compared with those of the same ethnic of Bantul and with the different ethnic of rural India. A clear adolescence growth spurt was demonstrated by cross-sectional analysis in body weight and height of both sexes. They did not differ to the results on growth velocity standards which were constructed longitudinally. Nevertheless velocity peak of our children subjects was less than that of reference children which came from well-off population. There was a clear age-related change in their somatotype. At the age of 4 years, the physique of both sexes is found to be mesomorph-endomorph (somatotype score 4-4-2 in girl or 3-4-2 in boy). Thereafter it is transformed into ectomorphic-endomorph (4-2-3) in girls and to mesomorph-ectomorph (1-3-5) in boys at the age of 20 years.
Chimpanzee exhibited an initial increase in bone dimensions and BMC with age. Bone length and width accelerated for the first 8 years of age, whereas cortical thickness accelerated longer until around 14 years of age. MCI increased for first 6 to 7 years of age, whereas cortical density increased for a longer period than MCI, until around 10 years of age. Sexual difference in bone length, cortical thickness and BMC, which was greater in males than in females, has been apparent significantly except in bone width which was unclear. Bone dimensions maturated at about 13 years of age while BMC maturated at around age 10 to 12 years for MCI and 16 years for cortical density. During adulthood through aging, bone length and width tended to plateau for both sexes. Cortical thickness in female chimpanzees tended to decrease, but in males increasing instead. Cross-sectional analyses of chimpanzee in body mass also showed a pre-adult growth spurt but in ATL, three bone dimensions and BMC, the spurt could not be seen. However, by longitudinal analyses all parameters showed spurts in several chimpanzee individual of both sexes. It was found that there was a wide inter-individual age variation in this growth spurts. During aging, the BMC of many females declined but males’s continued its plateau phase or increase instead. Some female chimpanzees even experienced bone loss earlier, approximately since age 20 years.
xi
Copyright © 2012. Bogor Agricultural University. All Rights Reserved
Prohibited to cite all or a part of this dissertation without referring to and mentioning the source. Citation permits to the purposes of education, research, scientific paper, report, or critism writing only; and it does not defame the name and honor of Bogor Agricultural University.
STUDIES ON GROWTH SPURT AND AGING
IN HIGHER PRIMATES
TETRI WIDIYANI
Dissertation
submitted in partial fulfillment of the requirements for a Doctoral Degree in Animal Bioscience Major of Graduate School of Bogor Agricultural University
GRADUATE SCHOOL
BOGOR AGRICULTURAL UNIVERSITY
BOGOR
ii
Examiners in the Close examination:
1. Prof. Ir. Wasmen Manalu, Ph.D. (Professor of Faculty of Veterinery,
Bogor Agricultural University)
2. Dr. Astuti Lamid, M.CN. (Researcher of Center for Applied Health
Technology and Clinical Epidemiology, Research and Development
of Indonesian Health Ministry)
Examiners in the Open examination:
1. Prof. Yuzuru Hamada, D.Sci. (Professor of Primate Research
Institute, Kyoto University)
2. Prof. Dr. dr. Agus Purwadianto, S.H., M.Si., Sp.F (K). (Professor of
Faculty of Medicine, Indonesia University and Expert Staff of
iii
Title : Studies on Growth Spurt and Aging in Higher Primates
Name : Tetri Widiyani
Student ID : G362070041
Major : Animal Biosciences
Endorsed by, Supervisory Committee
Dr. Bambang Suryobroto Chairman
Dr. dr. Sri Budiarti Prof. Dr. Ir. Alex Hartana,
M.Sc.
Member Member
Head of Animal Bioscience Major Dean of Graduate School,
Dr. Bambang Suryobroto Dr. Ir. Dahrul Syah,
M.Sc.Agr.
PREFACE
This dissertation is submitted in partial fulfillment of the requirements for
a Doctoral Degree for the author in Graduate School of Bogor Agricultural
University. It represents a culmination of work and learning that has taken place
over a period of almost five years (2007 – 2011). The work addresses three topics
related to the evolutionary of growth and development. Author had granted
Scholarship for Post-graduate Study (BPPS) during periods 2007 to 2010 and
Scholarship of Sandwich-Like Program in 2008 from the Indonesian Ministry of
Education, Directorate General of Higher Education (DIKTI). A portion of
dissertation (topic I) entitled The Growth of Body Size and Somatotype of
Javanese Children Aged 4 to 20 Year was published in Hayati Journal of Biosciences Vol. 18 No. 4, December 2011.
This work could only be succeeded thanks to the invaluable contribution
of many people. First and foremost I am grateful for the generous support of my
supervisory chair, Dr. Bambang Suryobroto, who has been with me throughout
the years as mentor, editor and friend and introduced me to Professor Dr.Yuzuru
Hamada from Primate Research Institute Kyoto University. I am glad I could
work in Hamada’s laboratory to study the evolutionary growth and aging of
chimpanzee. It was a great learning experience doing collaboration research with
international researcher who is very competent in evolutionary morphology field.
I also extend special thanks to both co-adviser, Dr. dr. Sri Budiarti and Professor
Dr. Alex Hartana, who guided me through the process of developing confidence
as an academic.
I am very grateful to Rector of Sebelas Maret University for the
permission to pursue doctoral study in Graduate School of Bogor Agricultural
University. I am also grateful to the Government of Magelang Regency for the
permission of this study and to the school principals, teachers and all the children
subjects for all their support throughout the study in Magelang. Thanks to all staff
of Primate Research Institute Kyoto University Japan for their help and
xviii
There are many other people without whom I would never have made it to
the end of a successful graduate career. Thanks to people at Zoo Corner ‘Z-Co’
(Kanthi A. Widayati, M.Si., E. Nunuz Rohmatullayaly, S.Si., Sarah Nila, S.Si.,
Islamul Hadi, M.Si., J.J. Elda Irma Kawulur, M.Si., Puji Rianti, M.Si., Gres
Maretta, M.Si., Indra, S.Si., Reny Kristianti Aryo, S.Si., Norita Widya Pangestika,
S.Si., Sekar Sukmaningrasa, M.Si., Yuliadi Zamroni, M.Si., Dr. Achmad
Farajallah, M.Si., Dr. Rika Raffiudin, Dr. Bambang Kiranadi, Mrs. Anik, Mrs.
Tini Wahyuni, Mr. Adi Surachman, Mr. Agus, and so on) for opportunities to
share thoughts and fun. Thanks to people at Pondok Putri Arum and Wisma Intan
for making me feel at home far away from home. In addition, thank you to friends
on Twitter and Facebook for making it less lonely during working at Inuyama
Japan and Bogor.
My highest expression of gratefulness is for my family. I thank my parents
(‘mamah’ dr. Kustiyah Marwi and ‘ibuk’ Tuti Sriani) for life and the strength and determination to live it. My special thanks to my husband Eko Kurniawan and my
daughter Aulia Alifiani for the unconditional love and unfailing patience and
support. This dissertation is equally their achievement. Therefore, above all, I
thank God Allah SWT since this work would not be possible without His
almighty.
Bogor, February 2012
xix
CURRICULUM VITAE
The author was born in Surakarta, Central Java at December 24, 1971 by
Tuti Sriani. Author married with Eko Kurniawan, S.T. at August 10, 2002 and had
a daughter, Aulia Alifiani. Bachelor degree was earned from Department of
Zoology, Faculty of Biology, Gadjah Mada University in the beginning of 1998.
In the middle of 1998, she obtained DUE scholarship from the Indonesian
Ministry of Education, Directorate General of Higher Education (DIKTI) for
pursuing Master Degree at Graduate School of Gadjah Mada University on
Biology field and graduated at May 2001.
Since March 1, 2000 she has working as a lecturer at Department of
Biology, Faculty of Mathematics and Natural Science, Sebelas Maret University
Surakarta, Central Java. The main course which lectured is Animal Structure and
Development. Other courses were Animal Eco-morphology, Animal
Microtechnique, Teratology, and Experimental Anatomy. From the middle 2007
to the middle 2010, author got Scholarship for Graduate Study (BPPS) from the
Indonesian Ministry of Education, Directorate General of Higher Education
(DIKTI) for pursuing a Doctoral Degree at Graduate School of Bogor Agricultural
University on the Major of Animal Bioscience.
During November 2008 to February 2009, she did a collaboration research
with Primate Research Institute, Kyoto University Japan in the Sandwich-like
Program which funded by Indonesian Ministry of Education, Directorate General
of Higher Education (DIKTI). A paper entitled The Growth of Body Size and
Somatotype of Javanese Children Aged 4 to 20 Years which was a partial of Doctorate theses of her was published in Hayati Journal of Biosciences Vol. 18
No. 4, December 2011. Author has a membership in Asia-Pacific Chemical,
xxi CHILDREN AGE 4 TO 20 YEARS IN MAGELANG REGENCY...19
Abstract...19 Cross-sectional analysis on age-related changes of cortical thickness...49 Longitudinal analysis on age-related changes of bone dimensions...51 Longitudinal analysis on growth velocity of bone dimensions ...57 Discussion...65 Conclusion...67
AGE-RELATED CHANGES OF MINERAL CONTENT IN THE CORTICAL BONE OF CHIMPANZEE’S SECOND METACARPAL...69
xxii
Cross-sectional analysis on age-related changes of metacarpal cortical index...77 Cross-sectional analysis on age-related changes of cortical density...80 Relationship between MCI, cortical density and body size...82 Longitudinal age-related changes of MCI...84 Longitudinal age-related changes of cortical density...89 Cross-sectional and longitudinal analysis on growth of body mass and anterior trunk length ...91 Discussion...94 Conclusion...100
GENERAL DISCUSSION...101
GENERAL CONCLUSION...107
xxiii
LIST OF TABLES
Page
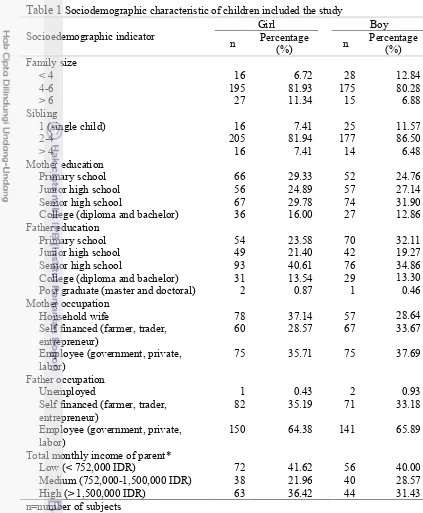
TABLE 1 SOCIODEMOGRAPHIC CHARACTERISTIC OF CHILDREN INCLUDED THE STUDY...26
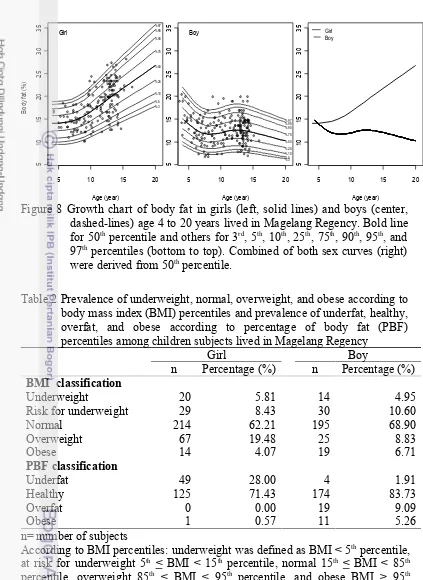
TABLE 2 PREVALENCE OF UNDERWEIGHT, NORMAL, OVERWEIGHT, AND OBESE ACCORDING TO BODY MASS INDEX (BMI) PERCENTILES AND PREVALENCE OF UNDERFAT, HEALTHY, OVERFAT, AND OBESE ACCORDING TO PERCENTAGE OF BODY FAT (PBF) PERCENTILES AMONG CHILDREN SUBJECTS LIVED IN MAGELANG REGENCY..30
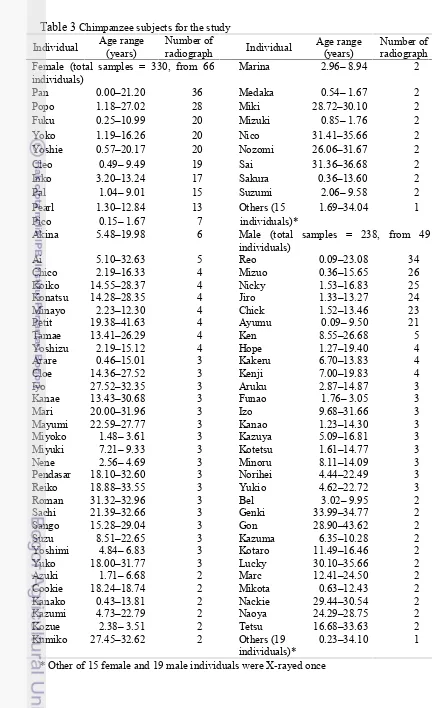
TABLE 3 CHIMPANZEE SUBJECTS FOR THE STUDY...43
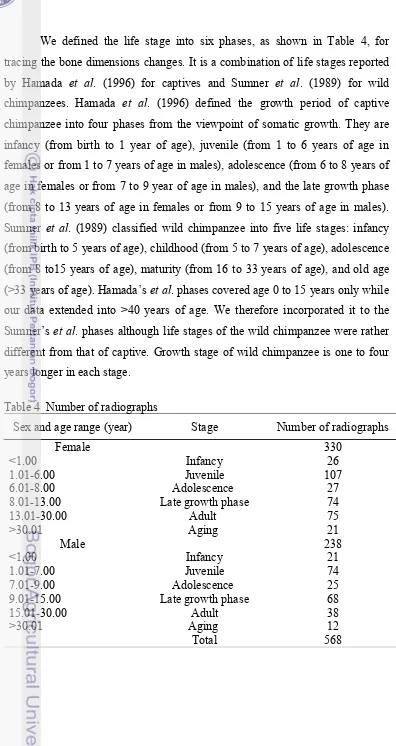
TABLE 4 NUMBER OF RADIOGRAPHS ...44
TABLE 5 SUMMARY OF GROWTH SPURT IN THE SECOND METACARPAL BONE LENGTH CHIMPANZEE ...60
TABLE 6 SUMMARY OF GROWTH SPURT IN THE SECOND METACARPAL BONE WIDTH OF CHIMPANZEE FROM LONGITUDINAL DATA...61
TABLE 7 SUMMARY OF GROWTH SPURT IN THE SECOND METACARPAL CORTICAL THICKNESS OF CHIMPANZEE FROM LONGITUDINAL DATA...61
TABLE 8 NUMBER OF RADIOGRAPHS ...77
TABLE 9 SUMMARY OF THE SECOND METACARPAL CORTICAL INDEX (MCI) GROWTH SPURT IN CHIMPANZEES FROM THE LONGITUDINAL STUDY...89
TABLE 10 SUMMARY OF THE BODY MASS (BM) GROWTH SPURT IN CHIMPANZEES FROM THE LONGITUDINAL STUDY...92
TABLE 11 SUMMARY OF THE ANTERIOR TRUNK LENGTH (ATL) GROWTH SPURT IN CHIMPANZEES FROM THE LONGITUDINAL STUDY...93
TABLE 12 COMPARISON OF GROWTH SPURTS OF CHIMPANZEE IN SEVERAL CHARACTERS ...102
xxv
LIST OF FIGURES
Page
FIGURE 1 MEASUREMENTS MADE IN RADIOGRAMMETRY OF THE METACARPAL...11
FIGURE 2 DENSITOMETRIC PATTERN OF A CROSS-SECTIONAL MID-SHAFT BONE...12
FIGURE 3 SCHEMATIC REPRESENTATION OF A STEP WEDGE AND BELOW IT THE RADIOGRAPHIC IMAGE IT WOULD BE EXPECTED TO PRODUCE (SYMMONS 2004). ...13
FIGURE 4 MAP OF MAGELANG REGENCY IN CENTRAL JAVA PROVINCE INDONESIA SHOWING THE STUDY SITES (▼). ...22
FIGURE 5 GROWTH CHART OF BODY WEIGHT IN GIRLS (LEFT, SOLID LINES) AND BOYS (CENTER, DASHED-LINES) AGE 4 TO 20 YEARS LIVED IN MAGELANG REGENCY...27
FIGURE 6 GROWTH CHART OF BODY HEIGHT IN GIRLS (LEFT, SOLID LINES) AND BOYS (CENTER, DASHED-LINES) AGE 4 TO 20 YEARS LIVED IN MAGELANG REGENCY...28
FIGURE 7 GROWTH CHART OF BODY MASS INDEX IN GIRLS (LEFT, SOLID LINES) AND BOYS (CENTER, DASHED-LINES) AGE 4 TO 20 YEARS LIVED IN MAGELANG REGENCY...29
FIGURE 8 GROWTH CHART OF BODY FAT IN GIRLS (LEFT, SOLID LINES) AND BOYS (CENTER, DASHED-LINES) AGE 4 TO 20 YEARS LIVED IN MAGELANG REGENCY...30
FIGURE 9 THE 50TH PERCENTILE VALUES OF SOMATOTYPE COMPONENTS SCORE IN CHILDREN AGE 4 TO 20 YEARS LIVED IN MAGELANG REGENCY. ...32
xxvi
FIGURE 13 A RADIOGRAPH OF CHIMPANZEE LEFT HAND (A) WITH A TRANSPARENT RULER TO SCALE LINEAR MEASUREMENTS EXHIBITS THE POSITION OF SECOND METACARPAL BONE...42
FIGURE 14 AGE-RELATED CHANGE OF THE SECOND METACARPAL LENGTH IN FEMALE (LEFT) AND MALE (CENTER) CHIMPANZEES FROM THE CROSS-SECTIONAL STUDY.. 45
FIGURE 15 VELOCITY CURVES FOR THE AGE-RELATED CHANGE OF THE SECOND METACARPAL LENGTH IN FEMALE AND MALE CHIMPANZEES PREDICTED FROM THE 50TH PERCENTILE OF THE CROSS-SECTIONAL AGE-CHANGE CURVE. ...46
FIGURE 16 AGE-RELATED CHANGE OF THE SECOND METACARPAL WIDTH IN FEMALE (LEFT) AND MALE (CENTER) CHIMPANZEES FROM THE CROSS-SECTIONAL STUDY.. 47
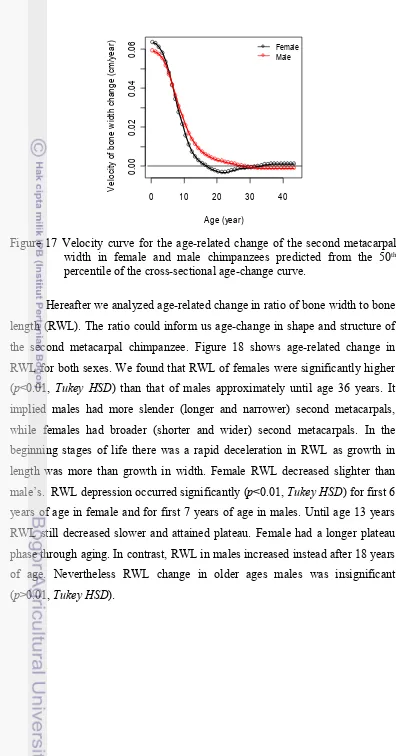
FIGURE 17 VELOCITY CURVE FOR THE AGE-RELATED CHANGE OF THE SECOND METACARPAL WIDTH IN FEMALE AND MALE CHIMPANZEES PREDICTED FROM THE 50TH PERCENTILE OF THE CROSS-SECTIONAL AGE-CHANGE CURVE. ...48
FIGURE 18 AGE-RELATED CHANGE OF THE RATIO BONE WIDTH TO BONE LENGTH IN FEMALE (LEFT) AND MALE (CENTER) SECOND METACARPAL CHIMPANZEES FROM THE CROSS-SECTIONAL STUDY. ...49
FIGURE 19 AGE-RELATED CHANGE OF THE CORTICAL THICKNESS IN FEMALE (LEFT) AND MALE (CENTER) SECOND METACARPAL CHIMPANZEES FROM THE CROSS-SECTIONAL STUDY...50
xxvii
FIGURE 24 VELOCITY CURVE OF THE SECOND METACARPAL BONE LENGTH GROWTH OF MALE CHIMPANZEES FROM
FIGURE 27 PROCEDURE TO MEASURE CORTICAL DENSITY (NOT TO SCALE). ...75
FIGURE 28 AGE-RELATED CHANGE OF THE SECOND METACARPAL CORTICAL INDEX (MCI) IN FEMALE (LEFT) AND MALE (CENTER) CHIMPANZEES FROM THE CROSS-SECTIONAL STUDY...78
FIGURE 29 AGE-RELATED CHANGE OF THE SECOND METACARPAL CORTICAL INDEX (MCI) IN FEMALE AND MALE CHIMPANZEES AGE 0 TO 18 YEARS DERIVED FROM THE 50TH PERCENTILE. ...79
FIGURE 30 VELOCITY CURVE FOR THE AGE-RELATED CHANGE OF THE SECOND METACARPAL CORTICAL INDEX (MCI) IN FEMALE AND MALE CHIMPANZEES FROM THE CROSS-SECTIONAL STUDY...80
FIGURE 31 CURVES OF AGE-CHANGE OF THE CORTICAL DENSITY IN THE SECOND METACARPAL IN FEMALE (LEFT) AND MALE (CENTER) CHIMPANZEES FROM THE CROSS-SECTIONAL STUDY. ...81
FIGURE 32 AGE-RELATED CHANGE OF THE SECOND METACARPAL CORTICAL DENSITY IN FEMALE AND MALE CHIMPANZEES AGE 0 TO 18 YEARS DERIVED FROM THE 50TH PERCENTILE. ...81
xxviii
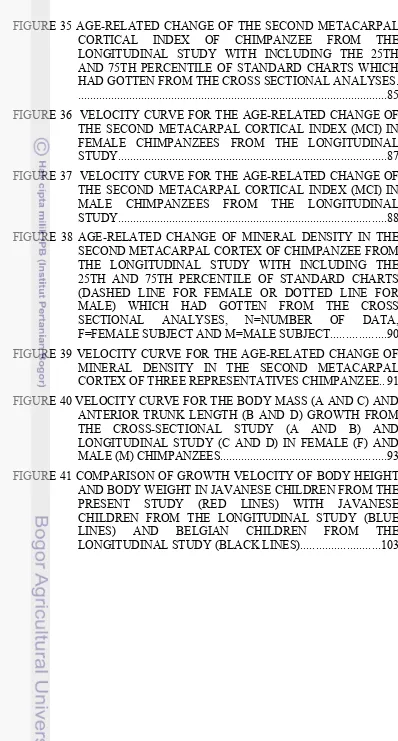
FIGURE 35 AGE-RELATED CHANGE OF THE SECOND METACARPAL CORTICAL INDEX OF CHIMPANZEE FROM THE LONGITUDINAL STUDY WITH INCLUDING THE 25TH AND 75TH PERCENTILE OF STANDARD CHARTS WHICH HAD GOTTEN FROM THE CROSS SECTIONAL ANALYSES. ...85
FIGURE 36 VELOCITY CURVE FOR THE AGE-RELATED CHANGE OF THE SECOND METACARPAL CORTICAL INDEX (MCI) IN FEMALE CHIMPANZEES FROM THE LONGITUDINAL STUDY...87
FIGURE 37 VELOCITY CURVE FOR THE AGE-RELATED CHANGE OF THE SECOND METACARPAL CORTICAL INDEX (MCI) IN MALE CHIMPANZEES FROM THE LONGITUDINAL STUDY...88
FIGURE 38 AGE-RELATED CHANGE OF MINERAL DENSITY IN THE SECOND METACARPAL CORTEX OF CHIMPANZEE FROM THE LONGITUDINAL STUDY WITH INCLUDING THE
FIGURE 39 VELOCITY CURVE FOR THE AGE-RELATED CHANGE OF MINERAL DENSITY IN THE SECOND METACARPAL CORTEX OF THREE REPRESENTATIVES CHIMPANZEE.. 91
FIGURE 40 VELOCITY CURVE FOR THE BODY MASS (A AND C) AND ANTERIOR TRUNK LENGTH (B AND D) GROWTH FROM THE CROSS-SECTIONAL STUDY (A AND B) AND LONGITUDINAL STUDY (C AND D) IN FEMALE (F) AND MALE (M) CHIMPANZEES...93
LIST OF ABBREVIATIONS
ANOVA analysis of variance
ATL anterior trunk length
BM body mass
BMC bone mineral content
BMD bone mineral density
BMI body mass index
CT cortical thickness
FM fat mass
FFM fat free mass
HSD honest significant difference
HWR height weight ratio
IDR Indonesian Rupiah
MCI metacarpal cortical index
NCHS National Center for Health Statistics
NHES National Health Examination Surveys
NHANES National Health and Nutrition Examination
PBF percentage of body fat
GENERAL INTRODUCTION
Background
The pattern of human growth reflects the biocultural evolution of our
species (Bogin 1999). The human pattern of growth and development
(ontogeny) appears to differ markedly from patterns of ontogeny in other
primate species. Humans present complex and sinuous growth curves for both
body mass and stature. Many bodily proportions change dramatically during
ontogeny as we reach sizes that are among the largest of living primates.
Perhaps most obviously, humans grow for a long time, with the interval
between birth and maturation exceeding that of all other primate species (Leigh
2001). In considering the evolution of biological characteristics of primates and
the interrelationships of species-specific life history, ecology, and life-style,
comparison of growth and development of those primates are essential.
Specifically, to understand the evolutionary characteristic of human life history
we need knowledges of growth and development of the closest species to
humans within extant nonhuman primates, the chimpanzee (Pan troglodytes)
(Perelman et al. 2011). At present, the knowledge of growth and development
of chimpanzee is scarce because the population accessible for the study is small,
as chimpanzees are large animals with a long lifespan and growth period.
Growth can be studied in several ways. The two basic approaches are
cross-sectional and longitudinal studies. In a cross-sectional study, individuals
are usually measured or observed only once at their given age and the total
sample may then be categorized arbitrarily into different age cohorts to produce
age-related progress of body properties. Cross-sectional analyses are
economical because the study can be carried on in a short time period. A
longitudinal study, on the other hand, involves repeated observations on the
same individuals at specific intervals over a long period of time (Malina et al.
2004). It is more difficult to conduct longitudinal than cross-sectional study
because it needs patience and takes a long time to be completed. Therefore there
are more cross-sectional studies than longitudinal studies of child growth.
2
not suitable for a fined-tuned and short-duration phenomenon such as the
growth spurt. The adolescent growth spurt in linear dimension was regarded as
unique to humans until it was also found to occur in non-human primates
(Tanner et al. 1990; Hamada et al. 1999). Nevertheless, although growth in
linear dimension is accelerated at chimpanzee puberty, the acceleration is not as
great as that in humans (Hamada and Udono 2002). It is vital to develop a way
of showing whether the chimpanzee has a real spurt or not, and of
discriminating a true spurt from acceleration due to ontogenetic plasticity.
The growth of children is important for the health of the new generation.
It most accurately reflects the health of a population (Onis and Blössner 2003)
and, in all its aspects, is of priority concern to the World Health Organization
(Onis et al. 2007). There are large between-population variation and it is now
clear that a portion of these differences is of genetic origin and a portion (in the
developing countries a large portion) is of environmental origin (Eveleth and
Tanner 1990; Ulijaszek 1993; Bogin 1999). Ulijaszek (2006) summarized
several known environmental factors that influence growth of children
postnatally. They include nutrition, infection, interactions between the two,
psychosocial stress, altitude, and climate. Most of these factors are conditioned
by socioeconomic status.
We evaluated the growth pattern of Javanese population in updating data
for infants, children and adolescence cross-sectionally to overcome the cost and
the long time period required for a longitudinal study in human growth. We
selected children (aged 4 to 20 years) from Magelang Regency, Central Java
Province Indonesia. They were observed from the viewpoint of
anthropometrical characteristics. We aim to show growth spurt of body size. A
longitudinal study in chimpanzee was used for a comparison. We analyzed the
growth pattern of body size and of the second metacarpal bone derived from a
longitudinal, repeated measurement of chimpanzee individuals aged 0 to 43.6
years. The longitudinal approach was expected to reveal growth spurt in this
species. The longer period covering older age in chimpanzee allowed us to
observe age-related changing in aging individuals. Human bone is characterized
3
postmenopausal women (Schneider et al. 1997; Osei-Hyiaman et al. 1998;
Warming et al. 2002; Ahlborg et al. 2003; Finkelstein et al. 2008; Min et al.
2010). Menopause is not a typical characteristic of chimpanzee life histories
(Thompson et al. 2007; Lacreuse et al. 2008), so it is a point of interest to see
whether or not chimpanzee experience bone loss while aging.
Objectives and Benefits
Comparative studies on growth and aging of several primates are
important to understand the evolutionary characteristic of human life history
and to provide models and insights to efforts in increasing the quality of life.
Therefore the objectives of the study are:
1. a. To evaluate the growth of body size (height and weight) in the Javanese
children aged 4 to 20 years and to compare to that of several reference
populations.
b. To evaluate the growth of body shape (somatotype) in the Javanese
children aged 4 to 20 years.
2. a. To evaluate growth of body size (anterior trunk length and body mass) in
the chimpanzee aged 0 to 43.6 years
b. To evaluate the age-related changes of the mid shaft second metacarpal
dimensions (length, width and cortical thickness) for female and male
chimpanzee aged 0 to 43.6 years using radiographs.
c. To delineate the cross-sectional and longitudinal age-related changes in
the mineral content at the mid-shaft of the second metacarpal of
chimpanzee aged 0 to 43.6 years using radiographs.
3. a. To define whether the chimpanzee has a real growth spurt in its second
metacarpal dimensions and mineral content.
LITERATURE STUDIES
Growth and Development
Growth of an individual is a dynamic process that is characterized by
physiological changes in infancy, childhood, and adolescence. These growth
periods relate to differences in various underlying genetic, hormonal and
nutritional factors and ultimately lead to differences in skeletal maturation and
development in an individual child. In a child who is physically and emotionally
healthy, and is adequately nourished, growth will proceed at a normal rate.
However, normal growth is not a uniform process and is dependent on the sex
and racial as well as ethnic background of the child. Environmental change is
also a determinant of later physiological and pathological events in growth
process (Gokhale and Kirschner 2003; Dominé et al. 2006).
Growth during infancy phase, up to the age of 2–3 years, is more rapid
than at any other time (Malina et al. 2004). It is a continuation of fetal growth.
In the neonatal phase, growth is dependent upon maternal, placental and fetal
factors (Godfrey et al. 1996). Maternal factors include maternal nutrition,
maternal size, infections and environmental exposure. Placental factors include
vascular abnormalities, placental hormones and hypoxia. Chromosomal
abnormalities or syndromes within the fetus itself also influence the fetal growth
(Resnik 2002).
The childhood phase begins around the preschool years and continues
until puberty. Many hormones, primarily growth hormone, influence skeletal
and somatic growth during this phase. Thyroxine, glucocorticoids, insulin,
oestrogens and androgens along with polypeptide growth factors also contribute
to growth. Therefore nutrition is an important component of this phase.
However, overfeeding during this phase has important implications, since it
may lead to childhood obesity and, subsequently, to obesity in adulthood, with
associated health risks (Cameron and Demerath 2002; Gokhale and Kirschner
2003).
Adolescence is the phase that begins with the onset of pubertal changes
and extends until growth and maturation are completed in adulthood. Puberty is
6
reproductive function is attained. During this period, the secondary sexual
characteristics appear, the adolescent growth spurt occurs, the gonads start to
produce mature gametes (sperm or oocytes) capable of fertilization, and major
psychological changes occur. It is generally considered that human puberty is
the result of two independent physiological processes, namely gonadarche and
adrenarche. Gonadarche refers to the activation of the ovary or testis at the end
of the prepubertal phase of development and leads to the dramatic increase in
gonadal steroid production and the completion of gametogenesis. The unfolding
of gonadarche is manifested by thelarche and menarche in girls, or by testicular
enlargement and virilization in boys. Adrenarche, on the other hand, refers to
the maturation of the adrenal cortex that leads to increased secretion of adrenal
androgens and is manifested by the appearance of sexual hair, a process termed
pubarche. It is interesting to note that adrenarche appears to be peculiar to man
and the Great Apes and the absence of adrenarche in humans do not appear to
prevent fertility or markedly to influence the timing and tempo of gonadarche.
The secretory products of the hypothalamic-pituitary-gonadal axis are the
primary modulators of the somatic changes that appear during puberty in higher
primates including man. Growth hormones are also necessary to realize the full
growth promoting effects of gonadal steroids (Terasawa and Fernandez 2001;
Garnett et al. 2004; Plant and Barker-Gibb 2004; Ebling 2005; Patton and Viner
2007).
Physical development reflects the overall patterns of growth and
morpho-functional maturation of a child. The linear dimensions of the body are
the essential indicators of physical development. The physical changes that
occur include growth acceleration and the changes in fat, muscle, and bone
mass. Anthropometry is used in characterizing growth and well-being not only
for individual assessments but also for reflecting the health status and social and
economic circumstances of populations throughout the life cycle. Actual height,
weight, and other anthropometrics dimension including skinfolds,
circumferences, and breadths serve useful purpose in assessing growth, body fat
distribution, and for provision of reference data. The World Health Organization
7
anthropometric indices. WHO adopts the reference growth charts of the
National Center for Health Statistics (NCHS) of US for international use. The
most commonly used anthropometric indexes for assessing child growth are
weight-for-height, height-for-age, weight-for-age, and mid-upper-arm
circumference. Whereas for adolescents are height-for-age, body mass index
(BMI)-for-age, and triceps and subscapular skinfold thicknesses-for-age (Onis
and Habitch 1996; Scheplyagina and Moisseyeva 2005; Borghi et al. 2006).
Evaluation of growth potential has been determining by the bone
maturation. Growth processes are characterized with age by the bone size
enlargement, the bone mineral accrual and increase of the bone mineral density
(BMD) (the bone mass). Growth velocity in standing height is the most valid
representation of rate of overall bone growth. Regional segment lengths (such as
sitting height) and limb lengths are used as measures of bone length and growth
in the axial and appendicular skeletons. Bone growth in width has received
much less attention, even though it is of paramount importance for skeletal
development. It is well known that body weight is positively associated with
bone mass. During puberty, completion of skeletal growth is occurred and
accompanied by a marked peak height velocity and increase in skeletal mass.
Approximately half of maximal adult bone mass is accumulated. It is caused by
changes in both modeling and remodeling that occur simultaneously during this
period of life. In addition, there is some suggestion that both enhanced bone
formation and decreased bone resorption contribute to the increment in bone
density. Many cross-sectional studies reported data on bone growth in relation
to age and sex (Libanati et al. 1999; Du et al. 2003; Flores-Mir et al. 2004;
Scheplyagina and Moisseyeva 2005; Nyati et al. 2006; Wells 2007).
Bone growth and maturation
Skeleton is the permanent supportive framework of the body, yet it
grows in length and width while maintaining general shape throughout life.
Skeletal maturity is a good indicator of qualitative age changes in the body
because the process goes through the same stages among different individuals.
8
with respective diaphyse are regarded as "physiological age" or "biological age"
(Tothill 1989; Gilli 1996; Flores-Mir et al. 2004). The skeleton is composed
mostly of bone tissue which may be created and modified in three major ways:
1) osteogenesis, 2) modeling and 3) remodeling. The alterations differ basically
in the tissue on which the bone is placed and the way in which osteoblasts and
osteoclasts work together (Buckwalter et al. 1995; Robling et al. 2006).
Osteogenesis is the production of bone during embryonic development
and its formation at the site of injury, for example in fracture healing.
Undifferentiated mesenchymal cells can directly differentiate into bone by the
process of intramembranous ossification, which is responsible for the formation
of most of the craniofacial skeleton. Alternatively, these osteoprogenitor cells
can differentiate into cartilage, which provides a template for bone
morphogenesis by the process of endochondral ossification; this process is
responsible for the formation of most of the vertebrate appendicular and axial
skeleton. About the time of birth, in the mammalian long bone epiphyseal plate
is formed between the primary and secondary ossification centers. Bones gain
length as long as new material (both extracellular and intracellular) keeps being
squeezed in the epiphyseal plate. Bone growth continues until the individual is
in the adulthood period or until the cartilage in the plate is replaced by bone
(Buckwalter et al. 1995; Ortega et al. 2004; Rauch 2005; Mackie et al. 2008).
Bone growth is more complicated than simple elongation or simple
enlargement. After the initial ossification of the embryonic skeleton, modeling
and remodeling are begun in each bone. In general, modeling refers to
alterations in the shape of the bone by independent action of osteoblasts and
osteoclasts while in remodeling both processes are coupled. In modeling,
osteoblasts regulate bone formation in outer (periosteal) surface and it is called
as periosteal apposition whereas osteoclasts regulate resorption in inner
(endosteal) surface. If the amount of periosteal apposition is as greater as the
endosteal resorption, it results in bone diameter enlargement, cortical
thickening, and an increased in the medullary diameter. However, if the amount
of periosteal apposition is greater than the endosteal resorption, it results in a
9
characteristic of the bone modeling (Buckwalter et al. 1995; Duan et al. 2001;
Seeman 2001; Rauch 2005; Robling et al. 2006).
In remodeling, resorption and formation occur at the same spot on a
bone surface and within the bone. In normal adult, there is a balance between
the amount of bone resorbed by osteoclasts and the amount of bone formed by
osteoblasts. Therefore, it cannot cause large changes in bone structure at a given
site. Physiological remodeling may serve to replace defected bone matrix and
play a role in mineral homeostasis. During aging, remodeling process becomes
unbalanced. There is an accelerated loss of bone mass because of the resorptive
removal of the bone matrix exceeds the bone matrix formation. It produces an
increased intracortical porosity which may reduce the bone density. In women
the decrease occurs predominantly after the menopause for reason of the decline
in the level of estrogen. As remodeling is the process responsible for bone loss
in adults, it is widely studied in the field of osteoporosis research (Buckwalter et
al. 1995; Seeman 1997; Hill and Orth 1998; Seeman 2001; Hernández-Gil et al.
2006; Rauch 2005; Robling et al. 2006).
Bone-cell function is regulated at both the systemic and the local level.
The genome and systemic hormones control bone-cell function throughout the
skeleton. Local factors, including mechanical loading, cytokines, and other
mediators, may have the most direct effect on bone-cell activity, but systemic
hormones modulate this activity throughout the skeleton. Parathyroid hormone,
calcitonin, and vitamin D can affect levels of serum calcium, partially through
their influence on bone cells. Other hormones that influence bone-cell function
include thyroxin, glucocorticoids, and estrogens. Exercise can also have both
systemic and local effects on bone (Canalis 1985; Buckwalter 1995;
Hernández-Gil et al. 2006).
Radiography in bone aging assessment
Bone aging is a way of describing the degree of bone maturation as the
skeleton changes because of growth throughout life. With age, bone size
changes and grows in length and width and yet maintain its general shape. Bone
10
by many methods, including direct observation on dry bones (Kimura 1990) and
indirect assessment on radiographical plate (Hernandez et al. 1977; Gilli 1996;
Flores-Mir et al. 2004; Thodberg et al. 2010). Morphological measurement of
bone radiographs or radiogrammetry is a relatively easy method to assess
skeletal maturation. Radiogrammetry was first introduced by Achard in 1902
who assessed the lengths and the width of the metacarpals and phalanges to
determine a factor called bone slenderness for use in comparative studies of
genetic abnormalities of the skeletal system (Parish 1966). The technique has
some advantages in simplicity, a fair degree of accuracy, most useful for
population studies, widely practicable, and non destructive. It is also available
in animal studies because the X-ray exposure time is typically less than 1
minute and therefore suitable for short-term anesthesia (Acheson 1954;
Anderson et al. 1966; Weissman 1987; Haidekker et al. 2004). Radiogrammetry
is usually carried out with a ruler or caliper. However, technological advances
made digitized and computerized radiography more accurate for measurements
(Rico et al. 1994).
In radiogrammetry, bone length (L) or axial length is measured from the
head bone to the most distal portion at the base bone (Figure 1). Another
approach uses maximum bone length which is measured from the head bone to
the two points at the base bone (most proximal portion) (Parish1966; Harris et
al. 1992). Bone diameter or bone width is measured at the midpoint of
longitudinal line along bone length. Cortical thickness can be calculated by
simple subtraction of medullary width (d) from bone width (D); (D—d)
(Dequeker 1976; Tothill 1989). Several indices are derived from basic
measurement of cortical thickness, such as Barnet-Nordin index or metacarpal
cortical index (MCI) which is the ratio of cortical thickness to the bone width;
(D—d)/D, the ratio of cortical area to total area; (D2—d2)/D2 and the ratio of
cortical area to surface area (D2—d2)/D.L. (Dequeker 1976; Evans et al. 1978;
Matsumoto et al. 1994; Ross et al. 1995).
Radiogrammetry, however, does not reliably reflect absolute bone
mineral content (BMC) and does not measure intracortical bone mineral
11
volume, mainly anatomical age-changes (Tothill 1989). The oldest and more
sophisticated method to assess bone mineral from radiograph is
photodensitometry (radiographic absorptiometry) which has been used as a
quantitative indicator of BMC for many years. The method is very sensitive to
changes in overlying tissue, and is therefore restricted to appendicular bones
(Wahner et al. 1984). This measurement reflects the rate of bone formation and
resorption which are recognized during adulthood (Harris et al. 1992; Rico et al.
1994). It also has been used extensively to estimate bone mass in the total
skeleton and sites of interest (Wahner et al. 1984).
Figure 1 Measurements made in radiogrammetry of the metacarpal. Bone
length (L) is measured from the head bone to the most distal portion
at the base bone. Bone diameter or bone width (D) is measured at
the midpoint of longitudinal line along bone length which crossed to bone axis. Mid-shaft cortical thickness is calculated by simple
subtraction of medullary width (d) from bone width (D); (D—d)
(Dequeker 1976).
The principle of photodensitometry is the quantitative measurement of
optical density in light-sensitive materials due to exposure to light. Density is
usually measured by the decrease in the amount of light permitted through a
medium. Bone consists of the mineralized matrix fashioned into a cortical shell
and trabecular network of plates within marrow cavity. Under X-ray, only the
mineralized mass of bone is seen so that the amount of the light during their
radiation through the bone is a measure of the BMC of the whole bone. A bone
12
The optical density along the cross-sectional mid-shaft bone are expressed as a
two dimensional image, densitometric pattern (Figure 2), which represent bone
mineral density (BMD). Densitometric pattern consists of the following areas:
tissue shoulder, cortical area which is mostly parallel to the X-ray beams and
inner area which represent cortical bone perpendicular to X-ray and marrow.
From the densitometric pattern the BMD is calculated as an optical density that
was previously calibrated to the step numbers on the aluminum step wedge.
BMD is expressed as the thickness of an aluminum equivalent (mm Al)
showing corresponding X-ray absorption (Seeman 2001; Haidekker et al. 2004;
Symmons 2004).
Figure 2 Densitometric pattern of a cross-sectional mid-shaft bone. Optical density is the measured amount of light permitted along a scanline (dashed white line) crossed to bone axis on an X-ray radiograph. As a result, the following areas are identified (A, A') tissue shoulder; (B, B') cortical area; and (C) inner area (cortical bone perpendicular to
X-ray and marrow) (Haidakker et al. 2004).
Importantly, each radiograph should include a step wedge or
penetrometer, a milled block of aluminum, consisting of steps of increasing (and
known) thickness (Figure 3). Step wedge is exposed together with the bone and
13
aluminum equivalents, and hence BMD. The radiographic image of a step
wedge is a series of progressively darker rectangles. Each shade of gray on the
image relates to the optical density of a known thickness of aluminum. The
number and thickness of the steps used will vary according to the optical density
of the material being examined. A wedge of 15 steps at 1 mm intervals (1–15
mm) is recommended when examining sheep or sheep-sized animals and 20
steps (1 mm/step) is recommended in human and non-human primates such as
chimpanzee (Meakim et al. 1981; Wahner et al. 1984; Matsumoto et al. 1994;
Symmons 2004).
Figure 3 Schematic representation of a step wedge and below it the radiographic image it would be expected to produce (Symmons 2004).
Metacarpal (hand-wrist bone) is commonly used as a general index of
skeletal maturity (Ives and Brickley 2004). In radiography, the metacarpal is
assessed using standard anteroposterior X-ray films of the hand. Metacarpal is
easily x-rayed with a low and save doses of radiation and shows many bones in
a single view. Its anatomical area also contains a large number of developing
osseous centers. Metacarpal bone is considered fairly representative of long
tubular bones. It provides precise information status about bone dimensions and
the site of bone resorption and apposition. Statistical tests demonstrate that the
radiogrammetic technique on metacarpal is robust, because different the
position of the bone on the film, radiographic enlargement and use of either the
left or right hand will not affect the results obtained (Onat 1997; Tothill 1989;
Ives and Brickley 2004; Barker et al. 2005). Several inspectional techniques of
14
instance Greulich and Pyle (GP) Atlas and Tanner-Whitehouse (TW2) (Acheson
1954; Cole et al. 1988; Gilli 1996; Bull et al. 1999). They are all based on the
recognition of maturity indicators, that is, of shape changes in the radiography
appearance of metacarpal bones that have been verbalized into written criteria.
In the GP, a comparison is made between metacarpal radiograph and the
corresponding standard in the atlas. This method is quick and simple to perform,
however permits only a semi-quantitative allowance for bone age and is not
applicable to non-human primates (Tanner et al. 1975; Gilli 1996; Hamada et
al. 2003). The TW2 depends on scoring the stage of bony development of 20
bones in the hand and wrist by comparison with a series of scored standards.
This method is more flexible and accurate than the atlas method since it derives
from a more solid mathematical base, but has the disadvantages of being
difficult to perform and being time-consuming (Gilli 1996).
Chimpanzee
Chimpanzee is the common name for the two extant species of ape in the
genus Pan, Pan troglodytes (common chimpanzee) and Pan paniscus (Bonobo).
They live in the tropical rain forests and the surrounding savannas in Africa.
Chimpanzee populations probably once spanned most of equatorial Africa,
including at least 25 countries. They probably numbered more than a million
just 100 years ago. Today they occur in 22 countries, and an estimate from the
World Conservation Union (IUCN) in 2003 put their numbers in Africa between
172,700 and 299,700. IUCN (2008) qualifies this taxon for Endangered under
criterion A4.
Pan troglodytes (common chimpanzee) are usually classified into four
subspecies (Gonder et al. 1997). From east to west, there are the east
chimpanzee (Pan troglodytes schweinfurthii), central chimpanzee (Pan
troglodytes troglodytes), Nigerian chimpanzee (Pan troglodytes vellurosus,
which has only a small population), and west chimpanzees (Pan troglodytes
verus). East chimpanzees are relatively smaller, and the face looks pale. West chimpanzees are relatively larger, and the face looks masked because there are
15
chimpanzees in Japan are west chimpanzees, which are the ones born in West
Africa. One-third are hybrids of the subspecies of all possible combinations of
the three major subspecies born in the human environment (Matsuzawa 2006).
However, there is a huge difference of physical appearance among individuals,
so that even the experts cannot easily determine the subspecies. Based on recent
nuclear DNA work, as well as considerations of the overall similarity in
behaviour and morphology of the proposed subspecies, Fischer et al. (2006)
argue that differences between chimpanzee populations are too small to warrant
subspecific designations.
Chimpanzees are members of the Hominidae family, along with gorillas
(Gorilla spp.), humans (Homo sapiens) and orangutans (Pongo pygmaeus).
Chimpanzees are the closest living evolutionary relatives to human (Perelman et
al. 2011). The common characters shared by Homo and Pan should have come
from their ancestors. DNA data and fossil records both suggest that there was a
common ancestor of humans and chimpanzees (including bonobos) about 5 to 6
million years ago. The characters not found in chimpanzees but found in
humans may be unique human characters acquired in the process of
hominization, the evolution of hominids departing from the human–chimpanzee
ancestor (Matsuzawa 2006). The scientific classification of chimpanzee is
shown as below (Groves 2005).
Kingdom : Animalia
Phylum : Chordata
Class : Mammalia
Order : Primates
Family : Hominidae
Subfamily : Homininae
Genus : Pan
Species : Pan troglodytes
Chimpanzees are quadripedal, so that height is not an adequate measure.
However, when they happen to take the upright posture, their height is about
120 cm in an adult male and about 110 cm in an adult female. Body weight is
16
somewhat shorter and lighter than that of at captivity (Goodall 1989) as they are
well kept and given medicine. They have much less exercise also. The
chimpanzee long arms, when extended, have a span half again as long as the
body’s height and are longer than its legs. They use them for climbing in trees.
On the ground, chimpanzees usually walk on all fours (quadripedal) using their
knuckles for support with their hands clenched, a form of locomotion called
knuckle-walking. Chimpanzee feet are better suited for walking than are those
of the orangutan because the chimpanzee’s soles are broader and the toes
shorter. They can walk upright on two legs when carrying objects with their
hands and arms.
Chimpanzees live in a group called a community or unit group. Each
community consists of multiple males and multiple females, about 20 to 100
individuals (Goodall 1989; Matsuzawa 2006). There are infants (0 to less than 4
years old), juveniles (4 to less than 8 years old), adolescents (8 to less than 12
years old), adults (12 to less than 36 years old), and olds (elders, more than 36
years old). The age category may be slightly different between the sexes and
among the communities. The interbirth interval of chimpanzees is about 5 years,
meaning that a mother gives birth to a single baby every 5 years on average.
Weaning occurs at about 4 years of age. The infants actually suckle the nipples
for such a long period. After weaning, chimpanzees reach puberty at an age of
between 8 and 12 years. The females restart the sexual menstrual cycle (about
35 days per cycle). The gestation period is about 235 days in chimpanzees, in
contrast to 280 days in humans. The chimpanzee baby is born weighing a little
less than 2 kg. During the first 5 years, the infant chimpanzee is fully taken care
of by the mother. Toward the age of 5, sexual differences of behavior become
apparent. Female juveniles have a tendency to continue to stay with the mother
and take care of the younger siblings. Male juveniles have a tendency to follow
males older than themselves. Chimpanzees have a patrilineal society. Males stay
in the natal community while females immigrate around the age of puberty.
They rarely live past the age of 40 in the wild, but have been known to reach the
17
Chimpanzee has an omnivorous diet. They use tools for getting food
during 16% of their feeding time (Yamakoshi 1998). The chimpanzees need
these tools for their survival. As the brain of a chimpanzee is about half the size
of the human brain and it is a more developed brain, chimpanzee is a more
intelligent animal. They have sophisticated hunting strategies requiring
cooperation, influence and rank; they are status conscious, manipulative and
capable of deception; they can learn to use symbols and understand aspects of
human language including some relational syntax, concepts of number and
numerical sequence; and they are capable of spontaneous planning for a future
state or event. Chimpanzees communicate in a manner similar to human
non-verbal communication, using vocalizations, hand gestures, and facial
expressions. They have emotions, such as happiness and sadness, anxiety and
THE GROWTH OF BODY SIZE AND SOMATOTYPE OF
JAVANESE CHILDREN AGE 4 TO 20 YEARS IN
MAGELANG REGENCY
Abstract
Growth of body size (body height and body weight) and somatotype in 363 girls and 299 boys aged 4 to 20 years of ethnic Javanese lived in Magelang Regency, Indonesia were studied cross-sectionally. Over half of them were categorized in the well-off family, therefore underweight or underfat prevalence in our subjects was low (14.3%) but overweight and obesity prevalence was also low (14%). They were shorter and lighter than reference children from U.S., Japan and Yogyakarta but they improved when compared with those of the same ethnic of Bantul and with the different ethnic of rural India. There was a clear age-related change of their somatotype. At the age of 4 years, the physique of children subjects in both sexes is found to be mesomorph-endomorph. Thereafter it is transformed into ectomorphic-endomorph in girls and to mesomorph-ectomorph in boys at the age of 20 years. In girl subjects, the onset of puberty was characterized by an acceleration of endomorphy component at the age of 8 years. While in our boys it was characterized by an acceleration of ectomorphy since age 9 years. The different growth pattern of somatotype components showed that the use of BMI as an indicator of fatness in children should be reassessed.
Keywords: growth, Javanese children, body size, body mass index, somatotype
Introduction
Numerous studies have been carried out in Indonesia to evaluate
variations of the principal anthropometric characteristics in relation to growth
(e.g. Adhianto & Soetjiningsih 2002; Huntsman and White 2007; Puspita 2004;
Rahmawati et al. 2004; Waters et al. 2004; Yuliana 2006; Artaria & Henneberg
2007; Hermawan 2007; Miharja 2008; Tuan & Nicklas 2009; Aryo 2011).
Growth is the best global indicator of children’s well-being. It is the single
measurement that best defines the health and nutritional status of children, just
as it provides an indirect measurement of the quality of life of an entire
population (Onis and Blössner 2003). During the human growth, the body
changes significantly in size and shape (Kalichman & Kobyliansky 2006). Body
weight and body height are the main dimensions of body size.
Based on the 2-component model of body composition (Ellis 2000),
20
component of the body. A common indicator for fat mass is body mass index
(BMI) (Dietz & Bellizzi 1999; Chakraborty et al. 2009; Kulkarni et al. 2010),
which is defined by World Health Organization (WHO) as a simple index of
weight-for-height (WHO 2006). It has been recommended as the best
measurement for monitoring overall body adiposity in the majority of
large-scales studies although BMI does not singly quantitate body fat as it
amalgamates frame size (which reflects mineral content) and lean tissue
(Roemmich et al. 1997; Fields & Goran 2000). On the other hand, skinfold thickness is widely used as a measure of fatness (Norgan 2005). It has most of
the characteristics of a good field method to measure level of fatness because it
directly measures subcutaneous fat layers. Nevertheless, a study of body weight
and height only is not always sufficient enough to produce complete
information regarding child physique and growth (Özener & Duyar 2008).
Independent of body size, a somatotype is a convenient shorthand
descriptor of overall physique in terms of body shape and composition (Carter
1996). It reflects an overall outlook of the body and conveys a meaning of the
totality of morphological features of the human body (Singh et al. 2007). A
three-exact decimal score of component of somatotype refers to endomorphy
(representing relative fatness), mesomorphy (representing relative muscularity)
and ectomorphy (representing relative linearity) (Carter 2002). Somatotype has
often been used to study morphometric variations in human body (Singh et al.
2007). Changes in somatotype components during the growth period can
provide useful information about the growth status and the timing and rate of
sexual maturation (Beunen et al. 1987; Hebbelinck et al. 1995; Toselli & Gruppioni 1999). Many studies were carried out in the Caucasoid children
(Gakhar & Malik 2002; Ghosh & Malik 2004; Kalichman & Kobyliansky 2006;
Bhasin & Jain 2007; Singh et al. 2007; Özener & Duyar 2008; Ventrella et al.
2008). Studies on somatotype in Indonesian children had not been well
described excepting some reports from Rahmawati et al. (2004) and Aryo
(2011).
Indonesia has a wide variety of ethnological groups so it is important to