IMPACT OF FLOOD IN JAKARTA AND HAIYAN TYPHOON IN PHILIPPINES TOWARD INDONESIA STOCK EXCHANGE AND
THE PHILIPPINE STOCK EXCHANGE 2013
Alethea Natasha Maharani
Alexander Jatmiko Wibowo
Management Program, Faculty of Economics Universitas Atma Jaya Yogyakarta Jalan Babarsari 43-44, Yogyakarta
ABSTRACT
This research aimed to know the impact of flood in Jakarta and Haiyan Typhoon in Philippines towards each stock market in two countries in 2013. By using phenomenon which is happened, event study will be conducted to know the significant impact on its Average Abnormal Return on each country. In order to know the result, it will used by calculating Abnormal Return which is get from the Return of companies’ stock return on daily basis in the event period of different country. The result will be tested by using paired samplet-test, to know which is the before and after event in Indonesia and Philippines have significant impact or not in the its abnormal return. The findings of this research, there is no significant different average abnormal return between before event day and after event day of both natural disaster events in Indonesia and Philippines.
Keywords:Abnormal Return, Efficient Market Hypothesis, Event Study, Stock Market. I. Introduction
A. Background
Jakarta which has five-year cycle of big floods was come to early 2013 that made Jakarta being under water again (www.antaranews.com). According to the history of major flooding in Jakarta that was happened in 1621, 1654, 1918, 1976, 1996, 2002, 2007 and last of big flood is in 2013 (www.gfdrr.org). Caused of flood in Jakarta, in generally could be from two factors, which are natural factors and human factors. Heavy monsoon rain triggered severe flooding in large swathes of the Indonesian capital, Jakarta, on Thursday, bringing the city to a stop with many government offices and businesses, most of them was forced to close because their staffs could not get to work (www.reuters.com).
development of economic growth of Indonesia, it can attract investors to take a role in investment activity in Indonesia Stock Exchange (www.thejakartaglobe.com).
The sheer magnitude of the super-typhoon that ripped through the middle of the archipelago on November 8, 2013 was unprecedented, with sustained winds of 250 kilometers per hour or 160mph (www.economist.com). The storm tracked across the Visayas region, bringing high winds, torrential rain and storm surge, ultimately impacting up to 16 million people (www.disasterphilanthropy.org).
Philippine Stock Exchange Index (PSEi) it the main stock market index of the Philippines. This index is home of major public companies in Philippines (www.levali2001.hubpages.com). The Philippine Stock Exchange has integral role in Philippines economy. This stock exchange consolidates and updates all of companies which has role to raise capitals by bringing in this securities. It lists all enterprises and respective shares. It also records each of their finances, growth of funds, expansion, and development of new companies’ activities (www.en.wikipilipinas.org).
As cited on Kim’s research (2004), the expected return on an investment, either by an individual investor or a company, is determined by the future possible returns that could occur from making investment (Keown et al., 2001). Because of lifestyle of people who lived in the world of uncertainty, risk must be considered in the process of making decision for some investment activity (Kim and Gu, 2004). Those events that already happen will give affect especially for country that got those kinds of several events. According to Aktas and Oncu (2006), in finance, Efficient Market Hypothesis (EMH) is widely tested proposition by researchers. An implication of EMH is that market prices reflect all available information and expectations, and that any new information is properly incorporated into prices without any delay.
B. Problem Statements
This research will try to analyze the impact of natural disaster on certain country to its Stock Exchange. In several researches, stock price will behave differently if there is new information that has possibilities to affect investor’s thought. Based on the research background above, problem statements will be conducted as follow:
1. Is there any difference in Average Abnormal Return between before event day and after event day of Jakarta Flood toward Indonesia Stock Exchange?
2. Is there any difference in Average Abnormal Return between before event day and after event day of Haiyan Typhoon toward the Philippine Stock Exchange?
C. Research Objectives
a. To examine whether before event day and after event day of Flood in Jakarta in 2013 have different average abnormal return in Indonesia Stock Exchange or not.
b. To examine whether before event day and after event day of Haiyan Typhoon in Philippine which was happen in 2013 have average abnormal return in The Philippine Stock exchange or not.
II. Theoretical Background A. Theoretical Background
brought. Capital market also can be classified into 2 types, depend on whether securities are being sold initially by their issuing company or by intervening owners such as primary market and secondary market.
Efficient Market Hypothesis (EMH) is when new information is very rapidly processed so that securities are properly priced at any given time. Efficient Market Hypothesis assumes that information travels in a random independent way and that prices are an unbiased reflection of all currently available information (Hirt and Block, 2006). Efficient capital market can be seen if security price adjust rapidly to the infusion of new information, and, therefore, current security prices fully reflect all available information (Reilly and Brown, 2005). Cumulative levels of market efficiency and the information associated with each of three classifications were introduced by Fama in 1970 (Jones, 2010), such as weak form, semistrong form, and strong form.
According to Reilly and Brown (2005), event studies is studies that examine abnormal rates of return for a period immediately after an announcement of several economic event that will influencing stock price itself, such as stock split, a proposed merger, or stock or bond issue, to determine whether an investor can derive above-average risk-adjusted rates of return by investing after releasing of its public information.
Because of the significance of the efficient markets hypothesis to all investor, and also many controversies in Efficient Market Hypothesis (EMH), there is an idea of how these test are done, and some generalized notion of results. In each form or type of Efficient Market Hypothesis, it will be introduced each step to test it in difference method (Jones, 2010).
Abnormal Return is difference of actual return with the expected return. In other hands, after adjusting for what the company’s return should have been, abnormal return itself will representing the impact of particular events (Jones, 2010).
ܣܴ௧ =ܴ௧−ܧ(ܴ௧)
Where,
ARit= the abnormal rate of return for securityiduring periodt Rit= the actual rate of return on securityiduring periodt
E(Rit) = the expected rate of return for securityiduring periodt,based on an index model relationship
According to Hirschey and Nofsinger (2008) other approaches to test Efficient Market Hypothesis by using the CAPM’s (Capital Assets Pricing Model) SML (Security Market Line), which is has characteristic as al linear risk-return trade-off for individual stocks. The SML also shows about how the Expected Return,E(Ri), can be determined as a simple function of systematic risk. Systematic risk itself can be defined as the measurement of return volatility of individual stock is tied to overall market and it can be said also as unavoidalbel volatility, and also measured by beta (β). In other hands, unsystematic risk is the measurement of return volatility of individual stock specific to an individual company. So, the SML formula of Expected Return,E(Ri), can be written as:
ܧ(ܴ) =ܴி+ߚ(ܴெ−ܴி) Where,
E(Ri)= Expected Return of stock companyi βi = Beta of companyi
RF = Risk Free rate
The Indonesia Stock Exchange (IDX) is a stock exchange headquartered in Jakarta as a capital city of Indonesia. It was previously known as Jakarta Stock Exchange (JSX) before it name has been change in 2007 because it merged with Surabaya Stock Exchange (SSX) (www.rimes.com). Indeks Harga Saham Gabungan (IHSG) or Jakarta Composite Index (JCI) is an index of all listed stocks and thus forms the main indicator of the Bursa Efek Indonesia or Indonesia Stock Exchange (www.indonesia-investment.com).
The Philipphine Stock Echange Inc. (PSE) as the national stock exchange of Philippines have a role to charges listing fees for initial public offerings and additional listings, and for annual listing maintenance. Other sources of its revenus was come from membership, transaction, data fedd and misscelaneous fees, including service fees (www.reuters.com).
Chen, Bin, Chen. (2005) in this study investigates possible impact of political events on Taiwan’s stock market by comparing different firm’s ownership. By using two kinds of methods, such as abnormal return and MVRM, it found that political events give insignificant reaction on its stock return. Huang, Ho, Wu. (2007) tried to investigate the impact of Asian Tsunami to tourism-related industry in several countries in Asia. It can be conclude that this event give negative impact on tourism-related industry in Thailand Stock Market, but positive impact on abnormal return on Taiwan Stock Market. Kim, Hyunjoon and Zheng Gu. (2004) studied about the impact of 9/11 events in U.S. to risk and return of airline stocks stated that 9/11 terrorist attack found that this event give more risks of airlines stocks both systematic and total risk. Alam, Abdullah. (2013) researched several terrorism events that was happen in Pakistan for several years. By using Terrorism Impact Factors (TIF) as their main study, he found that terrorism factor give negative impact on stock market returns in long run. Bolak and Süer. (2008) found that event of Marmara Earthquake have negative impact to its abnormal return and also have significant results to its abnormal return also. Especially on Financial Institution which is listed in its stock exchange by using market adjusted model in order to see its abnormal return. Wang, Lin. (2011) conducted research about natural disaster which was happen in Japan during year 2011 with Generalized Autoregressive Conditional Heterokedasticity (GARCH) and GARCH-in-the-mean models. He found that impact of natural disasters on Japanese stock return is not linear, but indirect through changes in volatility.
B. Hypothesis Development
Based on theoretical background and previous research above, researcher will make two hypotheses that can be develop from this research. Those two hypotheses are: H1: There is different Average Abnormal Return between before event day and after event day of flood in Jakarta toward Indonesia Stock Exchange.
H2: There is different Average Abnormal Return between before event day and after event day of Haiyan Typhoon toward the Philippine Stock Exchange.
III. Research Methodology
necessary to do because it will help us to know about the data sample distribution, whether the data sample is normally distributed or not. By using SPSS software, the normality of the data sample distribution will be known. To see the result of normality test, it can be evaluated by seeing the result of Komolgorov-Smirnov test of normality. There are two kinds of criteria to see whether the sample data distribution is normally distributed or not, which are (Santoso, 2012):
1. Sig. Value or significant value or probability value < 0.05, distribution data is abnormal (symmetry).
2. Sig. Value or significant value or probability value > 0.05, distribution data is normal (symmetry).
After make normality test, if the data sample is normally distributed, paired sample t-test will be used to testing hypotheses. In order to testing hypotheses, paired samplet-test is used generally in condition to test whether the result is significant or not, and to evaluate the significance difference of before and after event. After the data already compiled, researcher will test the Average Abnormal Return (AAR) before and after certain event. According to McClaveet al.(2011) to test statistics can be formulated as follow:
ݐ=ݔ̅ −ߤ
ݏ/√݊
In this t-test, researcher will use SPSS as a tool to know about the result whether it will accept or reject the hypotheses. Degree of freedom which is used isn-1. After that, researcher will use significant level or α=5% or 0.05. Based on Santoso (2012), the criteria will be used to know the result of hypotheses is:
1. P value (Sig. Value) > 0.05, so Ho is accepted. 2. P value (Sig. Value) < 0.05, so Ho is rejected.
If the Ho is accepted, so it means that there is no significance difference of after and before event. But, if the Ho is rejected, it means that there is significant difference of after and before event.
In other hands, if the data sample is not normally distributed, non-parametric test will be used in order to test the hypothesis. Non-parametric test which can be used is paired sample Wilcoxon Signed-Rank test (Santoso, 2012). Researcher will used significant level or α=5% or 0.05. Based on Santoso (2012), the criteria will be used to know the result of hypotheses is:
1. Probability > 0.05, so Ho is accepted. 2. Probability < 0.05, so Ho is rejected. IV. Data Analysis and Results
A. Analysis of Result Processing Data
For conduct this research, in order to find about the impact of flood in Jakarta towards Indonesia Stock Exchange, close daily closing price data from companies listed in LQ45 will be used, because this companies will reflect all market activity in Indonesia. In other hands, for conduct the research for impact of Haiyan Typhoon in Philippines toward The Philippine Stock Exchange, daily closing price from companies listed in PSE30 index will be used. As Indonesia, this index will reflect market activity in Philippines.
above will be used to know about the Abnormal Return which is commonly used to do even study like will be done in this research. For calculating Abnormal Return, data which were used is daily closing price for companies which in listed in LQ45 and PSE30. The period for choosing the data also will be different from Indonesia and Philippine because they were in two different events with two different times. The mostly data that will be used for Indonesia will be taken from www.finance.yahoo.com and mostly data for Philippine will be taken from www.wsj.com. Daily closing price not just used to find about Abnormal Return (AR), but also to find out about the beta of company. The other data such as risk free rate also will be used to conduct this research from both countries.
For conduct this research, first of all, we must determine the event period to be done:
a. T01-10 = 10 days before day, or December 27, 2012 b. T01= when event happen in Jakarta, January 15, 2013 c. T01+10 = after event, January 30, 2013
d. T02-10 = 10 days before event in Philippines, November 8, 2013 or October 23, 2013 e. T02= when event happen for Philippine, November 8, 2013
f. T02+ 10 = 10 days after event in Philippines, November 22, 2013
For this research, stock price data in Indonesia and Philippines will be chosen until the past event already happens because researcher thought that the impact would affect Stock Exchange market until that time. This data only use trading day from Sunday until Monday except weekend and Holiday.
After the data already got, the next step is finding the beta for each company. To find the beta, researcher will be used regression method by choosing Ordinary Least Square in Microsoft Excel. Like in Pefindo, to determine Beta (β) three years data for each company daily stock return and three years data for daily stock market return must be used. After make some regression, to know about the value of Beta (β) it can be seen in intercept of regression results.
The next step is calculated the expected return based on index model relationship, such as following equation below:
1. Expected Return (Hirschey and Nofsinger, 2008)
ܧ(ܴ) =ܴி+ߚ(ܴெ−ܴி) Where,
E(Ri) = Expected Return of stock companyi βi = Beta of companyi
RF= Risk Free rate
RMt = the market rate of return
To conduct this calculation, using Microsoft Excel will be important to know the results. All the calculation will be provide in appendix. In order to conduct this formula, Risk Free (RF) data will be used which is taken from www.bi.go.id for T-Bills of Indonesia which is monthly basis on December, 2012 which is 4.80274% and on January, 2013 which is 4.84021%. And for the Philippine T-Bills, it can be found in Philippine Bureau of Treasury in internet by using monthly basis on October, 2013 which is 0.122% and on November, 2013 which is 0.119%.
2. Abnormal Return (Jones, 2010)
ܣܴ௧ =ܴ௧−ܧ(ܴ௧)
ARit= the abnormal rate of return for securityiduring periodt Rit= the actual rate of return on securityiduring periodt
E(Rit) = the expected rate of return for securityiduring period t,based on an Capital Asset Pricing Model.
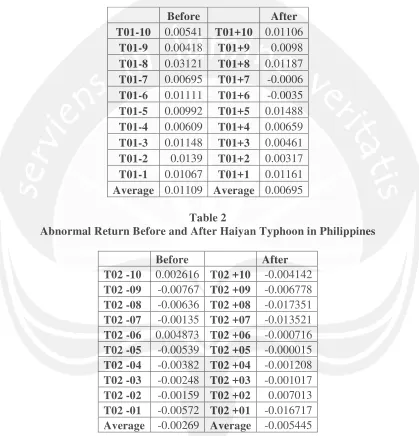
Table 1
Abnormal Return Before and After Flood in Jakarta
Before After
[image:7.595.90.509.193.629.2]T01-10 0.00541 T01+10 0.01106 T01-9 0.00418 T01+9 0.0098 T01-8 0.03121 T01+8 0.01187 T01-7 0.00695 T01+7 -0.0006 T01-6 0.01111 T01+6 -0.0035 T01-5 0.00992 T01+5 0.01488 T01-4 0.00609 T01+4 0.00659 T01-3 0.01148 T01+3 0.00461 T01-2 0.0139 T01+2 0.00317 T01-1 0.01067 T01+1 0.01161 Average 0.01109 Average 0.00695
Table 2
Abnormal Return Before and After Haiyan Typhoon in Philippines
Before After
T02 -10 0.002616 T02 +10 -0.004142 T02 -09 -0.00767 T02 +09 -0.006778 T02 -08 -0.00636 T02 +08 -0.017351 T02 -07 -0.00135 T02 +07 -0.013521 T02 -06 0.004873 T02 +06 -0.000716 T02 -05 -0.00539 T02 +05 -0.000015 T02 -04 -0.00382 T02 +04 -0.001208 T02 -03 -0.00248 T02 +03 -0.001017 T02 -02 -0.00159 T02 +02 0.007013 T02 -01 -0.00572 T02 +01 -0.016717 Average -0.00269 Average -0.005445
If we see closely in certain days, all of average abnormal return before flood in Jakarta shows its positive average abnormal return. In other hands, mostly average abnormal return after flood in Jakarta shows its positive average abnormal return, but there were two days which is show its negative abnormal return in 6 days (-0.0035) and 7 days (-0.0006) after Flood in Jakarta. The highest number of Average Abnormal Return for Before Flood in Jakarta was 0.0312 on 8 days before. While for lowest number of Average Abnormal Return before Flood in Jakarta was 0.0041 on 9 days before. In other hands, the highest number of Average Abnormal Return after Flood in Jakarta was 0.01488 on 5 days after. While for the lowest number of Average Abnormal Return was -0.0035 on 6 days after event.
Table 2 shows the Average Abnormal Return for Philippines before Haiyan Typhoon and After Haiyan Typhoon. If we see from average from all average abnormal return both before Haiyan Typhoon and after Haiyan Typhoon, its show negative value of average abnormal return. It shows that average abnormal return before Haiyan Typhoon is -0.00269, whether after Haiyan Typhoon is -0.005445. In other hands, there was an indication which is any increasing number of negative abnormal return. It can be conclude that information can affect the stock pricein the Philippine Stock Market in Philippines, especially after Haiyan Typhoon.
If we see closely, mostly average abnormal return before Haiyan Typhoon in Philippines have negative average abnormal return. There were two days which is showed its abnormal return 10 days before (0.002616) and 6 days (0.004873) after Haiyan Typhoon in Philippines. It was also the same happen in data of average abnormal return of Philippines after Haiyan Typhoon. Mostly average abnormal return showed its negative value except for 2 days after event (0.007013) which is showed its positive value. The highest number of Average Abnormal Return for Haiyan Typhoon in Philippines was 0.00487 on 6 days before. While for lowest number of Average Abnormal Return before Haiyan Typhoon in Philippines was -0.00767 on 9 days before. In other hands, the highest number of Average Abnormal Return after Haiyan Typhoon in Philippines was 0.00701 on 2 days after. While for the lowest number of Average Abnormal Return after Haiyan Typhoon in Philippines was -0.0173 on 8 days after event. If we compare between the Average Abnormal Return between Indonesia and Philippines during event period, it can be conclude that Indonesia Average Abnormal Return moved fluctuate, but most of all its Average Abnormal Return has positive value. In other side, Average Abnormal Return of Philippine during event period also moved fluctuate but it has negative value.
that on 2013 was the year when Jakarta could suffer big flood because of its cylce of five-years (www.antaranews.com).
Other result also shows about the Abnormal Return in event period of Philippines. Based on table above, there were significant results in before days of event period which were happen in day -5 and -9. But, mostly Abnormal Return before event days shows not significant impact on the days before event. It means that because of no event happen at that time, so there were no bad information would give impact to the abnormal return. Most of the data is not significant because many people could not predicted the Haiyan Typhoon. Scientist also said that Super Haiyan thypoon is impossible to predicted, it could came whenever it was, so many people could not anticipate the thypoon (www.voiceofrussia.com).
For after event period in Indonesia, there were significant results in several days, such as day +1, +4, +5, +8, +9, and +10. It means that in those days after event, bad information for some news related to flood in Jakarta will affect the abnormal return, especially several news which were contain bad information. It can be happened because many companies were suffer high loss caused by flood in Jakarta which were reach until Rp 1 trillion (www.lampost.com). In other hands, not significant results also showed in day +2, +3, +6, and +7. It means that there is no significant effect for flood in Jakarta on those days. In this condition, this information did not make any influence in the abnormal return.
In other hands, after event period of Haiyan Typhoon in Philippines also shows the significant results which were happen on +1, +7, +8, and +9. It means that the report in those days which were containing bad information will affect the abnormal return. It can be happened beacuse this typhoon missed the country’s main commercial and industrial centers (www.businesinsider.com).But, not significant result also showed in days +2, +3, +4, +5, +6, and +10. In other words, it can be known that mostly results showed it not significant results; it means that event of Haiyan Typhoon in Philippines as a majority would not give significant impact to the abnormal return of stocks in Philippines.
B. Analysis of Result Hypothesis Testing
Hypothesis One for this paired sample t-test can be made as follow:
Ho:There is no significance different average abnormal return between before event day and after event day of flood in Jakarta toward Indonesia Stock Exchange.
H1: There is different average abnormal return between before event day and after event day of flood in Jakarta toward Indonesia Stock Exchange.
IfHois accepted, it means the result is not significant. But, if theHois rejected, it means that the result is significant. By using SPSS Software, paired sample t-test will be chosen. The result of this test showed that the value of Sig. is 0.178, it means that the value of Sig. (2-tailed) > 0.05 (α=5%), so Ho is accepted, it means that there is no significance difference of Average Abnormal Return before and after Flood in Jakarta.
Hypothesis Two for this paired sample t-test can be made as follow:
Ho:There is no significance different average abnormal return between before event day and after event day of Haiyan Typhoon toward the Philippine Stock Exchange.
IfHois accepted, it means the result is not significant. But, if theHois rejected, it means that the result is significant. By using SPSS Software, paired sample t-test will be chosen. The result of this test showed that the value of Sig. is 0.274, it means that the value of Sig. (2-tailed) > 0.05 (α=5%), so Ho is accepted, it means that there is no significance difference of Average Abnormal Return before and after Haiyan Typhoon in Philippines.
From the result of comparison Average Abnormal Return before and after event period in Indonesia and Philippines, it can be concluded that there is no significant impact between before and after event period in two countries. It can be said also that the natural which is happen in certain country, especially in developing countries. Although several company suffered loss, but there was no further impact in the return of the stock for most of all companies in Indonesia and Philippines. It can be happen because not all of the industry could get direct impact from the disaster. In other hands, just for certain industry which is not too many in the stock market could get direct impact from the disaster.
Based on the hypothesis testing above, this test was supported the research result from Chen, et al (2005) which was stated that political events give insignificant reaction on its stock return. in other hands, there was finding which was stated that there is positive abnormal return in tourism-related industry in Thailand stock market, but positive impact on Taiwan Stock Market based on event of Tsunami Attacks on 2005 (Huang, et al, 2007). Abdullah (2013) also found that there is negative impact to its abnormal return because of Marmara Earthquake. Other research also found that results of mean weekly return of the airline companies did not change significantly in the post-9/11 60-week period. (Kim and Gu, 2004).
V. Conclusion and Implication A. Conclusion
As a big city in Indonesia, Jakarta is playing important role as a city which has 240 million populations and also as a place of political and economic center of Indonesia. All of business activity was done in Jakarta; especially Jakarta is the location of Indonesia Stock Exchange which is nowadays shows good movement to further influence on global markets. But, Jakarta is the one of city in Indonesia that usually experienced big flood in every five years. Because of this disaster, it can cause the high loss for big companies and also it can influence the return of stock price in Indonesia Stock Exchange.
As a developing country in South East Asia, Philippines is the one of country which shows its good movement. Especially, The Philippine Stock Exchange has integral role in Philippines economy. But, unfortunately, last November 2013 was the bad day for Philippines because they were experienced Haiyan Typhoon. Haiyan Typhoon was attack most of side in Philippines and also killed many people. Because of it, several big companies experienced high loss and also gave impact to the Philippines Stock Exchange.
was happen in certain country, so, most of all research will used the event study to know the impact towards the stock market.
In this research, there was some evidence which is found that there were any negative and positive abnormal return in Indonesia and Philippines based on the event period. After make some hypotheses testing, this finding can answered two problem statements. For the first hypothesis, the hypothesis is not supported because the findings of the research is no significant different average abnormal return between before event day and after event day of flood in Jakarta toward Indonesia Stock Exchange. Meanwhile, for second hypothesis, the hpothesis also not supported because the findings of the research is no significant different average abnormal return between before event day and after event day of Haiyan Typhoon toward the Philippine Stock Exchange. B. Implication
As mention is Chapter I, the result of this research will give more benefit to: a For Readers
Readers can know about the impact of natural disaster to the stock return activity, which is this event will give impact or not by see the result of the difference of Average Abnormal Return between before and after event period.
b For Investor
Investor can make some expectation for future investment in stock market based on result of this research. For example, if natural disaster like this event will give positive or negative average abnormal return and whether the natural disaster will give different impact on before and after event.
c. For Academic
BIBLIOGRAPHY
Aceh Traffic. (2013). “Sejarah Banjir Jakarta,” accessed from http://www.acehtraffic.com/2013/01/sejarah-banjir-jakarta.html?m=1, March 6, 2014. Aktas and Oncu. (2006). “The Stock Market Reaction to Extreme Events: the Evidence from
Turkey”, International Research Journal of Finance and Economics, vol. 6.
Alam, Abdullah. (2013). “Terrorism and Stock Market Development: Causality evidence from Pakistan”, Journal of Financial Crime Vol. 20 No.1.
Bisara, Dion and Hotman Siregar. (2013). “Jakarta Suffering Huge Economic Losses Due to Floods: Kadin”, accessed from http://www.thejakartaglobe.com/archive/jakarta-suffering-huge-economic-losses-due-to-floods-kadin/, March 6, 2014.
Bodie, Kane, and Marcus. (2004). “Essentials of Investment”. Singapore: McGraw-Hill International.
Bolak and Süer. (2008). “The Effect of Marmara Earthquake on Financial Institution”. Journal of DoğuşÜniversitesi Dergisi, 9 (2) 2008, 135-145.
Boswaro, Ery. (2013). “The Flooding city of Jakarta”, accessed from http://www.gfdrr.org/sites/gfdrr.org/files/%28SESSION_2%29_Ery_Boswaro_%28Indon esia%29_BPBD_DKI_JAKARTA.pdf, March 6, 2014.
Brahmana, Elizabeth Gloria. (2013). “Indonesian Stock Market Boasts Huge Growth Potential: Director”, accesed from http://www.thejakartaglobe.com/business/indonesian-stock-market-boasts-huge-growth-potential-director/#.UxvFiptCofM, March 9, 2014.
Chen, Bin, Chen. (2005). “The Impacts of Political Events on Foreign Institutional Investors and Stock Returns: Emerging Market Evidence from Taiwan”, International Journal of Business, 10(2).
CNN Staff. (2013). “Typhoon Haiyan Death Toll Tops 6,000 in the Philippines,” accessed from http://edition.cnn.com/2013/12/13/world/asia/philippines-typhoon-haiyan/, March 6, 2014.
Economist. (2013). ”One of the Strongest Storm Ever Recoded Has Devastated Parts of the Philippines, and Relief is Slow to Arrive”, accessed from http://www.economist.com/news/asia/21589916-one-strongest-storms-ever-recorded-has-devastated-parts-philippines-and-relief, March 6, 2014.
Goodyear, Sarah. (2013). “Flooding in Jakarta: A City Swamped by Its Own Success”, accessed from http://www.theatlanticcities.com/jobs-and-economy/2013/01/flooding-jakarta-city-swamped-its-own-success/4426/, March 6, 2014.
Hermawan. (2013).“Prediksi Banjir Wilayah DKI Jakarta Bulan Januari dan Februari 2013”, accessed from http://uniqpost.com/57945/prediksi-banjir-wilayah-dki-jakarta-bulan-januari-dan-februari-2013/, May 29,2014.
Holliday, Katie. (2013). “Typhoon Haiyan: Will it Derail Philippines’ Economy?”, accessed from http://www.nbcnews.com/business/economy/typhoon-haiyan-will-it-derail-philippines-economy-f2D11577218, March 11, 2014.
Huang, Ho, Wu. (2007). “The Impact of the Asian Tsunami Attacks on Tourism-Related Industry Stock Returns”, Journal of American Academy of Business, Cambridge.
Jakarta Globe. (2014). “Jakarta Flooded Again After Night of Heavy Rain,” accessed from http://www.thejakartaglobe.com/news/jakarta/jakarta-flooded-again-after-night-of-heavy-rain/, March 6, 2014.
Jones, Charles P. (2010). “Investments Principles and Concepts”. Eleventh Edition, Asia: John Wiley & Sons (Asia) Pte Ltd.
Kim, Hyunjoon and Zheng Gu. (2004). “Impact of the 9/11 terrorist attack on the return and risk of airline stocks”, Tourism and Hospitality Research p. 150.
Lampost. (2013). “Kerugian Industri Akibat Banjir Jakarta Capai Rp 1 Trilliun”, accessed from http://lampost.co/berita/kerugian-industri-akibat-banjir-jakarta-capai-rp1-triliun, March 6, 2014.
Liaw. (2004). “Capital Markets”, USA: Thompson.
McClave, Benson, and Sincich. (2011). “Statistics for Business and Economics”, Eleventh Edition, USA: Pearson Education, Inc.
McMillan, Pinto, Pirie, and Venter. (2011). “Investment: Principles of Portfolio and Equity Analysis”, USA: John Wiley & Sons, Inc.,
Milenin, Grigory. (2013).“Typhoon Haiyan was impossible to predict-experts”, accessed from http://voiceofrussia.com/2013_11_11/Typhoon-Haiyan-was-impossible-to-predict-experts-6670/, May 29, 2014.
Reilly and Brown. (2005). “Investment Analysis and Portfolio Management”, Canada: South-Western, Nelson Education, Ltd.
Reuters. (2013). “Indonesia Floods”, accessed from
RH, Priyambodo. (2012). “5-year Cycle of Big Floods Feared to Hit Jakarta in 2013,” accessed from http://www.antaranews.com/en/news/86351/5-year-cycle-of-big-floods-feared-to-hit-jakarta-in-2013, March 6, 2014.
Ross, Westerfield, and Jaffe. (2010). “Corporate Finance”, Ninth Edition, Singapore: McGraw-Hill/Irwin.
Tampubolon, Hans David. (2013). “Officials Fret Over Inflation, Severe Business Impact of Flood Crisis”, accessed from http://www.thejakartapost.com/news/2013/01/18/officials-fret-over-inflation-severe-business-impact-flood-crisis.html, March 6, 2013.
Sekaran, U. and Bougie, Roger. (2010). “Research Methodology for Business”, West Sussex: John Willey & Sons Ltd,.
Sharpe, Alexander, and Bailey. (1995). “Investment”, New Jersey: Prentice Hall, Inc.
Wibowo, Rahayu, and Hamzah. (2013). “Menghitung Kerugian Akibat Banjir Bandang di Jakarta”, accessed from http://m.news.viva.co.id/news/read/383471-menghitung-kerugian-akibat-banjir-bandang-di-jakarta, March 11, 2014.