INDONESIAN JOURNAL OF ELECTRICAL ENGINEERING AND COMPUTER SCIENCE Indonesian Journal of Electrical Engineering and Computer Science (p-ISSN: 2502-4752, e-ISSN: 2502-4760) (formerly TELKOMNIKA Indonesian Journal of Electrical Engineering, p-ISSN 2302-4046, e-p-ISSN 2460-7673), is a monthly peer reviewed International Journal in English, indexed by Scopus, EI (INSPEC, IET), Google Scholar Metrics, ProQuest, EBSCO, DOAJ, BASE, OALib, SHERPA/RoMEO etc. The aim of this journal is to publish high-quality articles dedicated to all aspects of the latest outstanding developments in the field of electrical engineering. Its scope encompasses the applications of Telecommunication and Information Technology, Applied Computing and Computer, Instrumentation and Control, Electrical (Power), and Electronics Engineering.
EDITORIAL TEAM Advisory Editors
Prof. Hamid A. Toliyat, Texas A&M University, United States Prof. Patricia Melin, Tijuana Institute of Technology, Mexico Prof. Neil Bergmann, The University of Queensland, Australia Dr. Argyrios Zolotas, University of Lincoln, United Kingdom Prof. Aurelio Piazzi, University of Parma, Italy
Prof. Daniel Thalmann, Nanyang Technological University, Singapore Prof. Ajith Abraham, VSB Technical University of Ostrava, Czech Republic Editor-in-Chief
Tole Sutikno, Universitas Ahmad Dahlan, Indonesia Co-Editors-in-Chief
Prof. Dr. Leo P. Ligthart, Delft University of Technology, Netherlands
Prof. Dr. Omar Lengerke, Universidad Autónoma de Bucaramanga, Colombia Assoc. Prof. Dr. Wanquan Liu, Curtin University of Technology, Australia Dr. Arianna Mencattini, University of Rome "Tor Vergata", Italy
Dr. Auzani Jidin, Universiti Teknikal Malaysia Melaka (UTeM), Malaysia
Mark S. Hooper, Analog/RF IC Design Engineer (Consultant) at Microsemi, United States Editors
Prof. Dr. Faycal Djeffal, University of Batna, Batna, Algeria Prof. Dr. Luis Paulo Reis, University of Minho, Portugal
Prof. Dr. Sanjay Kaul, Fitchburg State University, United States Prof. Dr. Sotirios G. Ziavras, University Heights, United States
Prof. Dr. Srinivasan Alavandar, CK College of Engineering and Technology, India Prof. Dr. Tarek Bouktir, Ferhat Abbes University, Setif, Algeria
Prof. dr.sc. Maja Stula, University of Split, Croatia
Assoc. Prof. Dr. Nik Rumzi Nik Idris, Universiti Teknologi Malaysia, Malaysia Assoc. Prof. Dr. Lunchakorn Wuttisittikulkij, Chulalongkorn University, Thailand Assoc. Prof. Dr. Jumril Yunas, Universiti Kebangsaan Malaysia, Malaysia Asst. Prof. Dr. Ahmet Teke, Çukurova University, Turkey
Asst. Prof. Dr. Ehsan O. Sheybani, Virginia State University, United States Asst. Prof. Dr. Supavadee Aramvith, Chulalongkorn University, Thailand Dr. Ahmad Saudi Samosir, Universitas Lampung (UNILA), Indonesia
Dr. Ahmed Boutejdar, German Research Foundation DFG Braunschweig-Bonn, Germany Dr. Ahmed Nabih Zaki Rashed, Menoufia University, Egypt
Dr. Han Yang, University of Electronic Science and Technology of China, China Dr. Munawar A Riyadi, Universitas Diponegoro, Indonesia
Dr. Nidhal Bouaynaya, University of Arkansas at Little Rock, Arkansas, United States Dr. Peng Peng, Seagate Technology, Bloomington, MN, United States
Dr. Shahrin Md. Ayob, Universiti Teknologi Malaysia, Malaysia Dr. Surinder Singh, SLIET Longowal, India
Dr. Tutut Herawan, Universiti Malaysia Pahang, Malaysia
Dr. Vassilis S. Kodogiannis, CEng, University of Westminster, United Kingdom Dr. Yin Liu, Symantec Core Research Lab, United States
EDITORIAL POLICIES Focus and Scope
The aim of TELKOMNIKA Indonesian Journal of Electrical Engineering is to publish high-quality articles dedicated to all aspects of the latest outstanding developments in the field of electrical engineering. Its scope encompasses the applications of Telecommunication and Information Technology, Applied Computing and Computer, Instrumentation and Control, Electrical (Power), Electronics Engineering and Informatics which covers, but not limited to, the following scope:
Signal Processing: Signal Theory, Digital Signal & Data Processing, Stochastic Processes, Detection and Estimation, Spectral Analysis, Filtering, Signal Processing Systems, Environmental Signal Processing, Software Developments, Image Processing, Pattern Recognition, Optical Signal Processing, Digital Signal Processing, Multi-dimensional Signal Processing, Communication Signal Processing, Biomedical Signal Processing, Geophysical and Astrophysical Signal Processing, Earth Resources Signal Processing, Acoustic and Vibration Signal Processing, Data Processing, Remote Sensing, Signal Processing Technology, Speech Processing, Signal Processing for Audio, Visual and Performance Arts, Radar Signal Processing, Sonar Signal Processing, Seismic Signal Processing, Medical Imaging Equipment and Techniques, Biomedical Imaging and Image Processing, Video Processing, Industrial Applications, New Applications, etc
Electronics: Electronic Materials, Microelectronic System, Design and Implementation of Application Specific Integrated Circuits (ASIC), VLSI Design, System-on-a-Chip (SoC) and Electronic Instrumentation Using CAD Tools, Biomedical Transducers and instrumentation, Biomechanics and Rehabilitation Engineering, Transistor, MOSFET, CMOS, etc
Electrical: Electrical Engineering Materials, Electric Power Generation, Transmission and Distribution, Power Electronics, Power Quality, Power Economic, FACTS, Renewable Energy, Electric Traction, Electromagnetic Compatibility, High Voltage Insulation Technologies, High Voltage Apparatuses, Lightning Detection and Protection, Power System Analysis, SCADA, Electrical Measurements, etc
Telecommunication: Modulation and Signal Processing for Telecommunication, Information Theory and Coding, Antenna and Wave Propagation, Wireless and Mobile Communications, Radio Communication, Communication Electronics and Microwave, Radar Imaging, Distributed Platform, Communication Network and Systems, Telematics Services and Security Network, etc
Instrumentation & Control: Optimal, Robust and Adaptive Controls, Non Linear and Stochastic Controls, Modeling and Identification, Robotics, Image Based Control, Hybrid and Switching Control, Process Optimization and Scheduling, Control and Intelligent Systems, Artificial Intelligent and Expert System, Fuzzy Logic and Neural Network, Complex Adaptive Systems, etc
SECTION POLICIES
Peer Review Process
Authors should present their papers honestly without fabrication, falsification, plagiarism or inappropriate data manipulation. Submitted papers are evaluated by anonymous referees for contribution, originality, relevance, and presentation. The Editor shall inform you of the results of the review as soon as possible, hopefully in 6 to 8 weeks.
This journal operates a conventional single-blind reviewing policy in which the reviewer's name is always concealed from the submitting author. Papers will be sent for anonymous review by at least two reviewers who will either be members of the Editorial Board or others of similar standing in the field. In order to shorten the review process and respond quickly to authors, the Editors may triage a submission and come to a decision without sending the paper for external review. The Editors’ decision is final and no correspondence can be entered into concerning manuscripts considered unsuitable for publication in this ournal. All correspondence, including notification of the Editors’ decision and requests for revisions, will be sent by email.
Publication Frequency
TELKOMNIKA Indonesian Journal of Electrical Engineering is an international, monthly, online journal, publishing high-quality, peer reviewed articles from all areas of electrical, electronics, instrumentation, automation and control, telecommunication, computer and informatics engineering.
Open Access Policy
This journal provides immediate open access to its content on the principle that making research freely available to the public supports a greater global exchange of knowledge.
Archiving
This journal utilizes the LOCKSS system to create a distributed archiving system among participating libraries and permits those libraries to create permanent archives of the journal for purposes of preservation and restoration. More...
Indexing and Abstracting
TELKOMNIKA Indonesian Journal of Electrical Engineering has been covered by the following services:
Scopus CNKI
EI INSPEC (IET) see page 20
Ei Compendex (To view the 2013 Compendex Source List, click here) Google Scholar
DOAJ
Academic Journals Database BASE
Computer Science Directory Directory of Science
EBSCO Goletty
IPI Indonesian Publication Index JurnalIndex.net
Latest Journal Articles NYU Health Science Library Open Access Articles
Open Access Journals Search Engine (OAJSE) Open Access Library (OALib)
Open-resources
Open University Malaysia ProQuest
SciTitles
SHERPA/RoMEO, University of Nottingham Universiteitsbibliotheek Gent
Universia Holding
University Library (University of Saskatchewan) Western Theological Seminary
Publication Ethics and Publication Malpractice Statement
Institute of Advanced Engineering and Science (IAES) is a non-profit international scientific association of distinguished scholars engaged in engineering and science devoted to promoting researches and technologies in engineering and science field through digital technology. IAES Journals are peer-reviewed international journals. This statement clarifies ethical behaviour of all parties involved in the act of publishing an article in our journals, including the authors, the editors, the peer-reviewers and the publisher (Universitas Ahmad Dahlan and Institute of Advanced Engineering and Science). This statement is based on COPE’s Best Practice Guidelines for Journal Editors.
Ethical Guideline for Journal Publication
The publication of an article in a peer-reviewed TELKOMNIKA Indonesian Journal of Electrical Engineering is an essential building block in the development of a coherent and respected network of knowledge. It is a direct reflection of the quality of the work of the authors and the institutions that support them. Peer-reviewed articles support and embody the scientific method. It is therefore important to agree upon standards of expected ethical behavior for all parties involved in the act of publishing: the authors, the journal editors, the peer reviewers, the publisher and the society.
Institute of Advanced Engineering and Science (IAES) as publisher of IAES Journals takes its duties of guardianship over all stages of publishing extremely seriously and we recognize our ethical and other responsibilities. We are committed to ensuring that advertising, reprint or other commercial revenue has no impact or influence on editorial decisions. In addition, the IAES and Editorial Board will assist in communications with other journals and/or publishers where this is useful and necessary.
Publication decisions
The editors of the IAES journals are responsible for deciding which of the articles submitted to the journal should be published. The validation of the work in question and its importance to researchers and readers must always drive such decisions. The editors may be guided by the policies of the journal's editorial board and constrained by such legal requirements as shall then be in force regarding libel, copyright infringement and plagiarism. The editors may confer with other editors or reviewers in making this decision.
Fair play
An editor at any time evaluate manuscripts for their intellectual content without regard to race, gender, sexual orientation, religious belief, ethnic origin, citizenship, or political philosophy of the authors.
Confidentiality
The editor and any editorial staff must not disclose any information about a submitted manuscript to anyone other than the corresponding author, reviewers, potential reviewers, other editorial advisers, and the publisher, as appropriate.
Disclosure and conflicts of interest
Duties of Reviewers
Contribution to Editorial Decisions
Peer review assists the editor in making editorial decisions and through the editorial communications with the author may also assist the author in improving the paper.
Promptness
Any selected referee who feels unqualified to review the research reported in a manuscript or knows that its prompt review will be impossible should notify the editor and excuse himself from the review process.
Confidentiality
Any manuscripts received for review must be treated as confidential documents. They must not be shown to or discussed with others except as authorized by the editor.
Standards of Objectivity
Reviews should be conducted objectively. Personal criticism of the author is inappropriate. Referees should express their views clearly with supporting arguments.
Acknowledgement of Sources
Reviewers should identify relevant published work that has not been cited by the authors. Any statement that an observation, derivation, or argument had been previously reported should be accompanied by the relevant citation. A reviewer should also call to the editor's attention any substantial similarity or overlap between the manuscript under consideration and any other published paper of which they have personal knowledge.
Disclosure and Conflict of Interest
Privileged information or ideas obtained through peer review must be kept confidential and not used for personal advantage. Reviewers should not consider manuscripts in which they have conflicts of interest resulting from competitive, collaborative, or other relationships or connections with any of the authors, companies, or institutions connected to the papers.
Duties of Authors Reporting standards
Authors of reports of original research should present an accurate account of the work performed as well as an objective discussion of its significance. Underlying data should be represented accurately in the paper. A paper should contain sufficient detail and references to permit others to replicate the work. Fraudulent or knowingly inaccurate statements constitute unethical behaviour and are unacceptable.
Data Access and Retention
Authors are asked to provide the raw data in connection with a paper for editorial review, and should be prepared to provide public access to such data (consistent with the ALPSP-STM Statement on Data and Databases), if practicable, and should in any event be prepared to retain such data for a reasonable time after publication.
Originality and Plagiarism
The authors should ensure that they have written entirely original works, and if the authors have used the work and/or words of others that this has been appropriately cited or quoted.
Multiple, Redundant or Concurrent Publication
An author should not in general publish manuscripts describing essentially the same research in more than one journal or primary publication. Submitting the same manuscript to more than one journal concurrently constitutes unethical publishing behaviour and is unacceptable.
Acknowledgement of Sources
Authorship of the Paper
Authorship should be limited to those who have made a significant contribution to the conception, design, execution, or interpretation of the reported study. All those who have made significant contributions should be listed as co-authors. Where there are others who have participated in certain substantive aspects of the research project, they should be acknowledged or listed as contributors. The corresponding author should ensure that all appropriate co-authors and no inappropriate co-authors are included on the paper, and that all co-authors have seen and approved the final version of the paper and have agreed to its submission for publication.
Hazards and Human or Animal Subjects
If the work involves chemicals, procedures or equipment that have any unusual hazards inherent in their use, the author must clearly identify these in the manuscript.
Disclosure and Conflicts of Interest
All authors should disclose in their manuscript any financial or other substantive conflict of interest that might be construed to influence the results or interpretation of their manuscript. All sources of financial support for the project should be disclosed.
Fundamental errors in published works
When an author discovers a significant error or inaccuracy in his/her own published work, it is the author’s obligation to promptly notify the journal editor or publisher and cooperate with the editor to retract or correct the paper.
Witdrawal of Manuscripts
Authora are not allowed to withdraw submitted manuscripts, because the withdrawals are waste of valuable resources that editors and referees spent a great deal of time processing submitted manuscript, money and works invested by the publisher.
If authors still request withdrawal of their manuscripts when the manuscripts are still in the peer-reviewing process, authors will be punished with paying $200 per manuscript, as withdrawal penalty to the publisher. However, it is unethical to withdraw a submitted manuscripts from one journal if accepted by another journal. The withdrawal of manuscripts after the manuscripts are accepted for publication, author will be punished by paying US$500 per manuscript. Withdrawal of manuscripts are only allowed after withdrawal penalty has been fully paid to the Publisher.
Checklist for preparing your final paper for publication
1. Is your manuscript written in TELKOMNIKA format (http://goo.gl/WjZOF9)? At this stage, it is not that essential that you follow every detail of TELKOMNIKA format. Please try to follow the format as closely as possible.
2. is your title adequate and is your abstract correctly written? The title of paper is max 10 words, without Acronym or abbreviation. The Abstract (MAX 200 WORDS) should be informative and completely self-explanatory (no citation in abstract), provide a clear statement of the problem, the proposed approach or solution, and point out major findings and conclusions.
3. Authors are suggested to present their articles in the sections structure: Introduction - The Proposed Method/Algorithm/Procedure specifically designed (optional) - Research Method - Results and Discussion – Conclusion. Authors may present complex proofs of theorems or non-obvious proofs of correctness of algorithms after introduction section (obvious theorems & straightforward proofs of existing theorems are NOT needed).
4. Introduction section: explain the context of the study and state the precise objective. An Introduction should contain the following three parts:
Background: Authors have to make clear what the context is. Ideally, authors should give an idea of the state-of-the art of the field the report is about.
The Problem: If there was no problem, there would be no reason for writing a manuscript, and definitely no reason for reading it. So, please tell readers why they should proceed reading. Experience shows that for this part a few lines are often sufficient.
of authors work. Authors should place the paper in proper context by citing relevant papers. At least, 5 references (recently journal articles) are used in this section.
5. Method section: the presentation of the experimental methods should be clear and complete in every detail facilitating reproducibility by other scientists.
6. Results and discussion section: The presentation of results should be simple and straightforward in style. This section report the most important findings, including results of statistical analyses as apropriate and comparisons to other research results. Results given in figures should not be repeated in tables. This is where the author(s) should explain in words what he/she/they discovered in the research. It should be clearly laid out and in a logical sequence. This section should be supported suitable references.
7. Conclusion section: Summarize sentences the primary outcomes of the study in a paragraph. Are the claims in this section supported by the results, do they seem reasonable? Have the authors indicated how the results relate to expectations and to earlier research? Does the article support or contradict previous theories? Does the conclusion explain how the research has moved the body of scientific knowledge forward?
8. Language. If an article is poorly written due to grammatical errors, while it may make it more difficult to understand the science.
9. Please be sure that the manuscript is up to date. It is expected that 10 to 20% of references are to recent papers.
10. Is the manuscript clearly written? Is the article exciting? Does the content flow well from one section to another? Please try to keep your manuscript on the proper level. It should be easy to understand by well qualified professionals, but at the same time please avoid describing well known facts (use proper references instead). Often manuscripts receive negative reviews because reviewers are not able to understand the manuscript and this is authors' (not reviewers') fault. Notice, that if reviewers have difficulties, then other readers will face the same problem and there is no reason to publish the manuscript.
11. Do you have enough references? We will usually expect a minimum of 10 to 25 references primarily to journal papers, depending on the length of the paper. Citations of textbooks should be used very rarely and citations to web pages should be avoided. All cited papers should be referenced within the text of the manuscript.
12. Figures and Tables.
Relation of Tables or Figures and Text:
Because tables and figures supplement the text, all tables and figures should be referenced in the text. Authos also must explain what the reader should look for when using the table or figure. Focus only on the important point the reader should draw from them, and leave the details for the reader to examine on her own.
Figures:
a. All figures appearing in article must be numbered in the order that they appear in the text.
b. Each figure must have a caption fully explaining the content
c. Figure captions are presented as a paragraph starting with the figure number i.e. Figure 1, Figure 2, etc.
d. Figure captions appear below the figure
e. Each figure must be fully cited if taken from another article f. all figures must be referred to in the body of the article Tables:
a. Material that is tabular in nature must appear in a numbered captioned table.
b. All tables appearing in article must be numbered in the order that they appear in the text.
c. Each table must have a caption fully explaining the content with the table number i.e. Table 1, Table 2, etc.
d. Each column must have a clear and concise heading
e. Tables are to be presented with single horizontal line under: the table caption, the column headings and at the end of the table.
f. All tables must be referred to in the body of the article g. Each table must be fully cited if taken from another article
14. The references should be integrated also with not less than two papers published on IAES’s Journals. You can find the issued at:http://iaesjournal.com (please use “Search Paper” facility)
Indonesian Journal of Electrical Engineering and Computer Science
Vol 2, No 1: April 2016
Table of Contents
A Novel Method Based on Teaching-Learning-Based Optimization for Recloser Placement with Load Model Consideration in Distribution System
Sina Khajeh Ahmad Attari, Mohammad Bakhshipour, Mahmoudreza Shakarami, Farhad Namdari
The Influence of Moisture and Temperature on the Behavior of Soil Resistivity in Earthing Design Using Finite Element Method
Sajad Samadinasab, Farhad Namdari, Mohammad Bakhshipor
An Enhanced Symmetrical Fault Detection during Power Swing/ Angular Instability using Park’s Transformation
Jeevitha A, Devi S
A New Electrode Regulator System Identification of Arc Furnace Based on Time-Variant Nonlinear-Linear-Nonlinear Model
Shoulin Yin, Jinfeng Wang, Xueying Wang
Determining Basic Cost of Electricity on the Regionalization System
Yusra Sabri, Hermagasantos Zein
Single Phase Variable Sampling Phase Locked Loop using Composite Observer
K Arun, K Selvajyothi
Optimal Selection of UPFC Parameters and Input Controlling Signal for Damping Power System Oscillations
Moslem Salehi, Ali Akbar Motie Birjandi
Induction Motors Stator Fault Analysis based on Artificial Intelligence
Hussein Taha Hussein, Mohamed Ammar, Mohamed Moustafa Hassan
Transient Analysis of a Multi-phase Induction Machine Operating as Generator
Alok Kumar Mohanty, K B Yadav
Bridgeless Isolated Cuk PFC Implementation using PID and Neural Controller
R. Pireethi, R. Balamurugan
Improved Performance of Four Switch Three Phase with SEPIC-Based Inverter
Prabu B, Murugan M
Synchronverter Control for Parallel Operation of Cascaded H-Bridge Inverter
Amar Hamza, Sara Altahir, Xiangwu Yan
New design of Network on Chip Based on Virtual Routers
Mohamed Fehmi Chatmen, Adel Baganne, Rached Tourki
Automatic Voltage Generation Control for Two area Power System Including GRC nonlinearity based on Particle Swarm Optimization
Ali M. Ali, M.A. Ebrahim, M.A. Moustafa Hassan
Apply Optimarin Ballast System for Vietnam’s Fleet to Prevent Sea Pollution from Non-Indigenous Aquatic Species
Dinh-Chien Dang, Ming-Hung Shu, Bi-Min Hsu, Thanh-Lam Nguyen, Phung-Kim Truong, Viet-Thanh Nguyen
Background Modeling to Detect Foreground Objects Based on ANN and Spatio-Temporal Analysis
N. Satish Kumar, Shobha G
Sparse Modeling with Applications to Speech Processing: A Survey
Ahmed Omara, Alaa Hefnawy, Abdelhalim Zekry
Intrusion Prevention System Inspired Immune Systems
Yousef Farhaoui
Vivi Nur Wijayaningrum, Wayan Firdaus Mahmudy
Fuzzy Logic and Dempster-Shafer Theory to Find Kicking Range of Sepak Takraw Game
Andino Maseleno, Md. Mahmud Hasan, Muhammad Muslihudin, Tri Susilowati
Challenges Over Two Semantic Repositories - OWLIM and AllegroGraph
Paria Tajabor, Tara Raafat
Information Retrieval: Textual Indexing Using an Oriented Object Database
Mohammed Erritali
Nonlinear Dynamics Research between Drill Pipe and Coal Hole Wall during Gas Extraction Drilling
Xiaoming HAN, Chenxu LUO, Qiangqiang Zhang
Satellite-Based Land Surface Temperature Estimation of Bogor, Indonesia
Indonesian Journal of Electrical Engineering and Computer Science Vol.2, No.1, April 2016, pp. 701 ~ 708
DOI: http://dx.doi.org/10.11591/ijeecs.v2.i1.pp%25p 701
Received January 7, 2016; Revised February 26, 2016; Accepted March 15, 2016
Satellite-Based Land Surface Temperature Estimation
of Bogor Municipality, Indonesia
Ema Kurnia1, I Nengah Surati Jaya2, Widiatmaka3
1Department of Master of Science in Information Technology for Natural Resources Management, Faculty of Mathematic and Natural Science, Bogor Agricultural University
2Department of Forest Management, Faculty of Forestry, Bogor Agricultural University 3Department of Soil Science and Land Resources, Faculty of Agriculture, Bogor Agricultural
University
Correspondence author: [email protected] / [email protected] / [email protected] / [email protected] / [email protected]
Abstract
The earth’s average temperature has been a big issue on the global warming. The warming of the earth is largely the results of emission of carbon dioxide and other greenhouse gasses (GHG) from human activities. As a hinterland of the Capital City, in the last two decades, Bogor is also getting warmer in comparison with the previous decades. This paper presents how the land surface temperature (LST) had been estimated using Split-Window (SW) algorithm and how its spatial distribution in Bogor Municipality was computed. The spectral radiance of Landsat-8 TIR bands 10 and 11, the emissivity values, and water vapor used as the input on SW Algorithm. The study revealed that the temperature within the built-up area, have warmer temperature than their surrounding ranging from 400C to 450C of 3,403.9 ha. The use of SW algorithm is quite reliable and accurate to estimate the LST derived from Landsat-8 having a mean deviation of only 2.7%, less than standard acceptable of 10%.
Keywords: LST, SW Algorithm, TIR
Copyright © 2016 Institute of Advanced Engineering and Science. All rights reserved.
1. Introduction
Now, the global warming has been an international issue that attracting the international attention. At the site level, the land surface temperatures (LST) has been used by many researchers as an indicator of energy balance. Specifically, the LST has been used as a key parameter that describes the land surface processes. Within the urban areas, the LST might be closely related to the urban heat island (UHI) which is mainly affected by the human activities. The causes of UHI mainly comes from the human activities that include lifestyle, that use fossil fuel in main human activities, e.g., liquid petroleum gasses for cooking, electricity for room heating and cooling, gasoline or diesel for transportation, industry etc. The waste from the energy usage by every household was also a secondary contributor to the heat. As the population in the city also grows, this tends to expand the area and increase its average temperature. Development of built-up area with the less green open area may cause global temperature changes that result in a change of climate elements, especially the increase in temperature.
ISSN: 2502-4752
IJEECS Vol. 2, No. 1, April 2016: xxx – xxx 702
Frequently, cities have warmer land’s average temperature than its surrounding suburban and rural areas. The rapid development of built-up areas in Bogor, such as settlements, tall buildings for hotel, commerce, and/or offices, mainly alters the physical characteristics of the land surface, from vegetation to non-vegetated areas. The replacement of green vegetated surfaces with non-vegetated and non-porous urban materials with high heat capacity and low solar reflectivities, such as concrete masses, asphalt roads and metal surfaces exhibit a high degree of thermal inertia [3]. These areas are characterized by a high level of absorption of solar radiation, with a greater capacity for thermal conductivity as compared to natural surfaces [4].
Within the built-up area, the glass-walled buildings may reflect the incoming short-wave solar radiation (sunlight), and consequently the surface, as well as the air temperature in the surrounding building may increase. In the cities, it is also quite common that emission from public traffic as well as private traffic may increase the GHG released to the atmosphere, then eventually increase the surface temperature. Some gasses that are emitted into the atmosphere will act as a greenhouse gas that is transparent to short-wave solar radiation and absorb long-wave radiation of the earth thus increasing global warming. Urban development can raise the local temperature of the city where the rate of temperature rise is proportional to the rate of urban development [5]. The increase of population also caused an increase of heat waste, mainly emitted from non-metabolic activities such as vehicles, personal waste, energy consumption and manufactures etc. This may affect local climate change especially air temperature directly and indirectly [6]. The temperature of the urban areas might be effectively managed and slightly modified by increasing the extent of GHG absorber or by reducing the source of heat gasses. The common strategy applied is by increasing the amounts of heat energy absorbed and stored in the vegetation. Vegetation would be a very effective way as it delivers several mechanisms of cooling simultaneously and it had been recognized as a very cheap way to implement the cooling strategy.
To spatially measure the spatial distribution of the heat emitter and heat absorber, it needs to develop a technique to derive land surface temperature quickly, consistently, accurately, comprehensively and with a reasonable cost. One technique that frequently applied is by using the remote sensing approaches. Traditionally, the land surface temperature is mapped by using interpolation technique using the data recorded by each national weather station. Interpolation method for sparsely stationed network had been a focus of many researchers, including the examination of geostatistics and deterministic approaches. This method will provide very rough map since the distances between climatology stations are very low. The different interpolation method can provide different accuracy and deviation.
Now, the availability of remotely sensed data recorded using thermal bands, coupling the available middle-infrared, near-infrared, as well as the visible bands, has given a very good prospect. There is no interpolation method required in this approach. The temperatures were derived from every grid of the data. The algorithm used by combining the thermal, near-infrared and red-band of Landsat data, the pixel-based temperature might be derived. On the LST estimation, the accuracy of LST estimation is mainly affected by the surface capability of emitting radiation. In many algorithms, the LST estimations are based on the assumption that the ground surface acts as a blackbody (emissivity equals one).
IJEECS ISSN: 2502-4752
Satellite-Based Land Surface Temperature Estimation of Bogor Municipality Indonesia (Ema Kurnia) 703
2. Research Method 2.1 Study Area
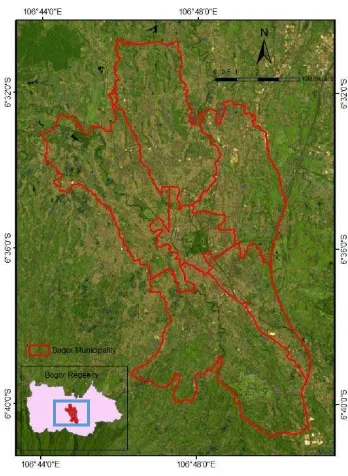
Bogor Municipality is located in a hinterland area of the Capital City Jakarta that consisted of 6 districts and 68 villages, with area extent of about 11.694 ha. Geographically, the city is located between 06o48'40'' and 06o46'22'' East longitude; and between 6o30'53'' and 6o40'08'' South latitude (Figure 1). The city has been the main destination of many domestic tourists within the Jabodetabek, and the residential area of many people who are working in the Capital City Jakarta. Now, the city has been frequently selected by His Excellency President Joko Widodo as his second working office. Thus, Bogor municipality which is now becoming the center of various activities such as commerce, tourism, the residential and president palace has been chosen as a study site. Bogor Municipality has a high rate of population growth and development.
Figure 1 Study area research
2.2 The Supporting Data
The main data used are Digital Satellite Landsat-8 OLI (Operational Land Imager) imageries path 112-row 65; acquired on 13th September 2014. The bands used particularly red band (band 4), near infrared band (band 5), and Thermal Infrared Sensor (TIRS), namely band 10 and 11. The data was captured at approximately 10:00:37 a.m. local time. Landsat-8 provides metadata of the bands such as thermal constant and rescaling factor value that used for calculating the LST. Other primary data used to accomplish the study are surface temperature, land cover condition manually measured and observed at 5 Points. Although the Landsat-8 OLI recorded on 13th September 2014, while the ground measurement was done in March 2015, the difference between the temperature in March 2015 and in September 2014 in the day time is not significantly different. The land cover and land use within at the measurement points didn’t change drastically.
2.3 Software, Hardware, and Tools Used
The spatial analysis was mainly performed using ArcMap 9.3 while the data processing of Landsat imageries were processed using ERDAS imagine 9.1. The processing platform was a personal computer with printing devices. For ground measurements, the tools used were Thermometer, GPS, and Camera.
2.4 Split-Window (SW) Algorithm
ISSN: 2502-4752
IJEECS Vol. 2, No. 1, April 2016: xxx – xxx 704
at two different wavelengths [13]. The SW technique uses two TIR bands typically located in the atmospheric window between 10.30 and 12.50 μm. Furthermore, the following input required by the SW algorithm are brightness temperature, mean and difference in land surface emissivity (LSE) and water vapor.
The land surface temperature was calculated by converting the Digital Number (DN) of the two thermal bands (band 10, 11) into top of atmospheric radiance value, and then into the brightness temperature. Therefore, correction of the spectral emissivity has to be included. LSE was derived from NDVI threshold method by using the OLI bands 4, 5, and the emissivity values of TIR bands 10 and 11. In physical Atmospheric, the moisture content of the earth atmosphere is one of the most important parameters, it is hard to represent water vapor because of its space-time variation [14]. Water vapor content was the average of moisture for Bogor area. To obtain the water vapor content in September 2014 was to multiply the moisture by the ratio of water vapor content to the total standard atmospheric profiles for the tropical area [15]. The brightness temperature, mean and difference in LSE and water vapor content were used to calculate the LST. The formula is in equation-1 [16]:
LST = BT10 + C1 (BT10-BT11) + C2 (BT10-BT11)2 + C0 + (C3+C4w) (1- ε) + (C5+C6w) Δ ε …... (1)
where: LST is Land surface temperature (0Kelvin); C0 to C6 are Split-window Coefficient values [17]; BT10 and BT11 are Brightness temperatures of band 10 and band 11 (in 0K); ε is mean LSE of TIR bands; w is atmospheric water vapor content; and Δ ε is difference in LSE.
2.5 Ground Measurements
For validating the land surface temperature derived from the model in equation 1, the authors made ground measurements. Ground-based temperature measurements were taken in 13 days during March 2015 starting from 2nd March to 28th March. The measurement days were selected randomly, at the following specific date: 2nd, 4th, 7th, 9th, 11th, 14th, 16th, 18th, 21st, 23rd, 25th, 28th, and 30th. The locations of measurement were selected purposively at five different locations by considering the characteristics of land cover to be represented such as built-up, urban forest, rice field, housing and manufactured area. The temperature measurements were done between 10.00 – 12.00 am local time, which is the closest time to the Landsat-8 image captured. A total of five thermometers at measurement points were mounted at 1.5 m height in an open space that protected from solar radiation.
2.6 Data analysis
To know the consistency and the relationship between these ground-based temperatures and the average of LSTs estimation, then the Pearson’s correlation coefficients were derived. Besides, the deviation between the land’s surface temperature estimate (LST) and the actual temperature was calculated by using mean deviation (MD) as in equation-2:
MD ∑ % ………. (2)
3. Results and Analysis
3.1 Land Surface Temperature Distribution
IJEECS ISSN: 2502-4752
Satellite-Based Land Surface Temperature Estimation of Bogor Municipality Indonesia (Ema Kurnia) 705
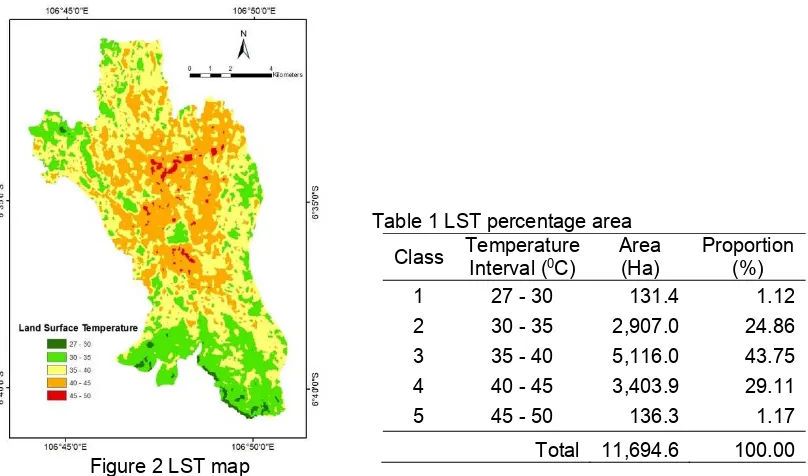
the value of LST ranged from 400C to 500C. Conversely, high values of NDVI indicating the presence of green vegetation which mainly occurs, at the southern part of the study area. The corresponding land cover classes are farmland and grass area with the LST ranged from 270C to 390C. Some patches of high NDVI were also noticeable within the central region of the study area and corresponded to the urban forest area. The percentage area according to the temperature intervals was shown in Table 1.
Figure 2 LST map
Table 1 LST percentage area
Class Temperature Interval (0C) Area (Ha) Proportion (%)
1 27 - 30 131.4 1.12
2 30 - 35 2,907.0 24.86
3 35 - 40 5,116.0 43.75
4 40 - 45 3,403.9 29.11
5 45 - 50 136.3 1.17
Total 11,694.6 100.00
The highest LST of more than 450C is spread in the North and Center parts of Bogor with an area of 136.26 Ha. The smallest area of 131.4 Ha is varied from 270C to 300C. LST with the largest area of 5,116.05 Ha is varied from 350C to 400C. It has been largely demonstrated that cities with variable landscapes and climates can exhibit temperatures several degrees higher than their rural surroundings. The area with high LST is an area that dense with the settlements and roads (built-up). LST and land cover values were computed to understand further how LST interact with land cover parameters. The tabulated LST and land cover as shown in Table 2.
Table 2 Tabulated LST and land cover
No Land Cover Min LST(Mean 0C) Max
1 Urban Forest 27 34.5 42
2 Waterbody 28 36 44
3 Farmland 27 36 45
4 Grass 29 36.5 45
5 Built-up 29 39 49
The highest mean LST was found in built-up area having a temperature of 390C, followed
by the grass of 36.50C, farmland and waterbody of 360C, and the lowest temperature detected in the urban forest of 34.50C. This implies that urban development has brought up LST by replacing natural vegetation with a non-evaporating and non-transpiring surface such as stone, metal, and concrete [19] [20].
3.2 Relationship between LST and Air Temperature
ISSN: 2502-4752
IJEECS Vol. 2, No. 1, April 2016: xxx – xxx 706
[22]. In general, the close relationship between LST and the air temperature has been shown to be valid [23] [24].
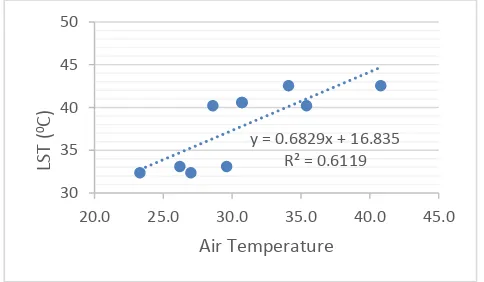
Pearson’s correlation coefficients analysis (r) shows moderately high association with the value of 0.78 with the significant correlation of > 0.01 (1%) and mean deviation of 2.7%. Some research also shows the significant relationship during night-time measurement [25] [26]. Although there are differences between LST and air temperature, a moderate to high percentage of the air temperature can be estimated from the LST as indicated by coefficients of determination (R2). The value R2 obtained was in the range of 0.61 (Figure 3), this means that the variation of in situ temperature can be explained by the LST into 61%. In this case, the study area was limited only for Bogor Municipality, with the assumption that the ecological factor outside the study area was not considered.
Figure 3 Relationship between LST and air temperature
By all means, we should not forget that the obtained relationship is based on the data of only two days, however complex, measurement campaigns. In the future, when using data of more measurements on days with similar environmental conditions to that of the investigated days, the result could be refined.
4. Conclusion
Landsat-8 TIRS sensor is capable of recording the radiant heat data on the earth's surface in the thermal infrared spectrum. The radiance heat information in the thermal spectrum is strongly influenced by the surface temperature and the object emissivity. As describe by the Stefan-Boltzmann law, the total amount of emitted energy is directly proportional to the fourth power of the object’s temperature. The split-window algorithm was used to determine the LST of an area. The land use changed in Bogor Municipality from the non-built area into built area has affected to the increasing of LST. The land surface temperature in Bogor Municipality can be estimated from the thermal sensors of satellite data exhibit by r = 0.78, with significant correlation 0.01 of the air temperature and mean deviation of 2.7. In the frame of this study, a data collection in different seasons could also be a new direction, which can provide a possibility to examine the specific seasonal features and enable their comparison.
Acknowledgments
Special thanks to the laboratory of Geophysics and Meteorology of Bogor Agricultural University for the equipment provided and Nils Nölke from Gottingen University for suggestions, corrections and comments for improvement of the original manuscript. It helps a lot for the revision of this paper.
References
[1] Taha HG, Akbari H, Sailor D, Ritschard R. Causes and Effect of Heat Islands: The Sensitivity of Urban Microclimates to Surface Parameters and Anthropogenic Heat. Lawrence Berkeley Laboratory. Report No. 29864. Lawrence Berkeley, Davis California, USA. 1990 [2] Fan H, Sailor DJ. Modeling the Impacts of Anthropogenic Heating on the Urban Climate of
IJEECS ISSN: 2502-4752
Satellite-Based Land Surface Temperature Estimation of Bogor Municipality Indonesia (Ema Kurnia) 707
[3] Arrau CP and Pena MA. 2010. The Urban Heat Island (UHI) Effect. Available online at http://www.urbanheatislands.com (Accessed January 3rd, 2016).
[4] Rose LA, Devadas MD. Analysis of and Surface Temperature and Land Use/ Land Cover Types Using Remote Sensing Imagery – A Case in Chennai City, India. Seventh International Conference on Urban Climate, Yokohama, Japan. 2009.
[5] Fukui Y. A study on surface temperature patterns in the Tokyo metropolitan area using aster data. Geoscience Journal. 2003; 7: 343-346.
[6] Mas’at A. 2008. The impact of development on climate variations in Jakarta. BMKG Bulletin. 2008; 4.
[7] Wan Z. New refinements and validation of the collection-6 MODIS land-surface temperature/emissivity product. Remote Sens. Environ. 2014; 140: 36–45.
[8] Dash, P. Land surface temperature and emissivity retrieval from satellite measurements. Dissertation. Institut fur Meteorologie und Klimaforschung. ISSN 0947-8620. 2005. [9] Akhoondzadeh M, Saradjian MR. Comparison of Land Surface Temperature Mapping Using
Modis and Aster Images in Semi-Arid Area. Remote Sensing Division, Surveying and Geomatics Dept., Faculty of Engineering, University of Tehran, Tehran, Iran. The International Archives of the Photogrammetry, Remote Sensing and Spatial Information Sciences. Vol. XXXVII. Part B8. Beijing 2008
[10] Liu H, Zhang Shenglang Z. Land Surface Temperature Retrieval from the Medium Resolution Spectral Imager MERSI Thermal Data. TELKOMNIKA Indonesian Journal of Electrical Engineering. 2014; 12: 7287-7298
[11] Liang S, Li X, Wang J. Advanced Remote Sensing: Terrestrial Information Extraction and Applications; Elsevier Science: Amsterdam, The Netherlands. 2012.
[12] Zhang Z, He G. Generation of Landsat surface temperature product for China, 2000–2010. Int. J. Remote Sens. 2013; 34: 7369–7375.
[13] Sobrino JA, Li ZL, Stoll MP, Becker F. Multi-channel and multi-angle algorithm for estimating sea and land surface temperature with ATSR data. International Journal of Remote Sensing. 1996; 17: 2089-2114.
[14] Xin W, Xiaobo D, Shenglan Z. Retrieving Atmospheric Precipitable Water Vapor Using Artificial Neural Network Approach. TELKOMNIKA Indonesian Journal of Electrical Engineering. 2013; 11: 7174-7181.
[15] Qin Z, Karnieli A, Berliner P. A mono-window algorithm for retrieving land surface temperature from Landsat TM data and its application to the Israel-Egypt border region. Int. J. Remote Sensing. 2001; 22(18): 3719–3746.
[16] Jimenez-Munoz JC, Sobrino JA, Skokovic D, Mattar C, Cristobal J. Land surface temperature retrieval methods from Landsat-8 thermal infrared sensor data. IEEE Geosci. Remote Sens. Lett. 2014; 11: 1840–1843.
[17] Skokovic D, Sobrino JA, Jimenez-Munoz JC, Soria G, Julien Y, Mattar C, and Cristobal J. 2014. Calibration and Validation of Land Surface Temperature for Landsat 8 – TIRS Sensor. Land product Validation and Evolution, ESA/ESRIN Frascati (Italy), pp 6-9, January 28-30.
[18] Cheng KS, Su YF, Kuo FT, Hung WC, Chiang JL. Assessing the effect of land cover changes on air temperature using remote sensing images – a pilot study in northern Taiwan. Landscape Urban Plan. 2008; 86: 85–96.
[19] Lo CP, Quattrochi D, Luvall J. Application of high-resolution thermal infrared remote sensing and GIS to assess the urban heat island effect. International Journal of Remote Sensing. 1997; 18: 287–304.
[20] Weng Q. A remote sensing-GIS evaluation of urban expansion and its impact on surface temperature in the Zhujiang Delta, China. International Journal of Remote Sensing. 2001; 22: 1999–2014.
[21] Nichol JE. A GIS-Based Approach to Microclimate Monitoring in Singapore’s High-Rise Housing Estates. Photogrammetric Engineering and Remote Sensing. 1994; 60: 1225-1232.
ISSN: 2502-4752
IJEECS Vol. 2, No. 1, April 2016: xxx – xxx 708
[23] Mostovoy GV, King RL, Reddy KR, Kakani VG, Filippova MG. Statistical estimation of daily maximum and minimum air temperatures from MODIS LST data over the state of Mississippi. GISci. Remote Sens. 2006; 43: 78–110.
[24] Prihodko L, Goward SN. Estimation of air temperature from remotely sensed surface observations. Remote Sens. Environ. 1997; 60: 335–346.
[25] Unger J, Gal T, Rakonczai J, Mucsi L, Szatmari J, Tobak J, Leeuwen B, and Fiala K. 2009. Air temperature versus surface temperature in urban environment. The seventh international conference on urban climate. Yokohama, Japan.