DOI: 10.12928/telkomnika.v13.i1.1122 725
Research on Community Detection Algorithm
Based on the UIR-Q
Zilong Jiang1, Wei Dai*2, Xiufeng Cao1, Liangchen Chen1, Ke Zheng1, and Abdoulaye Sidibe1
1School of Computer Science and Technology, Wuhan University of Technology, Wuhan, China 2School of Economics and Management, Hubei Polytechnic University, Huangshi, China
*Corresponding author, e-mail: [email protected]
Abstract
Aiming at the current problems of community detection algorithm in which user’s properties are not used; the community structure is not stable and the efficiency of the algorithm is low, this paper proposes a community detection algorithm based on the user influence. In terms of the concept of user influence in the subject communication and the PageRank algorithm, this paper uses the properties of nodes of users in social networks to form the user influence factor. Then, the user with the biggest influence is set as the initial node of new community and the local modularity method is introduced into detecting the community structure. Experiments show that the improved algorithm can efficiently detect the community structure with large scale users and the results are stable. Therefore, this algorithm will have a wide applied prospect.
Keyword: social networks; community detection; user influence; modularity
Copyrightc 2016 Universitas Ahmad Dahlan. All rights reserved.
1. Introduction
Community detection means the cohesive subgroup detected in the social network and as an important problem existing in the analysis of social network it is beneficial for people to further understanding and mastering the complicated network subject in the research and making deep applied research, for instance, individual recommendation [1], compression of network with large scale [2], social network evolution [3], and so on.
Community detection algorithm based on the network structure is a class of popular al-gorithm which it divides the social network into sub-communities with close connection in same community and sparse connection in different communities using the relationship between users. Community detection algorithm based on modularity is a classical kind of community detection algorithm based on the network structure.
Newman and Girvan proposed an evaluation function of network modularity, that is, mod-ularity Q. Q function is the difference of real connected number in a community and expected connected number in a community with random connection and it describes the good and bad of detected community [4]. Clauset improved the fast Newman algorithm through utilizing heap structure to calculate the network modularity and named it as CNM algorithm in which a sparse matrix is employed to express the difference of modularity between nodes and Maxheap is used for saving the maximum modularity difference. Every time, a maximum value is selected from the Maxheap and combined with the correlative nodes into a community, and then the sparse matrix and heap are updated. The process does not terminate until the whole network has only a com-munity [5]. Chen et al. brought forward a kind of local comcom-munity detection algorithm called as LCE algorithm in which the nodes with local maximum modularity are selected as the core nodes, and the core nodes are expanded in terms of the modified local modularity R. This algorithm can detect the overlap of community and is good for parallelization without prior knowledge [6]. Hu et al. proposed the LMDMR algorithm which is a kind of local community detection algorithm based on expanding the set of local maximum nodes and improving the index R (modified local modular-ity R). By estimating the potential of appearing in the same communmodular-ity between nodes and their neighboring nodes with two-level, this algorithm can confirm the centrality and then detect the
community through combining the modified local modularity R with the diffusive strategy of local community defined by strong community based on the phenomenon that in the special situation the index R will miss a lot of nodes belonged to strong community [7].
Compare with the CNM algorithm, these mentioned community detection algorithms based on local modularity has made some improvement in the quality of community detection but there are also some deficiencies in them, such as instability of community structure and the problem of overlapping community. Moreover, in the traditional community detection algorithms based on the network structure the social network is regarded as the static topological graph without con-sidering the interaction factors between nodes, which is no longer suitable for the modern social networks such as microblog, WeChat and so on. The information flow of nodes (users) in modern social network is usually the representative of user influence. User influence in social network means the capacity that in social network user utilize the way of spreading the information or interacting with other people to influence other people’ thoughts or motivate them to interact with others. Many experts and scholars have made many researches on the user influence in social network.
Meeyoung C., et al. made a deep research on the user behavior and user influence. This research focused on users three behaviors: being concerned, being forwarded and being called and analyzed their respective types of user influence [8]. Ye et al. divided user influence into three kinds and five sorting methods. Three kinds of influence refer to influence of number of fans, forwarding influence, replying influence. And five sorting methods means sorting by the number of fans, number of replying information, number of forwarding information, number of respondents, or number of forwarders. In this research, user influence with the largest number of respondents is regarded as the most stable and the number of respondents is used for sorting user influence [9]. Based on the interacted relationship between user influence and the correlation with the released information, Arlei Silva, et al. used HITS algorithm to obtain the score of user influence and the correlation with the released information [10].
At present, there is lack of research on user influence in combination with community detection algorithm; therefore, this paper proposes a community detection algorithm integrating with user influence.
2. The research on the community detection algorithm based on UIR-Q 2.1. The user influence factors of social network
Because the personal relationship of real life is the basis of the social network, the user’s influence of the social network is similar with their individual influence in real life. Through making an analysis of behaviors of users in sina microblog including forwarding messages, commenting on messages and replying messages, this paper constructs three factors to evaluate user influ-ence, that is, frequency of updating microblog, degree of continuous attention in fans and user’s capacity of spreading information.
2.1.1. The frequency of updating microblog
The calculating formula can be expressed as follows.
Ai=
ni
Ti
(1)
In this formula,Airepresents the frequency of updating microblog in the statistical period unit for
one user.Tirepresents a statistical period. nirepresents the total number of forwarding,
releas-ing, commenting on and replying messages in microblog in the statistical period unit for one user.
2.1.2. The degree of continuous attention in fans
The degree of continuous attention in fans denotes the degree that fans are interested in the previous released messages in microblog. This factor is defined as the ratio which the times of the user j forwarding, commenting on and replying messages in user i’s microblog accounts for the total times of releasing messages in microblog in the statistical period unit. It can be represented as the following formula.
R(i, j) = Rt(i, j) + 1
SC(i) + 1 (2)
In this formula, Rt (i, j) represents the total times which the user j forwards and comments on messages in user i’s microblog and SC (i) represents the total times which the user i releases and forwards the messages in microblog in the statistical period unit. If the times which user j forwards or comments on the messages in user i’s microblog is high in the statistical period unit, it is reasonable to believe that user j will do the same thing in future. R (i, j) represents the degree of attention of user j to user i in the form of probability.
2.1.3. The user’s capacity of spreading information
The concept of user’s capacity of spreading information can be defined as the frequency of updating microblog in combination with the degree of continuous attention in fans. S (i, j) represents the multiply between the user i’s frequency of updating microblog and the degree of continuous attention of user j to user i. The formula can be described as follows.
S(i, j) =Ai·R(i, j) (3)
In this formula, the user’s capacity of spreading information reflects the average which user i delivers the volume of information to fan j in statistical period.
2.2. Research on user influence based on PageRank
2.2.1. PageRank algorithm and the solution of RankSink phenomenon
In PageRank algorithm [11], PR value is used for representing the authority of page. The calculating way of distribution of PR value in PageRank algorithm can be described as follows.
P R(v) =c X
u∈U(v) P R(u)
N(u) (4)
PR values of other pages are equal to 0. Larry Page called this phenomenon as the RankSink phenomenon. In order to eliminate the problem, Larry Page introduced the damping factor into this algorithm to represent the probability of random access to the page and modified the formula (4) with the following formula (5).
P R(v) = (1−d) +d X
u∈U(v) P R(u)
N(u) (5)
In the formula (5), d, as the damping factor, represents that when user clicks some page the redirected URL will be clicked with the probability d and the page will redirect other URL with the probability from 1 to d.
In calculating the user influence of social networks, there are two reasons why this paper uses the PageRank algorithm.
Firstly, in the microblog, users have their own relation of attention and user-fans, which are re-spectively similar to the relation of redirect-in and redirect-out. Thus, it is reasonable to believe that microblog and page have similar network structure. Secondly, evaluating a user’s influence in the social networks is similar to the evaluation of authority which web is in the network in the PageRank algorithm.
Therefore, using the PageRank algorithm to calculate the user influence of microblog is equal to calculate the users PR value. Then, the user with big influence can be found through ranking the PR value so that the information prediction can be made.
2.2.2. The improved user influence rank algorithm based on PageRank
In the PageRank algorithm, the PR value of every page is distributed to the redirect-in URL of page on average. In order to avoid the disturbance caused by zombie fans and onlredirect-ine water army and improve the accuracy of evaluating user influence in the analysis of user influence of social networks, this paper introduces the user influence factors to improve the PageRank algorithm and proposes the improved user influence rank algorithm based on PageRank.
The basic idea of UIR algorithm is that the degree of continuous attention in fans is regarded as damping factor; when the algorithm distributes the value of influence, user’s capacity of spreading information is taken into consideration and users with strong capacity of spreading information can be distributed more UIR value in a big probability while those who have weak capacity can be distributed less UIR value in a big probability as well. In the improved user influence rank algorithm based on PageRank, the formula of calculating user influence rank can be expressed as follows.
U IR(u) = (1−R(u, v)) +R(u, v) X
v∈E(u)
B(u, v)U IR(v) (6)
In this formula, E(u) is the use u’s fans set and R(u,v) means the degree of continuous attention in fans which is determined by the frequency of fans forwarding messages from users’ microblogs. B(u,v) represents the user v’s capacity of spreading information to user u and is determined by the ratio of user u’s capacity of spreading information accounting for the sum of all fans capacity of spreading information. The calculating formula can be described as follows.
B(u, v) =P S(u, v) f∈E(v)S(f, v)
(7)
All users’ UIR value can be initialized to 1 and after being repeatedly iterative calculated by formula (7), the UIR value tends to convergence. At that time, the UIR algorithm will be terminated and all users’ UIR values of network can be obtained. The specific algorithm can be described as follows.
2.3. The algorithm idea of community detection algorithm based on UIR-Q
Algorithm 1UIR algorithm
Input: List<Node>U//U is all users’ set.
Output: List<Node>U//U is a set of users whose influence value is calculated. BEGIN
For each u in U
Obtaining the fans set E from user u
Calculating the updating frequencyAi according to the formula (1).
For each e in E
Calculating R(i,j) according to formula (2) Calculating S(i,j) according to formula (3) Endfor
Endfor
While the UIR value cannot reach the stable situation do for u in U
Obtaining the fans set E from user u for e in E
Calculating user u’s influence delivered by user e according to formula (6) and updating Endfor
Endfor Endwhile return U ENG BEGIN
nodes of this local community, and then calculate the new local modularity of new local community when every neighboring node is added into this local community. In this case, the neighboring node with the biggest value of new local modularity can be really added into the local community. This process is iteratively added until the value of Q of the local community cannot be increased. At that time, the local community reaches saturation. The value of Q can be defined as the following formula.
Q= Lin Lin+Lout
(8)
In this formula,Linrepresents the number of edges whose connection happens in all nodes in the
community andLoutrepresents number of edges whose connection happens between the nodes
within the community and nodes outside the community.
The value of Q represents the boundary characteristic of community, that is, if a node is added into the community to make the value of Q increase, more edges are added into the community, which leads to the situation that the edges outside the community become sparse.
Based on the idea of above-mentioned CNM algorithm [12, 13], the paper proposes a kind of community detection algorithm (UIR-Q) integrated with user influence.
The basic idea of community detection algorithm based on UIR-Q is described as follows. 1) Initializing the network properties. Through the process of read-in the network, every node in the network is assigned to an ID and the properties of degree of node, influence and the community label.
2) Selecting initial node. The UIR value of every node is put in order from big to small and a set queue is obtained. From the set queue, the node that the value of community label is null and the UIR value is maximum is selected as the initial node of new community every times. If the queue is null, step 8 is carried out. Otherwise, the node of queueviwith the maximum UIR value is used
for initializing the communityCj. The Q value ofCjis initializing to 0.
3) Finding the candidate neighbor nodes set. The external node which has connection with the nodes of theCjis added into the candidate neighbor nodes set B.
4) Forming the community structure. The new local modularityqv is calculated when every node
is used for updating theQc, and the corresponding node v of is added into the communityCj. The
community label of node v is added into the j and the node v in the queue is deleted. Ifqv < Qc,
step 6 is carried out.
5) Repeating step 3) and step 4). 6) Obtaining the community j.
7) Repeating step 2), step 3), step 4), step 5) and step 6). 8) Obtaining clustering result.
This algorithm can be described as the following algorithm 2.
Algorithm 2Community detection algorithm based on UIR-Q Input: List<Node>U //U is the set of all users
Output: List<Community>CS //CS is the set of detected community BEGIN
U=UIR(U)//Calling algorithm 1 to calculate user influence Putting U in order
WHILE there is node in the U, do Initializing the new community C
Finding the node i with the maximum UIR value from U and adding it to the community C WHILE there is no saturation in the C
Calculating B, set of neighboring node of C
Calculating the new Q value (qv) when every node in the B is added into the C
Finding out the maximumqv
IFqv> Qc
Adding the corresponding node ofqvinto the C
Deleting the corresonding node ofqvfrom U
Q =qv
ELSE C reaches saturation ENDIF
ENDWHILE
Saving the community C into the community set Cs Deleting the node i from U
ENDWHILE RRTURN Cs ENG BEGIN
3. Experiment and analysis
3.1. Hardware and software environment
The cluster system of experimental platform consists of seven personal computers among which a computer is used as master and the other six computers as slavers. Ubuntu 12.04 is installed into every personal computer and The environment of Spark [14], Hadoop [15] and Yarn is established in Ubuntu. The community detection algorithm based on UIR-Q will be parallelized under the environment. The specific configuration of hardware and software is shown in the table 1.
Table 1. The configuration of cluster
Name Specific configuration PC Intel core i3 3.2 GHz, 8G RAM, 500G Hard Disk
Ethernet 100 Mb/s
Operation system Ubuntu 12.04 LTS
Java JDK 1.8
Hadoop (Including Yarn) Hadoop 2.2.0
Spark Spark 1.0
Table 2. The comparison of different algorithms
Algorithm NMI Qov The number of communities
CNM 0.735 0.729 23
LCE 0.827 0.787 37
LMDMR 0.751 0.704 33
3.2. Dataset of experiments
All data of this experiment is a dataset which contains 3458 users’ sina microblogs and includes information of microblogs, the retransmission relation of microblogs, users’ information, users’ friendship and other data.
3.3. Evaluation metrics
3.3.1. Normalized Mutual Information (NMI)
Normalized Mutual Information (NMI), proposed by Lancichhetti for detecting the eval-uation index of community, can be used for effective evaluating the accurateness of detecting overlapping community [16]. NMI represents the ”mutual information” between the set of commu-nity detected by the algorithm and the set of real commucommu-nity structure and its value shows the degree of consistency between these two communities. The NMI value is usually between 0 and 1. The bigger the NMI value is, the better the result of community detection is. Its definition can be shown as the following formula.
N M I= I(π
a,πbrespectively denotes the different community
structures.k(b)means the number of communities in the community structureπa.na
hdenotes the
number of nodes of the hth community in the community structureπa. n
h,ldenotes the number of
nodes which simultaneously exist in thehth community of the community structureπaand thelth
community of the community structureπb.
3.3.2. Overlapping Modularity (Qov)
In order to conveniently evaluate the overlapping community structure, Nicosia, et al. proposed theQov function [17], which is similar to Q function. The value ofQov function ranges
from 0 and 1. The bigger the value ofQov function is, the better the overlapping community
structure is. Its definition can be shown as the following formula.
Qov=
In the formula (10), m denotes thenumber of edges in the graph. δ(Ci, Cj, C)denotes the
affilia-tion relaaffilia-tionship between node i and node j to community C and it can be expressedby the formula (11).
δ(Ci, Cj, C) = (
1, i∈C, j∈C
0, otherwise (11)
When node i and node j belong tothe same community,Aij is equal to 1,otherwise, it is 0. kouti
denotes the out-degree of node i, that is, the number of connected edges between node i and the nodes beyond the community C. The formula of calculatingβout
l(i,j),cis shown as the following
In the formula (12),∝i,cdenotes the strength coefficient of node i belonging to community C and
its value is assigned to1/n. n means the number of communities to which node i belongs. kin j
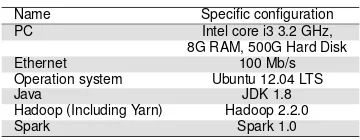
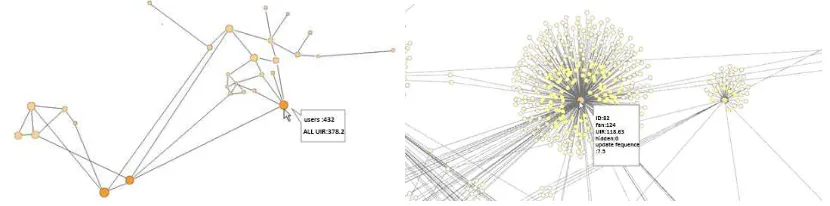
Figure 1. The communities structure Figure 2. The internal structure of communities
nodes inthe community C. The formula of calculatingβin
l(i,j),c is shown as the following formula
(13).
βinl(i,j),c= P
i∈VF(∝i,c,∝j,c)
|V| (13)
Function F is shown as the following formula (14).
F(∝i,c,∝j,c) =
1
(1 +e−f(∝i,c))(1 +e−f(∝j,c)) (14)
Function f is selected as the following formula (15) according to the literature [27].
f(x) = 60x−30 (15)
3.3.3. The number of communities
The number of communities denotes the number of sub-communities of executing the community detection algorithms on the dataset of social network.
3.4. The result and analysis
The result obtained from the community detection algorithm based on UIR-Q which is executed on the dataset of sina microblog is shown in a visible way as the following figure 1, figure 2 [18]. According to these two figures, it can be found that the problem of overlapping community is improved and the friends are roughly evenly distributed around the user.
The comparison between the community detection algorithm based on UIR-Q and the above-mentioned community detection algorithms based on local modularity can be shown as the table 2. According to the table 2, the NMI value is the highest in the community detection algorithm based on UIR-Q, while its Qov value is just lower than LCE algorithm. In LCE algorithm, 37
communities including unstable communities are detected. These unstable communities should attach to other bigger communities. In the UIR-Q algorithm, there is a relatively good balance among NMI value, modularity and the number of communities.
4. The conclusion and the future work
social network with uncertain structure and large scale. However, the phenomenon of overlapping communities cannot be completely eliminated in this algorithm. Therefore, the future work will be focused on further improving the quality of community detection.
Acknowledgements
This work is supported in part by Humanities and Social Science Youth Fund Project of Ministry of Education, P. R. C, No.13YJCZH028.
References
[1] Lim K H., Datta A.. Following the follower: Detecting communities with common interests on Twitter.In Proc. of the 23rd ACM Conf. on Hypertext and Social Media, New York: ACM Press. 2012; 317-318.
[2] ]Dourisboure Y., Geraci F., Pellegrini M.. Extraction and classification of dense communities in the Web.In: Proc. of the 16th Intl Conf. on World Wide Web, New York: ACM Press. 2007; 461-470.
[3] Asur S., Parthasarathy S., Ucar D.. An event-based framework for characterizing the evo-lutionary behavior of interaction graphs. ACM Trans. on Knowledge Discovery from Data (TKDD). 2009; 3(4):16.
[4] Newman MEJ, Girvan M.. Finding and evaluating community structure in networks.Physical Review E. 2004; 69(2):026113.
[5] Clauset A.Newman M E J, Moore C.. Finding community structure in very large networks. Physical Review E. 2004; 70(6): 066111.
[6] Chen Q., Fang M.. An Efficient Algorithm for Community Detection in Complex Networks. THE 6TH sna-kdd Workshop. 2012; 733-740.
[7] Yu Hu. Research on community dectection algorithms in complex network based on local expansion. [D].Changchun: Jilin University, 2015.
[8] Meeyoung C.. Measuring user influence in twitter: The million follower fallacy.Proceedings of International Conference on Weblogs and Social Media. 2010; 887 -893.
[9] Shaozhi Ye, S. Felix Wu. Measuring Mseeage Propagation and Social Influence on Twit-ter.com.SocInfo 2010. 2010; 223-228.
[10] Arlei Silva,Sara Guimares, Wagner Meira,Jr. Mohammed Zaki. ProfileRank: Finding Rele-vant Content and Influential Users Based on Information Diffiision.Proceedings of the ACM International Conference on 7th Workshop on Social Network Mining and Analysis. 2013; 667-773.
[11] Page L., Brin S., Motwani R, et al.. The pagerank citation ranking: Bringing order to the web. Stanford Digital Libraries. 1999; 344-349.
[12] Aaron Clauset A.. Finding local community structure in networks.Phys. Rec. E. 2005; 72(2): 26132-26137,
[13] Lyric D., Jonas K., Stefan N., et al.. Predictng movie prices through dynamic social network analysis.Procedia Social and Behavioral Sciences. 2010; 2: 6423-6433.
[14] Spark.[EB/OL]. http://spark.apache.org/.
[15] Dhruba Borthaku. The Hadoop Distributed File System: Architecture and Design. Retrieved from.http://hadoop.apache.org/common/. 2010.
[16] A. lancichineet, S. Fortunat, J. Kertesz. Detecting the Overlapping and Hierachical Commu-nity Structure in Complex Networks.New Journal of Physics. 2009; 11(3):033015.
[17] V Nieosia, G mangionoi, V Carehiolo, M Malgeri. Extending the definition of modularity to Directed graphs with overlapping communities. Journal of Statistical mechanics: Theory and Experiment. 2009; P03024.