DOI: 10.12928/TELKOMNIKA.v13i1.1320 65
Ultrasonic Tomography of Immersion Circular Array by
Hyperbola Algorithm
Liu Yang1*, Chunguang Xu1, Xianghui Guo1, Liping Wang2 1
Key Laboratory of Fundamental Science for Advanced Machining, Beijing Institute of Technology 5 Zhongguancun South Street, Haidian District, Beijing, 100081, China
2
Sansom Institute for Health Research and School of Pharmacy and Medical Sciences, University of South Australia, Adelaide, South Australia, 5001, Australia
*Corresponding author, e-mail: [email protected]
Abstrak
This paper presents a development and research of a non-invasive ultrasonic tomography for imaging gas/liquid two-phase flow. Ultrasonic transmitting and receiving are implemented using a circular array model that consists of 36 transducers. COMSOL Multiphysics® software is adopted for the simulation of the ultrasonic propagation in the detecting zone. Various two-phase flows with different gas distributions are radiated by ultrasonic waves and the reflection mode approach is utilized for detecting the scattering waves after the generation of fan-shaped beam. Ultrasonic attenuation and sound speed are both taken into consideration while reconstructing the two-phase flow images under the inhomogeneous medium conditions. The inversion procedure of the image reconstruction is realized using the hyperbola algorithm, which in return demonstrates the feasibility and validity of the proposed circular array model.
Kata kunci: Ultrasonic Tomography, Reflection Mode, Hyperbola Algorithm
1. Introduction
Two-phase flow is widespread in lots of industrial applications, such as the filling operation in the paint, detergent and cosmetic, as well as the transportation of drugs in the pharmaceutical industry where bubbles may degrade the product [1]. Therefore, the detection of bubbles is quite necessary in these fields. For this reason, many types of tomographic methods have been developed to measure the two-phase flow. Haibo Jin et al. used Electrical Resistance Tomography (ERT) technique to investigate the air-water two-phase flow in a bubble column with a height of 2m and a diameter of 0.282m. Sauter diameters of bubbles were obtained and the local axial velocity of the two-phase flow was calculated [2]. I. Ismaila et al. pointed out that Electrical Capacitance Tomography (ECT) could deal with the complexity of multi-phase flow measurement by explicitly deriving the component distributions on two adjacent planes along a pipeline [3]. Robert Banasiak et al. presented a preliminary study on automated two-phase gas-liquid flow pattern identification based on a fuzzy evaluation of series of reconstructed 3D ECT volumetric images [4]. These tomography methods were based on Electrical Impedance Tomography (EIT), which did not have a spatial resolution as high as some other imaging modalities, like Magnetic Resonance Imaging (MRI), or Ultrasound Computed Tomography (UCT).
gas/liquid flow. The simulation results indicated a good detection of 10-mm gas bubbles in a 100-mm diameter acrylic vessel [12].
Although there has been a rapid development in the field of monitoring the two-phase flow, the accurate measurement is still a challenge for researchers in process tomography. The reconstructed images are poor, particularly in the center area, because of ill-posed inverse problems and limited measurement data [12]. When the wavelength of the single ultrasound pulse is comparable to the bubble diameter, the reflected wave exhibits complex behaviors that depend on the size and shape of the interface [13]. It may lead to a blurry distributing image of multi-bubbles in the liquid. In this paper, a circular array model with its sensitizing zone at the center area is firstly established. And then, 36 transducers are evenly embedded in the wall of the container. In this way, an extensive dataset is provided from which the spatial distribution of the ultrasonic propagation parameters can be reconstructed using a suitable inversion procedure. Finally, multi-bubble images of the two-phase flow are reconstructed and the accurate position and size of each bubble can be determined.
2. Model and Method
2.1. Immersion Circular Array
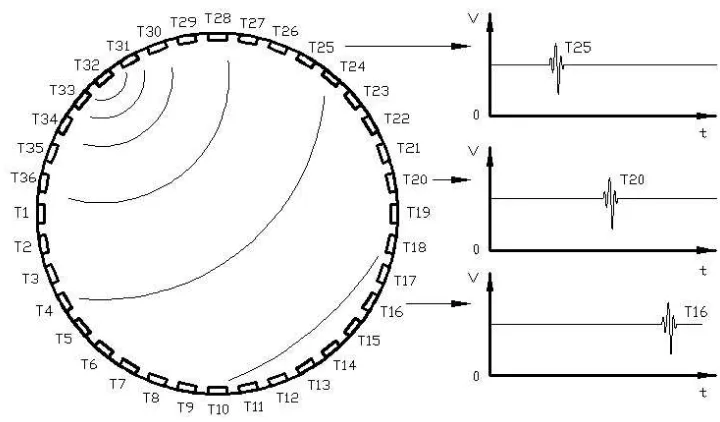
The circular array and the configuration of the propagation are sketched in Figure 1. In this figure, 36 transducers with 0.5MHz frequency and 5mm diameter are evenly spaced around the circumference of the container, in which the water is filled as the couplant. At each moment, one transducer is used as the transmitter to generate a fan-shaped ultrasonic radiation. After that, all the transducers in the circular array are used as the receiver for detecting and measuring the signals individually. Ultrasonic generating and signal receiving are carried out in sequence so that the reconstruction data can also be collected in order.
Figure 1. Configuration of ultrasonic propagation inside the circular array.
2.2. Ultrasonic Propagation
When the ultrasonic is propagating in the detection-zone, the total pressure field in the water is calculated by solving the transient pressure wave equation [15]:
dipole source, Qm is the monopole source. If there is no dipole source or monopole source, thevariables qd and Qm should be 0.
where p stands for the propagation pressure field, pb stands for the background pressure field. In the circular array model, the cylindrical wave radiation is adopted to obtain a wide range covering of the ultrasonic field and more reconstruction data. Then, the cylindrical wave radiation equation is:
where n means the normal vector of the radiation source, and
where pi is the incident pressure field which is a function of space.
2.3. Hyperbola Algorithm
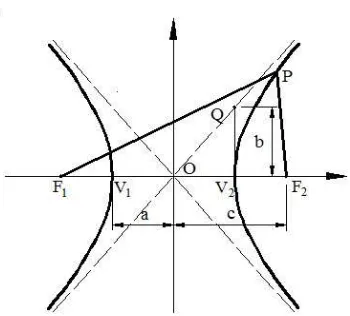
A hyperbola may be defined equivalently as the locus of points where the absolute value of the difference between the distances and the two foci is a constant. Figure 2 shows the geometric parameters of a hyperbolic curve. In this figure, F1 and F2 are two focal points of the
hyperbola with the coordinates of
c,0
and
c,0 . O is the origin of the axes and the centersymmetric point for the hyperbolic curve. V1 and V2 with the coordinates of
a,0
and
a,0 are two points of the intersection of the horizontal axis and the two branches of the hyperbola, respectively. Line V Q2 is perpendicular to the horizontal axis and it meets the asymptotes atFigure 2. Geometric parameters of a hyperbola
Figure 3. Schematic diagram of hyperbola algorithm imaging
According to the definition of the hyperbola:
1 2 2
PF PF a (5)
where a is the distance between the vertex of a hyperbola and the origin of the axes, which is obviously a constant. Supposing F1 and F2 can be replaced by two receiving transducers, then P can be considered as a certain point on the tested scatterer which may reflect the ultrasonic pulse. Therefore, it is not necessary to care about the position of the transmitting transducer because the distance from the transmitter to the scatterer is the same for each receiver [16].
Once the parameter a is obtained, the parameter b can be easily induced from the equation:
2 2 2
a b c (6)
where b is the length of line V Q2 . Since parameter c has also been obtained from the coordinates of F1 and F2, the slope of the asymptotic line of the hyperbola is b a.
The tested scatterer is supposed on the hyperbolic curve, however only one hyperbola is insufficient to locate the tested scatterer. Since fan-shaped ultrasonic waves are reflected by the scatterer in many directions, hyperbolas with different parameters and coordinates can be drawn through one transmitting transducer and different receiving transducer pairs.
Figure 3 shows the two hyperbolic curves intersecting at P and P'. If the hyperbolic curve on the right is extended, one more intersection will appear. In fact, two hyperbolas may have at most 4 points of intersection and theoretically all of them are likely to be the reflection points. With the changing of the transmitting transducer in sequence and the permutation and combination of the receiving transducer pairs, a sufficient number of the hyperbola is obtained and superimposed together. Then, the image of the tested scatterer is reconstructed.
Hyperbola approach considers the transducers in groups of three, one acting as the transmitter and two as the receivers. The differences between the arrival times of the scattered signals at two receivers are given by:
stand for the coordinates of the scatterer.
In the circular array model, the transducer array cannot be rotated because they are all embedded in the wall of the water container. So, the number of received signal pairs for each time (or the hyperbolas can be drawn) is given by:
1
L N N (9)
When the process is repeated for each transmitting transducer, the number of final receiving signals should be:
1
L N N N (10)
The intensity of pixels at the coordinates
x yp, p
in the reconstructed image can becalculated by the cross correlations of receiving signal pairs and the summation operation of the cross correlations:
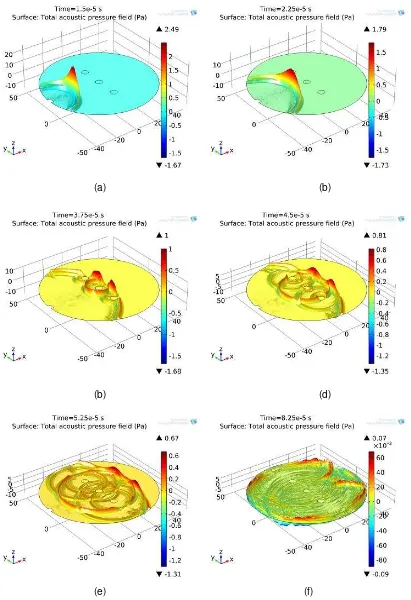
Transient simulation is carried out using the COMSOL Multiphysics® software to demonstrate the behaviour of the ultrasonic wave propagation inside the circular array. Figure 4 shows the scattered acoustic pressure distribution of 3 air bubbles at 6 different times of 5
(a) (b)
(b) (d)
(e) (f)
Figure 4. Transient distribution of the sound pressure scattered for 3 air bubbles. (a) and (b) show the transmitting and propagating of the fan-shaped ultrasonic wave in the
water. (c) and (d) represent the wave reflection (mainly backward) and diffraction (mainly forward) due to the blocking of the air bubbles. (e) and (f) display the secondary reflection and multi-reflection from the air bubbles. During the whole process, the ultrasonic energies attenuate
As can be seen in this figure, 3 tested round air bubbles with the radius of 3mm are longitudinal arranged inside the array and the distances between the adjacent bubbles are all 20mm. Only one transmitting transducer is visible while the other transducers are hidden which makes the propagation process more clear. The scaling factors of the height are not uniform for the 6 different times, but it is useful to get a better observation. The coupling medium inside the circular array is the water and the radii of the air bubbles are all 3mm. For constructing an infinite propagation space, an impedance matching layer is set on the outer boundary of the circular array. Consequently, the propagation wave presents nearly no reflection from the outer boundary.
3.2. Image Reconstruction
The reflection-mode sensing in UCT processes is based on the time-of-flight and the amplitude measurement of reflection path signals due to the existence of an object between the transmitting transducer and the receiving transducers. When the tested area of the circular array is blocked with objects, the ultrasonic propagation path is changed and the amplitude of the received signal is decreased.
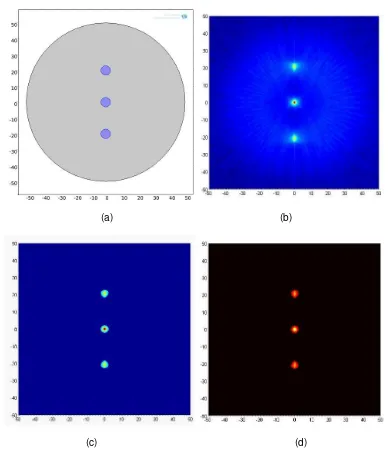
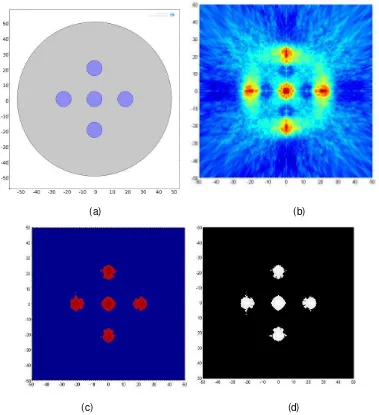
Figure 5 shows 3 tested air bubbles and the reconstructed images. The pressure of each bubble is set to be equal to the atmospheric pressure
5
1.01e Pa since the hydraulic pressure is negligible here. And the density of the bubble is 1.195kg m (saturation state) and 3 the sound speed in the air bubble is 344m s
As seen in Figure 5, the reconstruction intensity of the round bubble at the center of the array is higher than the other two bubbles. So, it is concluded that the sensitivity of the circular array increases with its radius and the peak locates at the centre .
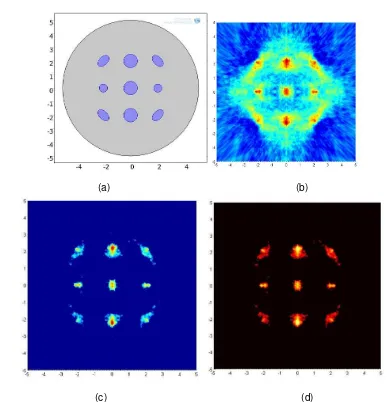
Figure 6 displays 5 round air bubbles and their reconstructed images. The tested bubbles with a radius of 5mm are spaced around the center of the circular array. The horizontal and longitudinal distances of each air bubble are all 20mm. With the increase of the tested bubble numbers, the outline of the single bubble image is distorted whereas its size dimension shows better agreement with the tested bubble.
In the above experiment, the ultrasonic wavelength in the water is approximately 3mm. By comparing Figure 5 with Figure 6, it is found that when the ultrasonic wavelength is close to the dimensions of the tested air bubbles, the size of the reconstructed bubble images do not agree with the bubble size very well. However, the outline shows a good agreement with each other in the two figures. When the ultrasonic wavelength is smaller than the dimension of the tested air bubbles, the correct size dimension can be reconstructed.
(a) (b)
(c) (d)
Figure 5. 3 air bubbles and the reconstructed images obtained by hyperbola algorithm and threshold filtering (Unit: mm).
(a). 3 tested round air bubbles are longitudinal arranged within the immersion ultrasonic array, the radius of each bubble is 3mm and the distances between adjacent bubbles are 20mm. (b). The corresponding reconstructed image of the 3 air bubbles. (c) and (d). Images after threshold
(a) (b)
(c) (d)
Figure 6. Five (5) round air bubbles and the corresponding reconstructed images obtained by hyperbola algorithm (Unit: mm).
(a). 5 tested bubbles with the radius of 5mm are spaced around the center of the circular array. The horizontal distance and longitudinal distance of each adjacent air bubble are 20mm. (b). The corresponding reconstructed image of the 5 air bubbles. (c). The reconstructed image after
(a) (b)
(c) (d)
Figure 7. 9 air bubbles with different sizes and the corresponding reconstructed images obtained by hyperbola algorithm (Unit: mm).
(a). 9 tested air bubbles with different sizes and shapes. (b). The corresponding reconstructed image of 9 air bubbles. (c) and (d). Images after threshold filtering
Hyperbola method emphasizes the cross-correlation calculation under the circumstance of the permutation and the combination of all possible receiving signals. The most important benefit is that the number of potential combinations has gone up to N N
N1 2
. The comparatively clear outline of the reconstructed image can be obtained by the threshold filtering. However, the most effective approach for improving the resolution and contrast of the reconstructed images is increasing the frequency and number of the transducer.4. Conclusion
two-phase flow. The detecting capability can be further improved by increasing the transducer frequency and the imaging results indicate that the proposed model can be potentially applied to bubbly flow which requires a further investigation to determine the accurate gas/liquid interface.
References
[1] Detsch RM, Sharma RN. The Critical Angle for Gas Bubble Entrainment by Plunging Liquid Jets.
Chemical Engineering Journal. 1990; 44(3): 157-166.
[2] Jin H, Lian Y, Yang S, He G, Guo Z. The parameters measurement of air–water two phase flow using the electrical resistance tomography (ERT) technique in a bubble column. Flow Measurement and Instrumentation. 2013; 31: 55-60.
[3] Ismail I, Gamio J, Bukhari SA, Yang W. Tomography for multi-phase flow measurement in the oil industry. Flow Measurement and Instrumentation. 2005; 16(2): 145-155.
[4] Banasiak R, Wajman R, Jaworski T, Fiderek P, Fidos H, et al. Study on two-phase flow regime visualization and identification using 3D electrical capacitance tomography and fuzzy-logic classification. International Journal of Multiphase Flow. 2014; 58: 1-14.
[5] Spivakov BY, Geckeler K, Bayer E. Liquid-phase polymer-based retention—the separation of metals by ultrafiltration on polychelatogens. Nature. 1985; 315(6017): 313-315.
[6] Ohkawa M, Kawata N, Uchida S. Cross-sectional distributions of gas and solid holdups in slurry bubble column investigated by ultrasonic computed tomography. Chemical Engineering Science. 1999; 54(21): 4711-4728.
[7] Rahim RA, Rahiman M, Chan K, Nawawi S. Non-invasive imaging of liquid/gas flow using ultrasonic transmission-mode tomography. Sensors and Actuators A: Physical. 2007; 135(2): 337-345.
[8] Carvalho RD, Venturini O, Tanahashi E, Neves Jr F, França F. Application of the ultrasonic technique and high-speed filming for the study of the structure of air–water bubbly flows. Experimental Thermal and Fluid Science. 2009; 33(7): 1065-1086.
[9] Rahiman MHF, Rahim RA, Tajjudin M. Ultrasonic transmission-mode tomography imaging for liquid/gas two-phase flow. Sensors Journal, IEEE. 2006; 6(6): 1706-1715.
[10] Rahiman MHF, Zakaria Z, Rahim RA, Ng WN. Ultrasonic tomography imaging simulation of two-phase homogeneous flow. Sensor Review. 2009; 29(3): 266-276.
[11] Abbaszadeh J, Rahim HA, Rahim RA, Sarafi S, Nor Ayob M, et al. Design procedure of ultrasonic tomography system with steel pipe conveyor. Sensors and Actuators A: Physical. 2013; 203: 215-224.
[12] Yunus F, Rahim R, Aw S, Ayob N, Goh CL, et al. Simulation study of electrode size in air-bubble detection for dual-mode integrated electrical resistance and ultrasonic transmission tomography.
Powder Technology. 2014; 256: 224-232.
[13] Murai Y, Tasaka Y, Nambu Y, Takeda Y, Gonzalez ASR. Ultrasonic detection of moving interfaces in gas–liquid two-phase flow. Flow Measurement and Instrumentation. 2010; 21(3): 356-366.
[14] Sanpanich A, Hamamoto K, Sangworasil M, Pintavirooj C. 2D ultrasonic reflection tomography by linear array transducer and wave reflector. IEEE-RIVF International Conference on Computing and Communication Technologies. Da Nang, Vietnam. 2009: 340-343.
[15] Abbaszadeh J, Rahim HBA, Rahim RB, Sarafi S, Frequency analysis of ultrasonic wave propagation on metal pipe in ultrasonic tomography system. Sensor Review. 2014; 34(1): 13-23.