DOI: 10.12928/TELKOMNIKA.v13i3.1474 963
ATLAS: Adaptive Text Localization Algorithm in High
Color Similarity Background
Lih Fong Wong*1, Mohd. Yazid Idris2
Faculty of Computing, UniversitiTeknologi Malaysia, 81310 Skudai, Johor, Malaysia *Corresponding author, e-mail: [email protected], [email protected]
Abstract
One of the major problems that occur in text localization process is the issue of color similarity between text and background image. The limitation of localization algorithms due to high color similarity is highlighted in several research papers. Hence, this research focuses towards the improvement of text localizing capability in high color background image similarity by introducing an adaptive text localization algorithm (ATLAS). ATLAS is an edge-based text localization algorithm that consists of two parts. Text-Background Similarity Index (TBSI) being the first part of ATLAS, measures the similarity index of every text region while the second, Multi Adaptive Threshold (MAT), performs multiple adaptive thresholds calculation using size filtration and degree deviation for locating the possible text region. In this research, ATLAS is verified and compared with other localization techniques based on two parameters, localizing strength and precision. The experiment has been implemented and verified using two types of datasets, generated text color spectrum dataset and Document Analysis and Recognition dataset (ICDAR). The result shows ATLAS has significant improvement on localizing strength and slight improvement on precision compared with other localization algorithms in high color text-background image.
Keywords: text localization, color similarity, adaptive threshold
Copyright © 2015 Universitas Ahmad Dahlan. All rights reserved.
1. Introduction
Text in an image exist in two forms either caption text or scene text [1]. Both text forms are important source for describing the semantic content of images [2] such as: in geo-location application, obtaining objects information, for indexing, categorizing and searching process [3]. Text extraction is an important research area [4], which comprises three stages [5]: text localization, text segmentation and text recognition. Text localization is to locate the position of various texts in the image while text segmentation involves separation between text pixels and background pixels. The text pixels are further converted to soft text in final stage of text recognition.
Text localization, as the main element in text extraction framework, is the first process that affects the overall accuracy of text extraction result. It had been taken seriously by researchers in order to produce a high accuracy text localization algorithm which can localize the text in various image conditions whether in caption or scene text. Caption text (also known as graphic text, superimposed text or artificial text) is the text that is post-added or created through image editing tools. This type of text is commonly seen on the advertising and informative image like blog header, brochure, and logo. On the other hand, scene text is the original text in the image. It can be seen on most of the nature images captured by digital devices. Figure 1 shows the examples of the caption text and scene text.
Both caption text and scene text have three important properties that can affect text localization result [6]: text geometry, text color and text effect. Text geometry refers to the relative shape and position of the text, which includes: sizes, fonts, alignments, directions and distances between characters. Text color simply refers to the value of integer in each color channel for each text pixel and finally, text effect refers to additional ornament or decoration on the text for example shadowed, sharpened and blurred effect. The combination of those properties creates the unpredictable text model and uncertain image background, which produce a very challenging environment for text localization.
Among these three properties, text color has a simple form of root cause but requires complex techniques to solve it. The most common situation is the existence of text with almost similar color with its background. Text localization algorithms generate high false positives errors in locating the text with high color similarity. The main reason for this localization error is the small different between the color value of text and background, which prevents most algorithms from distinguishing color spaces. Hence, it is very challenging to localize text especially text with similar background color. Yet, these types of image are quite common in the real environment. Hence, there is a need to produce an algorithm to overcome the color similarity issue.
Section 2 describes the related works on text localization algorithm. The details of ATLAS explain in Section 3 and followed by the experiment process, the experimental results and concluding remarks in Section 4 and 5.
2. Related Works
Text localization algorithms can be categorized into three categories: connected-component based (CC), texture based and edge based algorithms.
CC based algorithms analyzescolor value of every image pixels and groups their nearby pixels which have similarity in color to form a region that will be used to differentiate between text region and background region [7-9]. On the other hand, texture based algorithm employ machine learning techniques for analyzing unique patterns that appear on the text region in the image. The algorithm examines specified color distribution, either in spatial domain or in frequency domain that matches with the features of ground truth text regions [10-12]. Edge based algorithm implement a different strategy with others, instead of looking for the similar color region, edge based algorithm detect the sudden change of color value in an image region and define the region of sharp change as an edge. The edge will act as a barrier that separate between text region and background region. A pre-determined threshold is used as a minimum value to evaluate the sharp changes in pixel color. Any sharp change above the threshold will be identified as an edge [13-14].
In order to look for the edges, it requires an edge detector algorithm. Several edge detector algorithms have been introduced including Sobel [15], Roberts [16], Laplacian [17], Genetic-Ant Conoly edge detector [18] and Canny edge detectors [19]. It has been recognized that [20-22] Canny edge detector produced higher accuracy and better edge image granted by its edge thinning algorithm and heuristic threshold compared with others. However, the original purpose of Canny edge detector is to extract the object features from images. To implement it on text localization algorithm, it requires some additional filtration and enhancement processes to locate the correct text edges and eliminate unnecessary edges. Enhancement on Canny edge based algorithm on the text localization as highlighted in [23-25] increases the accuracy of localizing text in images.
distribution of edges and corners. Finally, they performed segmentation on the text regions and identify the text pixels by looking for the largest frequency bin in the color histogram. Yi and Tian [24] introduced an edge-based solution on text localization with three steps: First, to cluster the edge boundaries based on bigram color uniformity; Second, to segment strokes by assigning the mean color-pair in each boundary layer. And third, use Gabor-based text features to determine the correct text regions from the candidates. Lee and Kim [25] proposed an efficient edge based text localization algorithm by proposing a two-stage conditional random field, where it utilizes both edge map and salient map to look for optimal configuration of text regions.
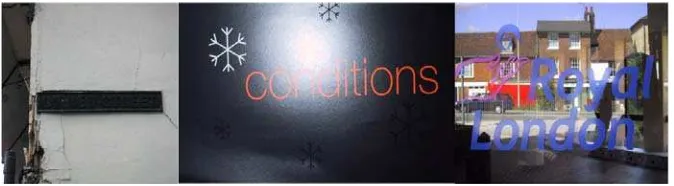
Limitation of the current algorithms [23-25] are mainly due to low resolution of image, multiple color in the text and complex background, which can be generalize as the problem of color similarity between text pixel and background pixel. For mentioned edge-based algorithms, the core function in the algorithm is Canny edge detector algorithm, which is used to discover the edges inside the image. The detected edge is then being filtered and enhanced, so that the leftovers are the edges of the text. However, it requires a specific amount of differences of color value between text pixels and background pixels before the text can be identified and located by the algorithm. Hence, the smaller of the differences between colors value (or the higher color similarity), the harder the localization algorithm can locate the position of text. Localization is likely to fail when it attempts to deal with texts that have high color similarity with its background like engraved text, text with complex background and effect of light exposure. Some examples of images are shown in Figure 2.
Figure 2. Image with High Color Similarity:engraved text (left), exposure of light (center) and complex background (right)
Implementation of adaptive threshold can solve this problem. Rong et al. [26] introduced their adaptive threshold algorithm based on the mean and standard deviation of image gradient. Another example done by Li et al. [27] where they applied Mean Shift algorithm on Canny edge detector to extract weak object. However, both algorithms focus on enhancing the Canny edge detector in a more general purpose rather than specific to text localization. There are also other enhancement works done on the detection of weak edges in other field for examples medical image [28] and radar image [29]. Existing text localizing algorithms using adaptive threshold on edge detector are relatively very few. The most related work was done by Hsia and Ho [30], but they focus on localize text in video scene using Roberts edge detector instead on Canny edge detector.
In summary, this paper focus on the enhancement of the Canny edge detector for solving the color similarity issues in text localization. A new adaptive threshold with multi-region is proposed, which focus on Canny edge detector with purpose of localizing text that have high color similarity with its background.
3. Proposed Algorithm
The proposed algorithm intends to solve the aforementioned challenges by implementing a multi-region adaptive threshold on various types of text similarity. In order to deal with uncertainty of differences in color between text pixels and background pixels, a measurement of similarity index is needed for further credit. Based on previous research, so far there is no standard measurement available to define the color similarity. Hence, this paper first proposed a measurement method for color similarity index, and next proposed a multi-region adaptive threshold for Canny edge detector by referring to its similarity index. We name it as Adaptive Text Localizing Algorithm or ATLAS. The summary of the algorithm is shown at Table 1, Table 2 and Figure 3.
Figure 3. Component Diagram of ATLAS
3.1. Text-Background Similarity Index
To show the color similarity between text pixels and background pixels, a measurement index called Text-Background Similarity Index (TBSI) is introduced which is defined as the degree of likeness for pixels value between text and background in an image region.
To calculate TBSI of an image, it is first converted into grayscale image I. The conversion to grayscale image is intended to simplify the calculation. Using a rectangle box manually mark-up of each of the ground truth regions of text. Let G
G ii | 1, 2,,N
wherei
G is the ground truth region marked and N is the total number of text regions in I. TBSI
estimation depends on the ground truth region. However, if the ground truth region is unknown, it can be replaced with region of interest. Next, for each region Gi, Otsu’s binarization algorithm
[31] is applied to get the approximated segmentation between text pixels,G ti
j andbackground pixelsG bi
j . The average gray value for text pixels and background pixels in eachregion Gi is obtained. Let G ti
be the average value for text pixels and G bi
be the averagevalue for background pixels in the regionGi. The absolute color different between text pixels
and background pixels D G
i can be calculated by using the formula:
i i
i
D G G t G b (1)
1
i
D G D G
N
(2)The purpose of calculating the average color different between text and background is to look for its percentage of the color differences. Finally, the TBSI for image can be computed using the formula:
max
1 D G TBSI
D
(3)
Where Dmax refers to maximum possible value different between text and background
pixels. In this research, grayscale image is used, hence the Dmax will be 255 (Maximum different
scenario is when two pixels with value of 0 as black and 255 as white). TBSIranges between zero and one, where higher value of TBSI represent higher similarity between text pixels and background pixels. It is considered invalid when TBSI 1 or D G
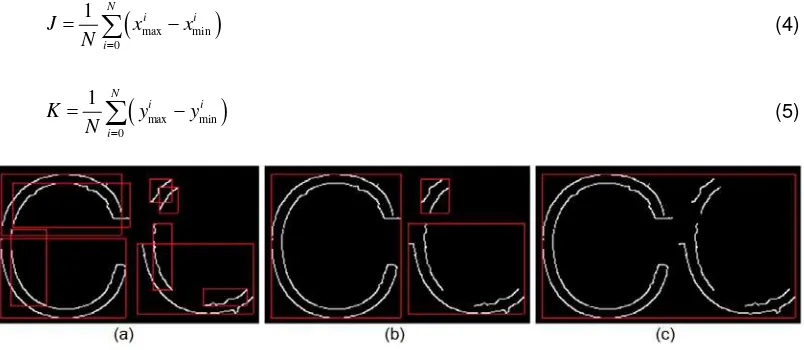
0 as these represent that there is no different between text pixels and background pixels. This situation takes place when there is only one color in the ground truth text region.Table 1. Summary of TBSI Algorithm 1. Text Background Similarity Index
1. Convert image into grayscale image.
2. Mark each of the potential ground truth regions of text. 3. For each potential ground truth regions
3.1 Apply OTSU algorithm
3.2 Obtain approximated value for text pixels and background pixels
3.3 Calculate the absolute different between text pixels and background pixels. 4. Average the absolute differences.
5. Calculate TBSI by the ratio of absolute differences to maximum possible different.
3.2. Multi Adaptive Threshold
TBSImeasures the degree of likeliness between text pixels and background pixels. Hence, it is suitable to utilize it as the adaptive thresholds for Canny edge detector algorithm by applying a low threshold value on high TBSI images and high threshold value on low TBSI
images. Different from other approaches, this research implements multi adaptive threshold on each of the possible text regions in an image to ensure that Canny edge detector do not omit any possible text region with high color similarity. Before calculating the thresholds value, simple analysis needs to be done to find the possible text regions in the image.
The proposed algorithm begins with an image , and Canny edge detector is applied to obtain an initial binary edge image by using the overall TBSIof I.Since the ground truth regions and text candidatesare unknown at the initial stage, oveallTBSI is simply calculated by taking the full input image as the region of interest. Next, edge pixels are divided into several groups, and let E
e ii| 1, 2,,N
where ei refers to a set of continuous edge pixels where the eight-connected neighbor of each edge pixels contain at least one of another edge pixel in the same group and N denotes the total edge pixel groups in E. Then, for each edge pixel group ei, a region R xi
min,ymin,xmax,ymax
is set up, where the region is enclosed by a minimumx and y coordinates
min, min
i i
x y and also maximum x and y coordinates
max, max
i i
x y result
from the overall edge pixels in ei. This simply indicates that foreach ei, the regionhas covered the minimum surface area. For any which is too small or too big, or which is having imbalance width and height ratio, it is eliminated from . Figure 4 represents the step-by-step workflow for ATLAS until obtaining initial edge pixels group.
i
Figure 4. (a) Original Image; (b) Image after applying Canny edge detector; (c) Image after edge group filtering; (d) Initial edge pixel group
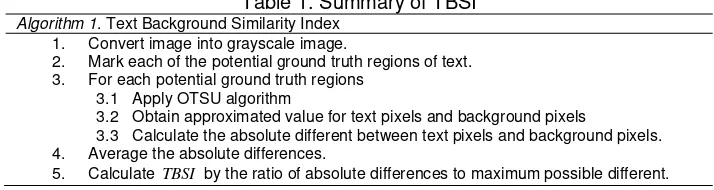
As shown in Figure 4, exposure of light in the original image increases the color similarity for the text with the background. Hence, after applying Canny edge detector, the edge inside the region with high color similarity is missing after filteration is done. In order to solve this problem, ATLAS utilized the remaining edge information on the image, and forms the edge pixel group to predict the position of the missing region.Since broken edges often exist on the result of Canny edge detector, it create a lot of small regions that will affect the complexity. Hence, for any region that it overlaps with each other, they are merged to form a new region by re-adjusting the minimum and maximum corrdinates Figure 5(b) shows the result after the first merging. After mergin steps, the leftover regionsareeach assumed to be containing either a single character or word. Therefore, the regions which are closed to each other are assumed to be the group with same feature (either text or noise). For each region, locate every region near by it, by searching the area around it by a distance of J in horizontal and K in vertical.Two regions are then merged again they are both inside each searching zone. Figure 5(c) shows the result of second merging.JandK denote to the average width of a character and average height of a character respectively and they can be obtained by:
max min
0
1 N
i i
i
J x x
N
(4)
max min
0
1 N
i i
i
K y y
N
(5)Figure 5. (a) Small regions from Canny edge detector; (b) Result on merging the overlapped region; (c) Result on merging the regions within searching range
During the failure cases in high color similarity, the miss localized characters mostly on the middle of the text as shown in Figure 4(d). Hence, for any two regions which have the same alignment and same direction, it is assumed to be on the same region but contains a missing text at the middle. Degree deviation is proposed and calculatedfor such regions before merging
them. Degree deviation is used to estimate the alignment and direction for any two regions. Consider if two regions are parallel to each other, they most likely belong to the same region. However, in real environment, text region in the image not always align with image horizontal, it may offset by a certain amount of angle from the horizontal line. Hence, by looking for the regions with similar angle deviation with each other, the possible missing text can be found. For instance, if both regions is assumed to be e1and e2. the degree of deviation between the region is calculate and depicted with tanmin and tanmax where tanmin refer to degree of deviation for
the minimum x and y coordinate while tanmax refer to degree of deviation for the maximum x
and y coordinate. Figure 6 depicts an instance where tanmin and tanmax can be obtained by:
1 2
min min
min 1 2
min min
tan y y
x x
(6)
1 2
max max
max 1 2
max max
tan y y
x x
(7)
Figure 6. (a) Degree deviation between two regions, min and maxis the degree between yellow
and red line; (b) Result after merging region with similar degree deviation
Furthermore, the degree deviation dev for both min and max can be calculated using
the equation:
max min
dev
(8)
If the dev is small, i.e. devT, both regions is merged into one by readjusting the
maximum and minimum x, y coordinates. T is the maximum limit of deviation allowed. In the
proposed system, loose strategy T 9 is taken, which equivalent to 10% of maximum
possible deviation 90. After merging process, the some regions might contain unwanted features (noise); hence region filtration is done to filter out the regions which are more likely containing noise. After, filtration, result of new edge pixel group groups '
E is then being
produced. Assume '
'
| 1, 2, , i
E e i M where '
i
e refers to missing text regions (regionsthat
added during previous merging process)and M is the total number of the regions. Each '
assumed to contain a mixture of text and noise. Hence, TBSI calculation is performed for each
'
i
e as well as the similarity index of TBSIi for that particular region. The value TBSIi is used as
weight for the threshold of edge detector. Canny edge detection is re-applied on each region '
i e of the original image I by using thresholds calculated by:
'
1 1
low low i
T T TBSI (9)
' '
2 high low
T T (10)
low
T refers to the original lower threshold used at the first stage and refers to markup factor for the threshold that reserve the upper limit growth from original threshold. In this research, the threshold is markup by 50%or 0.5. Other regions which do not fall in '
E will not be processed and retain the original edge result. Figure 7 gives an illustration of such the instance. The final edge image reveals the localized text on the region where filtrations on Equation (4-8) is re-implemented and the edge pixels are clustered.
Figure 7. (a) Second Cannyedge detector application onarea ' 1
e by usingTBSI1 as threshold;
(b) Final localized result.
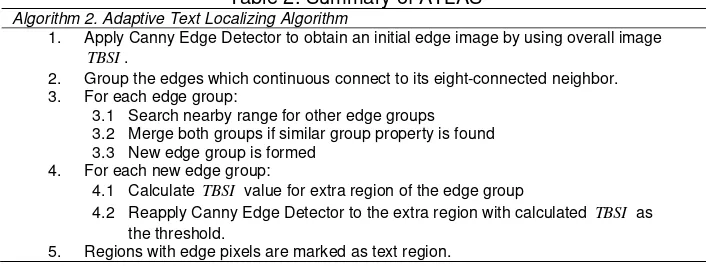
Table 2. Summary of ATLAS Algorithm 2. Adaptive Text Localizing Algorithm
1. Apply Canny Edge Detector to obtain an initial edge image by using overall image TBSI.
2. Group the edges which continuous connect to its eight-connected neighbor. 3. For each edge group:
3.1 Search nearby range for other edge groups 3.2 Merge both groups if similar group property is found 3.3 New edge group is formed
4. For each new edge group:
4.1 Calculate TBSI value for extra region of the edge group
4.2 Reapply Canny Edge Detector to the extra region with calculated TBSI as the threshold.
5. Regions with edge pixels are marked as text region.
4. Experiment and Discussion
ideal localizing strength of algorithms, which consist of images with different text-background color similarity. The second dataset was used to evaluate the precision as well as the actual localizing strength, which indicates the usability of the ATLAS, by using common images dataset.
The first dataset (self-generated dataset) of the experiment process requires images with different range of TBSI value. In order to achieve a comprehensive result, the full design of the dataset is self-generated. The text to be localized in the generated images is positioned at the center of image which is considered to be the easiest position for localization. The localizing algorithm is limited to grayscale image, hence a total of 65, 580 256 255
grayscale images were generated which comprises all possible combination between text pixels and color pixels except for the combination where both text pixels and background pixels are the same (invalid by TBSI definition). Figure 8 shows some examples of the self-generated image dataset and its corresponding TBSI.Figure 8. Image with variousTBSI; Top left:TBSI 0.2157, top right:TBSI 0.4118, bottom left:TBSI 0.6078; bottom right:TBSI 0.8039
The second dataset evaluates the actual localizing strength which is obtained by calculating the average localizing strengths on each image. Hence, the experimental process employed public image-dataset obtained from ICDAR 2011 [32], which comprises commonly seen text images. Moreover, the dataset is commonly used for text localization and text recognition for analysis in this research field. Figure 9 shows samples of text images from ICDAR 2011 dataset. The related information of dataset for first experiment and second experiment are summarized in Table 3.
Figure 9.Samples of ICDAR 2011 Images
Table 3. Dataset Desription
Dataset Self-Generated Dataset ICDAR 2011 Dataset Total Images 65,280 420
TBSI Range 0.00 – 0.99 0.140 – 0.844
Resolution 1360*1024 101*130, 109*140, 110*110, 110*152, … 980*152, 990*145, 992*592, 1625*313
Strength of algorithm can be calculated by the surface area covered by the function:
precision of similarity index p
. Precision P is taken as PNc/Nd, where Nc is the totalnumber of correct text region, and Nd is the total number of detected text region. The text region is considered localized correctly only if the outcome of localized text region covered at least 80% of the text region from ground truth region. Let the similarity index TBSI, where the values range of TBSI from zero to one, the strength of the algorithm can be express by the following equation:
1
0p d
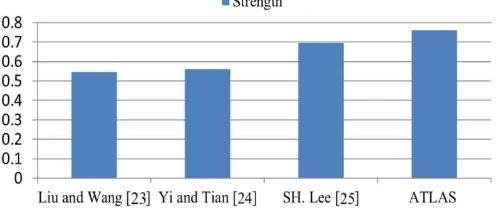
(11)Self-generated dataset uses the images with clear and unique color for each text pixels and background pixels; it eliminates all other uncertainties that can affect the localizing result except for the color similarity where this paper focuses on. All the generated images have the same texts and position but different color between text pixels and background pixels. To show the feasibility of TBSI, all probable differences in color between text pixels and background pixels are generated which consist of 65, 280 images. These images are further divided into groups categorized by its TBSI value which consists of 255 subgroups. In this experiment, the ATLAS is compared to three other algorithms: Liu and Wang’s Stroke-Like Edge based algorithm [23], Yi and Tian’s Boundary Clustering based algorithm [24] and Lee and Kim’s Two-Stage Random Field algorithm in terms of ideal localizing strength. All the four algorithms were implemented on the self-generated dataset on same computer with Intel Core i7 2.00 GHz processor and 16GB memories. The experimental results are summarized in Table 4 and Figure 10.
Figure 10. Ideal Localizing Strength Comparison between [23], [24], [25] and ATLAS
Table 4. Experiment Result from Self-Generated Dataset Algorithm Ideal Localizing Strength
ATLAS 0.760 SH. Lee [25] 0.696
Yi and Tian [24] 0.560 Liu and Wang [23] 0.545
Text localization is relatively easier for the machine when the color difference between text pixel and background pixel is big (or is small). The precision of similarity index function
p shows an ideal chart with a sharp decrease at a certain level of (See Figure 11). This simplifies the calculation of localizing strength where it can be obtained by directly taking the value at the sharp decrease point. Localizing strength is normalized to range between zero and one, and is used for judging the ability of an algorithm on localizing image with different TBSI
always successful
P1
when the input image have TBSI value lower than 0.545.Conversely, it always fail
P0
when the TBSI value of the input image is higher than 0.545. Hence, the value 0.545 becomes a boundary or limitation for the algorithm and the value can be seen as the ideal localizing strength of the algorithm.Figure 11. Precision of Similarity Index Function for [23], [24], [25] and Proposed Algorithm
Further, ATLAS is also evaluated with the same experiment (the second experiment), using common image dataset in order to evaluate the efficiency of ATLAS when implementing on real world situation. Similar to previous experiment, the efficiency of localization algorithm was evaluated by localizing strength and the localized strength of algorithm, , is calculated on
the surface area covered by the function: precision of similarity index p
. Similarly, precisionP can also be calculated by using formula PNc/Nd, where Nc is the total number of correct text region, and Nd is the total number of detected text region. The text region is considered correct only if the outcome of localized text region covered at least 80% of text region from ground truth region. Difference from self-generated dataset, public dataset is built up by discrete value of TBSI while self-generated dataset is built up by continuous value of TBSI. The calculation for actual localizing strength is then express by the following formula:
1
1 1
1
1
2 N
i i i i
i
P P TBSI TBSI
(12)The symbol N in the formula represent the total number of images in common image dataset while Pi and TBSIi represent the precision and the similarity index respectively at the i
th image.
The formula (12) is derived from the formula for the calculation of the area of trapezium on precision, P, as the base and TBSI as the height. The function: precision to similarity for the public dataset is uncertain, which is mainly caused by the existing of different TBSI within an image. The experiment considers the average value of TBSI for each image, to measure the actual localizing strength of the tested algorithm.
Table 5. Result from ICDAR 2011 Images Dataset
Algorithm Average Precision,P Actual Localizing Strength,
ATLAS 0.68 0.63 SH.Lee [25] 0.67 0.61
The experiment compared ATLAS to three others algorithms same as the first experiment [23-25], and the results are sort by actual localizing strength showed at Table 5.
In Table 5, Actual Localizing Strength (ALS) is calculated by using formula (12) while average precision is calculated by averaging the precision of all the image results that cause the ALS. The ground truth positions of the text in the image dataset are obtained according to the related text file attached along with the dataset. It was determined directly through the x-y-coordinate, together with the value of width and height for the boundary box given by the ground truth text files. The overall precision and recall is obtained by averaging all the precision and recall value on every image in the dataset.
According to Table 5, ATLAS achieved actual localizing strength of 0.63. This value is the highest among the observed algorithms. Compare to the second highest result, ATLAS had an increment value of 0.02 or 3.282%. Similarly, the average precision of ATLAS is 0.68, which is also the highest among the observed algorithms. ATLAS has average precision improvement of 0.01, or 1.49% relatively. The higher result of localizing strength of ATLAS was mainly due to the achievement of high precision rate on the majorities of high TBSI images, which contribute large amount of cumulated strength differences between ATLAS and other published algorithms. A decrease in localizing strength of ATLAS was observed between the self-generated and ICDAR 2011 dataset. This can be attributed to the degree of noise in the ICDAR 2011 dataset.
5. Conclusion
In this paper, a measurement of similarity index between text and background pixels in an image is introduced. An enhanced text localization algorithm, ATLAS, is proposed. ATLAS localizes texts that have high color similarity with its background. The paper presents a technique that apply adaptive threshold with multi-scale on possible text regions with Canny edge detector by evaluating the text-background similarity index on the particular region to improve the localizing strength of the algorithm. Two experiments (self-generated and public dataset) were conducted to evaluate the ideal localizing strength, and actual localizing of the proposed algorithm. The experimental results show that ATLAS performed relatively higher than other observed algorithms. There are several possible enhancements for ATLAS as well as the algorithm of TBSI. Future works can consider the replacement of TBSI algorithm with lighter weight algorithm such as the OTSU algorithm. ATLAS algorithm can be improved through extra footage, which can reduce the rate of false localization.
Acknowledgements
This research was supported by the FRGS (Fundanmental Research Grant Scheme) MOE, RMC (Research Management Center) of Universiti Teknologi Malaysia, Vot:R.J130000.7828.4F252
References
[1] Chitrakala S, Shamini P, Manjula D. Multi-class Enhanced Image Mining of Heterogeneous Textual Images Using Multiple Image Features. IEEE International Advance Computing Conference. 2009: 496-501.
[2] Weiming H, Nianhua X, Li L, Xianglin Z, Maybank S. A Survey on Visual Content-Based Video Indexing and Retrieval. IEEE Transactions on Systems, Man, and Cybernetics, Part C: Applications and Reviews. 2011; 41(6): 797-819.
[3] Dharani T, Aroquiaraj IL. A survey on content based image retrieval. International Conference on Pattern Recognition, Informatics and Mobile Engineering (PRIME). 2013: 485-490.
[4] Wactlar HD, Christel MG, Yihong G, Hauptmann AG. Lessons learned from building a terabyte digital video library. Computer. 1999; 32(2): 66-73.
[5] Keechul J, Kwang IK, Anil KJ. Text information extraction in images and video: a survey. Pattern Recognition. 2004; 37(5): 977-997.
[6] Honggang Z, Kaili Z, Yi-Zhe S, Jun G. Text extraction from natural scene image: A survey.
Neurocomputing. 2013; 122: 310-323.
[8] Sushma J, Padmaja M. Text detection in color images. International Conference on Intelligent Agent & Multi-Agent Systems. 2009: 1-6.
[9] Jie L, Shuwu Z, Heping L, Wuyi Y. A novel method for flash character localization. International Conference on Audio Language and Image Processing (ICALIP). 2010: 811-814.
[10] Emmanouilidis C, Batsalas C, Papamarkos N. Development and Evaluation of Text Localization Techniques Based on Structural Texture Features and Neural Classifiers. 10th International Conference on Document Analysis and Recognition. 2009: 1270-1274.
[11] Angadi SA, Kodabagi MM. Text region extraction from low resolution natural scene images using texture features. IEEE 2nd International Advance Computing Conference (IACC). 2010: 121-128. [12] Li Z, Liu G, Qian X, Guo D, Jiang H. Effective and efficient video text extraction using key text points.
IET Image Processing. 2011; 5(8): 671-683.
[13] Shivananda N, Nagabhushan P. Separation of Foreground Text from Complex Background in Color Document Images. Seventh International Conference on Advances in Pattern Recognition. 2009: 306-309.
[14] Lelore T, Bouchara F. Super-Resolved Binarization of Text Based on the FAIR Algorithm. International Conference on Document Analysis and Recognition (ICDAR). 2011: 839-843.
[15] Kittler J. On the accuracy of the Sobel edge detector. Image and Vision Computing. 1983; 1(1): 37-42. [16] Roberts LG. Machine perception of three dimensional solids. In: JT Tippet. Editors. Optical and
Electro-optical Information Processing. MIT Press; 1965: 159-197.
[17] Marr D, Hildreth E. Theory of Edge Detection. Proc. R. Boc. Lond. 8. 1980; 207: 187-217.
[18] Zhang X, Liu S. Image Edge Feature Extraction and Refining Based on Genetic-Ant Colony Algorithm.
TELKOMNIKA Telecommunication Computing Electronics and Control. 2015; 13(1): 118-127.
[19] Canny J. A Computational Approach to Edge Detection. IEEE Transactions on Pattern Analysis and Machine Intelligence. 1986; 8(6): 679-698.
[20] Shubham S, Bhavesh K, Shraey B. Comparative Study of Image Edge Detection Algorithms.
Computing Science and Engineering. Institute of Technology, India. 2010.
[21] Beeran KS, Saaidin S, Megat-Yunus PNA, Abu HS. Evaluation of canny and sobel operator for logo edge detection. International Symposium on Technology Management and Emerging Technologies (ISTMET). 2014: 153-156.
[22] Shrivakshan GT, Chandrasekar C. A Comparison of various Edge Detection Techniques used in Image Processing. International Journal of Computer Science Issues. 2012; 9.
[23] Xiaoqian L, Weiqiang W. Robustly Extracting Captions in Videos Based on Stroke-Like Edges and Spatio-Temporal Analysis. IEEE Transactions on Multimedia. 2012; 14(2): 482-489.
[24] Chucai Y, YingLi T. Localizing Text in Scene Images by Boundary Clustering, Stroke Segmentation, and String Fragment Classification. IEEE Transactions on Image Processing. 2012; 21(9): 4256-4268. [25] Seong Hun L, Jin Hyung K. Integrating multiple character proposals for robust scene text extraction.
Image and Vision Computing. 2013; 31(11): 823-840.
[26] Bing W, Shaosheng F. An Improved Canny Edge Detection Algorithm. Second International Workshop on Computer Science and Engineering. 2009; 1: 497-500.
[27] Zhengzhou L, Mei L, Huigai W, Yang Y, Jin C, Gang J. Gray-scale Edge Detection and Image Segmentation Algorithm Based on Mean. TELKOMNIKA Indonesian Journal of Electrical Engineering. 2013; 11(3): 1414-1421.
[28] Jansi S, Subashini P. Optimized Adaptive Thresholding based Edge Detection Method for MRI Brain Images. International Journal of Computer Applications. 2012; 51(20): 1-8.
[29] Liu H, Jezek KC. Automated extraction of coastline from satellite imagery by integrating Canny edge detection and locally adaptive thresholding methods. International Journal of Remote Sensing. 2004; 25(5): 937-958.
[30] Shih-Chang H, Cheng-Nan H. A High-Performance Videotext Detection Algorithm. Eighth International Conference on Intelligent Information Hiding and Multimedia Signal Processing (IIH-MSP). 2012: 242-245.
[31] Nobuyuki O. A Threshold Selection Method from Gray-Level Histograms. IEEE Transactions on Systems, Man and Cybernetics. 1979; 9(1): 62-66.


![Figure 11. Precision of Similarity Index Function for [23], [24], [25] and Proposed Algorithm](https://thumb-ap.123doks.com/thumbv2/123dok/239417.502628/11.595.158.436.668.740/figure-precision-similarity-index-function-proposed-algorithm.webp)
