At what age group blood pressure discontinue to increase? An assessment using
change-point analysis
Khalib A. Latiff,1 Khairul H. Yusof,1 Fera Yanuar2
1 Department of Community Health, Faculty of Medicine, Universiti Kebangsaan Malaysia 1 Department of Community Health, Faculty of Medicine, Universiti Kebangsaan Malaysia 2 Department of Mathematic, Faculty of Science and Technology, Universiti Kebangsaan Malaysia
Abstrak
Tujuan Untuk menentukan pada golongan umur berapa tekanan darah berhenti meningkat di antara perempuan dan laki-laki.
Metode Analisis pada naskah ini ialah teknik titik perubahan pada data penelitian kesehatan potong lintang di Hulu Langat (Malaysia) pada tahun 2000 untuk merencanakan pada umur berapa perlu dilakukan strategi upaya promotif, pencegahan, dan pengendalian hipertensi.
Hasil Tekanan darah sistolik (TDS) meningkat di antara perempuan dan laki-laki mulai umur dini sampai umur pertengahan. Perempuan lebih cepat mencapai puncak peningkatan lebih awal, yaitu pada umur 41-45 tahun. Sedangkan laki-laki pada umur 56-60 tahun. Selanjutnya peningkatan TDS akan menurun.
Kesimpulan Upaya pencegahan terhadap kenaikan TDS untuk perempuan perlu dilakukan sebelum umur 40 tahun, Sedangkan terhadap laki-laki sebelum berumur 55 tahun. Setelah umur tersebut pengobatan antihipertensi secara eksklusif yang perlu dilakukan. (Med J Indones 2010; 19:136-41)
Abstract
Aim To study at what age group blood pressure ceases to increase for women and men
Methods Applying change-point technique, we used our existing database - mega base-line cross-sectional Hulu Langat Health Study that was initiated in 2000 - to locate the most appropriate age limit in planning promotive, preventive and controlling strategies against systolic hypertension.
Results Systolic hypertension was found to be constantly increasing for both gender right from the early age until the middle age group. However, women achieved the systolic peak 15 years earlier (at 41-45 years old) than men (at 56-60 years old). Systolic blood pressure was steadily declined after the peak.
Conclusions Hypertension intervention, we recommend age before 40 (women) and 55 (men) be the most appropriate period to apply various public health intervention, after that, the action must be exclusively curative. (Med J Indones 2010; 19:136-41)
Key words:change-point analysis, public health intervention, systolic hypertension
Correspondence email to: [email protected]
Hypertension continues to be the most common and the most important risk factor for almost all cardiovascular diseases worldwide.1 Despite improvements in its pharmacotherapeutic strategies, the trend is still on the rise-increasing with age both at individual and community level. The condition is more alarming when others co-factor such as obesity, lack of exercise, hyperglycaemia, hypercholesterolemia and stressful lifestyle are also present.2-6
It poses a great challenge to all managers including clinicians - managing of hypertension is actually not an
easy task. More efforts need to be done to ind out the
most practical and most effective intervention to slow down the occurrence of hypertension and its related implications, both at clinical and in community setting.
Screening and health promotion are well known to be a major tool in public health intervention.7,8 It is useful in early detection and immediate control using either diet therapy, physical activity or stress management. Several sentinel studies have shown that this problem can be minimized.9-11 The issues are, (1) why this state-of-the art strategies are not convincing enough to control the hypertension trend? (2) What’s wrong with the methods used? (3) And what barriers are blocking the blood pressure reduction?
With this in mind, we make a hypothesis that the current strategies are not well positioned concurrently to the biological process occurred in the target community including gender deference. We belief the blood
and immediately declined or discontinue to increase naturally after this age.
Using the best mathematical tool which is capable to detect the real change, this study will try to locate the best cut-off point (age) where blood pressure start to deteriorate. By locating the most crucial and critical age point, we hope all community-based intervention and controlling strategies be well guided following this
inding. The paper aimed to study at what age group
blood pressure ceases to increase for women and men
METHODS
We reviewed our base-line cross-sectional Hulu Langat Health Study (Malaysia) that was initiated in 2000. We evaluated the systolic blood pressure, assuming that the similar picture could also be shown by its diastolic component. All respondents were categorized into 11 aged-groups that were 21-25, 26-30, 31-35, 36-40, 41-45, 46-50, 51-55, 56-60, 61-65, 66-70 and 71-75 respectively. Its aged-group systolic blood pressure mean was then computed and grafted in time series. Two sets of graph were used. First set, involving all associated independent variables and the other one
were those with speciic variable. In this analysis, only
two variables were used namely gender and ethnicity. Of the sorted, tabulated and grafted data, we proceeded with detail examination using change-point analysis to identify the exact aged-group where systolic hypertension was most pronounced and critical.12 The reason why we used change-point analysis was that it was more powerful and more precise in detecting change in a large data set. In this study, systolic hypertension was systolic blood pressure 140 mmHg or more. In our analysis, the highest y value (systolic hypertension)
would be identiied. The mathematical model used in
this analysis was;
Yi = ß0 + ß1Ii (θ) + ei (Model 1)
Here, Yi was the value of the most crucial systolic pressure for aged-group. In this analysis, i = 1 (age-group 21-25), i = 2 (age-group 26-30) until i = 11 (aged-group 71-75). Respondents < 21 years old and >75 were excluded in the analysis as they were an extreme groups. We assumed the crucial point didn’t occur at this range. Parameter ß0 denoted crossing point on the
Y axis, whereas, coeficient ß1 denoted coeficient at
variable parameter, and ei mean an error.
To locate the change point, a new model needed to be constructed based on each i observation. Here Ii (θ)
As mention earlier, variable θ was actually a representative of Ii with i = 1,2,...11; and it did not has the value yet.
To illustrate this, at i = 3 variable Ii (θ) should be assumed to be 0, and at i = 1, 2 or 1 for i = 3,4,...11. This model should be separately applied for each category in a set of variable. There were few variables to be assumed to be associated with systolic pressure, namely gender, ethnicity, smoking habit, exercise, stress level and medication.
Model 1 was applied separately (by gender) for each variables. R2 was then computed. Those aged-group with the highest R2 should be denoted a change point. In this analysis R2 was the cumulative sums of differences between the values and the average. Comparison was also made at F value from ANOVA table of SPSS version 14.0 for hypothesis testing.
In order to have a representative value, a representative parameter was selected from all variables. The following regression model was used;
Yi = βk +βkXk + β1Ii (θ) (Model 3)
Here Yi denoted the systolic value for age-group i, . In this model, for each age-group, a new variable should be created for each 11 free variable and it was denoted as Ii (θ).
Parameter β0 denoted crossing point on Y axis, whereas
βk was a coeficient to new variable k, k = 1,2,…,11. β1,2
was a coeficient to age-group variable.
RESULTS
Prevalence of systolic hypertension
Of 8,159 respondents examined, about 1,940 (23.7%) were suffering systolic hypertension. By gender, the prevalence were slightly higher among men (24.3%) compared to women, which was 23.5%. According to ethnicity, Malay had higher percentage at 25.0%, followed by Chinese (20.2%), Indian (15.9%) and others (16.0%).
Age group (year) Prevalence (%) 21 - 30
30 – 39 40 – 49 50 – 59 60 – 69 70 - 75
5.8 9.9 23.8 37.5 55.0 60.7
Overall 23.7
Regardless of gender and ethnicity, prevalence of systolic hypertension was found to be increasing with age; notably among those who were 40 years old and above (see Table 1). This table however, did not show the most critical point where the preventive and controlling strategies could be stressed up and positioned.
R2 Value of systolic hypertension according to gender
Considering this requirement, we made further analysis and measuring R2 using change point analysis model. We separately tabulated its respective systolic hypertension according to gender and all 11 age-group categories.
Table 1. Prevalence of systolic hypertension of all respondents according to age-group (n=8159)
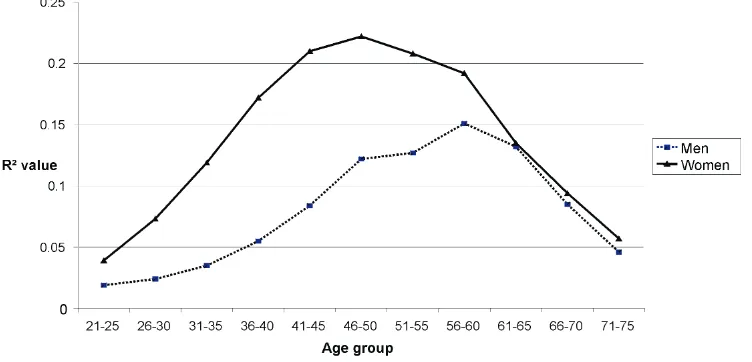
As can be seen in Table 2, the R2 value was completely differed for both groups. For men, the highest R2 value (0.151) was corresponded to 56-60 years, whereas for women, the highest value (0.222) was among 46-50 aged-group. This analysis revealed that the critical age for systolic hypertension were much more earlier among women compared to men. This indicated that the peak of hypertension was much faster among women compared to men.
We then plotted a time series graph, tried to understand this different. As can be seen in Figure 1, the R2 value of systolic hypertension was aggressively increased among women compared to men, from the very early age reaching the peak much more earlier at 46-50 years old. However, it was not so among men, where its increment was much steady and then settling around 56-60 years old. At age of 60 years old and over, the R2 value were similar and constantly decreased for both sex.
Table 2. R2 Value of systolic hypertension by gender
Age group (year)
R2 Value
Men Women
21-25 0.019 0.039
26-30 0.024 0.073
31-35 0.035 0.119
36-40 0.055 0.172
41-45 0.084 0.210
46-50 0.122 0.222
51-55 0.127 0.208
56-60 0.151 0.192
61-65 0.132 0.135
66-70 0.085 0.094
71-75 0.046 0.057
R2 value of systolic hypertension according to ethnicity
As prevalence of systolic hypertension was different according to ethnicity, we proceeded to examine how
ethnicity could inluence the R2 value. Assuming there
was a similar trend occurred for both sex and ethnicity, we just focused our analysis among men only.
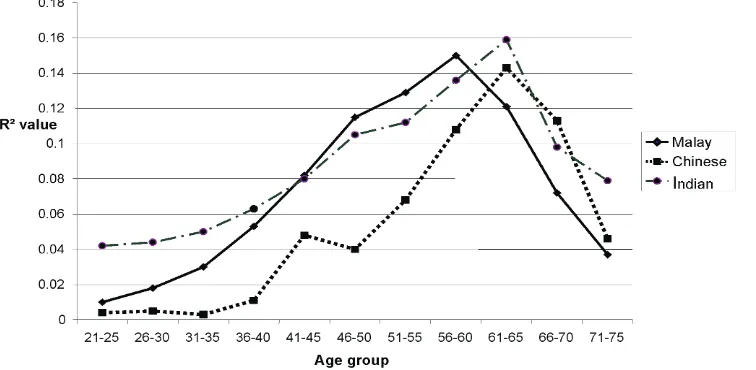
As shown by the highest R2 value, its corresponding peak of systolic hypertension was quite similar for each ethnicity – at around 60 years old (see Table 3). However, it was relatively earlier among Malay (at age group 56-60) as compared to Chinese and India (both at age of 61-65 years old).
Although ethnic Malay was relatively more prevalence compared to other ethnicity, Figure 2 revealed that
systolic hypertension was much earlier among ethnic Indian (age 21-25). However, Malay still took the lead as its peak systolic hypertension was manifested very much ahead of the other ethnicity.
R2Value of systolic hypertension according to its modiiable determinants
As the above results just showing the R2 value using
the ixed variables- age, gender and ethnicity regardless
of the lifestyle of the respondent, we like to know its
relationship with this various modiiable determinants. Among modiiable factors examined were smoking
habit (for men only), physical activity, eating habit, medication practice, and coping with stress. Those who were negative from this potential variables would be excluded from the analysis.
Age group (year)
R2 Value
Malay Chinese Indian
21-25 0.011 0.004 0.042
26-30 0.018 0.005 0.044
31-35 0.03 0.003 0.05
36-40 0.053 0.011 0.063
41-45 0.082 0.048 0.08
46-50 0.115 0.04 0.105
51-55 0.129 0.068 0.112
56-60 0.150 0.108 0.136
61-65 0.121 0.143 0.159
66-70 0.072 0.113 0.098
71-75 0.037 0.046 0.079
Table 3. R2 Value of systolic hypertension among male by
ethnicity
Age group (year)
R2 Value
Men Women
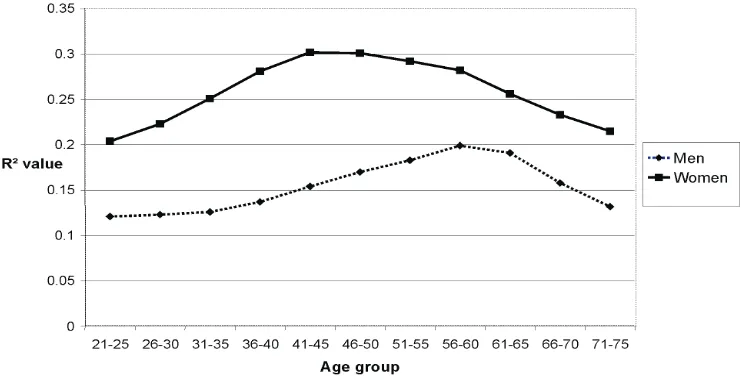
21-25 0.121 0.204
26-30 0.123 0.223
31-35 0.126 0.251
36-40 0.137 0.281
41-45 0.154 0.302
46-50 0.170 0.301
51-55 0.183 0.292
56-60 0.199 0.282
61-65 0.191 0.256
66-70 0.158 0.233
71-75 0.132 0.215
Table 4. R2 value for systolic hypertension with all determinants positive
The highest value of R2 for men was 0.199 at the group of 56-60 years old. Meanwhile for women, the highest value of R2 was 0.302 at the group of 41-45. This
inding was similar with the result shown in Table 2.
We also plotted a time series graph, tried to look closely this different. As can be seen in Figure 3, the R2 value of
systolic hypertension was constantly dominant among women compared to men right from the very early age, reaching the peak much more earlier at 41-45 years old. However, it was not so among men, where its increment was much slower and only reaching its plateau around 56-60 years old.
Figure 3. The trend of systolic hypertension with all determinants positive by gender using R2 value
DISCUSSION
This study has clearly noted that the prevalence of systolic hypertension varied according to gender and ethnicity - where men are slightly more prevalence compared to women at 24.3% and 23.5% respectively, and Malays (25.0%) are slightly more prevalence compared to Non-Malays ethnics (Chinese - 20.2%, Indian - 15.9% and Others - 16.0% ).
When using change point analysis, after considering all
its modiiable factors (smoking habit, physical activity,
eating habit, medication practice, and coping with stress), the systolic blood pressure was constantly increased with age and immediately declined after reaching its peak around the middle age. Peak age of women occured much more earlier than men at 41-45 years old (or 15 years) and at 56-60 years old respectively.
This inding was a composite effect of all factors
involved in blood pressure management – patient-related, physician-related and its environment.13 The existing biological process such as ageing and others
non-modiiable determinants were examples of factor
that are always linking to this increment.14 Not to forget that factors related to lifestyle, taboos, existing anti-hypertensive medications and remedies, compliance to medication and professional advices are some of other factors that also associated to this problem.15-17
From public health perspective, age-group of 41-45
(women) and 56-60 (men) should be identiied as a
very crucial age point if a future preventive intervention strategies are to be planned to address this issue. Unfortunately, not many studies focusing on this area. Most literatures are only making recommendation that all lifestyle approaches must be instituted at early age ages.18
The issue is beside lifestyle intervention and intervention carried out at clinic setting, especially dealing with younger hypertensive patient who might required a
curative remedy, what speciic public health strategies
As public health intervention is a community-based approaches, all activities must be ideally dominated by promotive efforts only. Activity towards advocating healthy eating, physical activity, and stress coping are still relevant but how this recommendation can be aggressively promoted before this point.19,20 In addition, regular blood pressure monitoring must be treated as an integrated and global standardized practice to all before they reach its critical age point using whatever technologies available in the market.21,22
For purpose of intervention, we recommended age of 40 (women) and 55 (men) be the cut-off point (dateline), when implementing various public health intervention to address hypertension in the community. Meaning all preventive strategies (including some controlling strategies) should be commenced earlier and stop at this point. Beyond this age, all activities should be oriented towards hypertension control (not preventive).
In conclusion, systolic blood pressure continues to increase with age regardless of its risk factors and the interventions. It reaches its peak at age of 41-45 (women) and 56-60 (men) and then, immediately declined naturally. All public health intervention against hypertension especially preventive strategies must be aggressively focused before age of 40 (women) and age of 55 (men).
REFERENCES
1. World Health Organization. Cardiovascular Diseases.
Health Fact No 317. Sept. 2009.
2. Schlaich, Markus P, Grassi, Guido. Obesity-induced
hypertension and target organ damage: current knowledge and future directions. J Hyperten. 2009;27: 207-11.
3. Good H, Morse SA, Ventura HO, Reisin E. Obesity,
hypertension and the heart. J. Cardiometab Syndr. 2008;3:168-72.
4. Tropeano AI, Boutouyrie P Katsahian S, Laloux B,
Laurent S. Glucose level is a major determinant of carotid intima-media thickness in patients with hypertension and hyperglycemia. J Hyperten.. 2004;22:2153-60.
5. Lepira FB, M’Buyamba-Kabangu JR, Kayembe KP,
Nseka MN. Correlates of serum lipids and lipoproteins in Congolese patients with arterial hypertension. Cardiovasc JS Afr. 2005;16:249-55.
6. Gasperin D, Netuveli G, Dias-da-Costa JS, Pattussi MP. Effect of psychological stress on blood pressure increase:
a meta-analysis of cohort studies. Cad Saude Publica. 2009’25:715-26.
7. Kriekard P, Gharacholou S, Peterson E. Primary and
Secondary Prevention of Cardiovascular Disease in Older Adults: A Status Report, Clinics in Geriatric Medicine. 2009;25:745-55.
8. Pazoki R, Nabipour I, Seyednzami N, Imami SR. Effects of a community-based healthy heart program on increasing healthy women’s physical activity: a randomized controlled trial guided by Community-based Participatory Research (CBPR). BMC Public Health. 2007:23;216-24.
9. Appel LJ, Brands MW, Daniels SR, Karanja N, Elmer
PJ, Sacks FM.Dietary approaches to prevent and treat
hypertension: a scientiic statement from the American
Heart Association. Hypertension. 2006;47:296-308. 10. Hagberg JM, Park J, Brown MD. The role of exercise
training in the treatment of hypertension: an update. Sports medicine. 2000;30:193-206.
11. Schwickert M, Langhorst J, Paul A, Michalsen A, Dobos GJ. Stress management in the treatment of essential arterial hypertension. MMW Fortschr Med. 2006;23;148:47. 12. Tylor WA. Change point analysis: a powerful new tool for
detecting changes. Round Lake (IL). Baxter Healthcare Corporation. 2000.
13. Ogedegbe G, Barriers to optimal hypertension control. J Clin Hypertens (Greenwich). 2008;10:644-6.
14. Gupta R, Misra A, Vikram NK, Kondal D, Gupta SS, Agrawal A, Pandey RM. Younger age of escalation of cardiovascular risk factors in Asian Indian subjects. BMC Cardiovac Disord. 2009;5:28-40.
15. Latiff KA, Yusof KH. Lifestyle dominates cardiovascular risks in Malaysia. Med. J Indones. 2008;17:50-6.
16. Hyman DJ, Paylik VN. Poor hypertension control: let’s stop blaming the patients. Cleve Clin J Med. 2002;69:793-9. 17. Siegel D. Barriers to and strategies for effective blood
pressure control. Vasc Health Risk Manag. 2005;1:9-14. 18. Daviglus ML, Lloyd-Jones DM, Pirzada A. Preventing
cardiovascular disease in the 21st century: therapeutic and preventive implications of current evidence. Am J Cardiovasc Drugs. 2006:6:87-101.
19. Buttar HS, Li T, Ravi N. Prevention of cardiovascular diseases: Role of exercise, dietary interventions, obesity and smoking cessation. Exp Clin Cardiol. 2005;10:229-49. 20. Sobieszczanska M, Kalka D, Pilecki W, Adamus J. . Physical
activity in basic and primary prevention of cardiovascular disease. Pol Merkur Lekarski. 2009;156:59-64.
21. Lee DE, Cooper RS. Recommendations for global hypertension monitoring and prevention. Curr Hyper Repor. 2009;11:444-9.