THE AIR FLOW ANALYSIS OF COFFEE PLANTATION
BASED ON CROPS PLANTING PATTERN OF THE
TRIANGULAR GRID AND SHACKLE OF WHEEL
GRAPHS BY USING A FINITE VOLUME METHOD
Muhammad Nurrohim
1, Dafik
2, Arif Fatahillah
3,
Moch. Avel Romanza P.
4, Susanto
5Mathematics Education Department
FKIP University of Jember
([email protected], d.dafik, fatahillah767, moch.avel.93, [email protected])
ABSTRACT
Coffee bean is one of the Indonesia major export commodity. Based on the data from the 2012, Indonesia was ranked at third biggest coffee beans exporter in the world, after Vietnam and Brazil. A coffee land expansion have been done to increase the productivity of coffee beans, however it is not so effective. One of the factors that affect the productivity is a crops planting pattern. A good crops planting pattern will make a good air circulation and it will finally affect to the productivity of coffee beans. We will use a finite volume method to analyze the air flow of coffee plantation based on the soil roughness level, crops planting pattern of the triangular grid and shackle of wheel graphs. The simulation process is carried out by using MATLAB and FLUENT softwares. The result shows that the crops planting pattern of triangular grid and shackle of wheel graphs gives a better air circulation process in the coffee bean plantation.
Key Words: Coffee Plants, Air Flow, Soil Roughness Level, Triangular grid graph, Finite Volume
Method.
INTRODUCTION
Coffee is one of the second largest export product of Indonesia Country (Institute of Education, Training and Agricultural Extension; 1984). During 20 years the total area and production of coffee plantations in Indonesia have risen a significant improved. However, as an productivity of coffee beans.
In this research will be constructed a mathematical model of differential equations of the air circulation on the coffee plantation based on the soil of roughness level and cropping pattern of the triangular grid and shackle of wheel graphs of two dimensions shapes. The governing equation for this model are the momentum equation and the energy the viscosity of air fluid, ij is displacement force, u and v are respectively the average velocity direction of X axis and Y axis, u' and v' are respectively turbulent flow direction of X axis and Y axis.
Mathematics model for air circulation of coffee plantation is affected by profile of vertical’s air velocity (Kindangen, 2005):
is the average air velocity at the height benchmark, x is the distance between plants, xr is the
RESEARCH METHODS
The study is started by collecting some relevant literatures and references to the coffee plant, fluid, turbulent flow and finite volume method. It will be designed a model of air circulation on the coffee plantation based on the level of the soil of roughness and cropping pattern of the triangular grid and shackle of wheel graphs. Furthermore, the researcher will discretize the model by using finite volume method of Quick technique.
The simulation of air circulation will be carried out by MATLAB and FLUENT softwares to analyze the relation between the level of the soil of roughness and air circulation on coffee plantation. Finally we test and evaluate the programme simulation to know weather the programming is doing well or not in obtaining the air circulation of coffee plantation based on the level of the soil roughness.
(a)
(b)
Figure 1. (a) Triangular Grid Graph Cropping Pattern, (b) Shackle of Wheel Graph Cropping
Pattern
RESULTS AND DISCUSSION
The simulation is done by comparing the soil roughness level and the air circulation of the coffee plantation. The soil of roughness level are 0,1; 0,5; and 0,9. The initial velocity of air circulation is 1,2 m/s. The number of trees at cropping pattern of a triangular grid and shackle of wheel graphs of the direction of X axis (px) and the direction of Y axis
(py) is 10. By substituting the level in the soil of
roughness we get Figure 2.
(a)
(b)
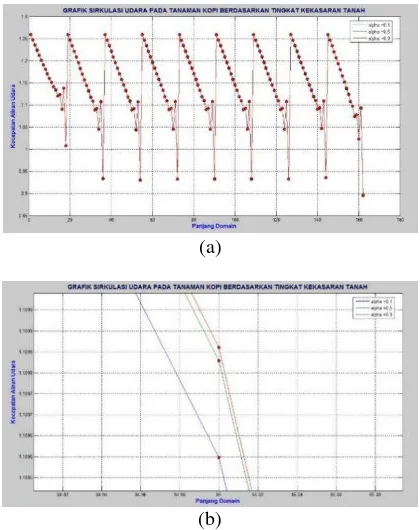
Figure 2. The air circulation on coffee plantation with different level of soil roughness by MATLAB
occurs at the point of 19th to 36th, point 37th to 54th, and so on.
Figure 2(a) shows three different simulation figure showing the air circulation with three level of soil roughness values, namely 0,1; 0,5; and 0,9. By enlarging the figure we get Figure 2(b). At the point 85th, the air velocity of the soil roughness level of (respectively 0,1; 0,5; 0,9) is respectively 1,1096 m/s; 1,10983 m/s; 1,10986 m/s. Figure 2 shows that the higher the soil roughness, the faster velocity of air circulation of coffee plantation.
The FLUENT simulations shows the air circulation of coffee plantation on each level of soil roughness. The simulations is done twice yielding two different figures. The first simulation was conducted to determine air circulation coffee plantation based on cropping pattern namely triangular grid and shackle of wheel graphs.
Figure 3. The air circulation on coffee plantation based on cropping patterns of triangular grid graph
Figure 4. The air circulation on coffee plantation based on cropping patterns of shackle of wheel
graph
The first simulation uses an initial air velocity of 1 m/s. The simulation results is shown in Figure 3. It tell us that the air circulation in the front row of coffee plantation give a high air velocity of between 3 m/s - 5 m/s. But getting into the middle of plantation the air circulation tends to be reduced and stable. The velocity of air circulation has a velocity range between 0,6 m/s until 2 m/s. This indicates that the air velocity in front side of the plantation area is higher than the other side. So we need a protection plants.
(a)
(b)
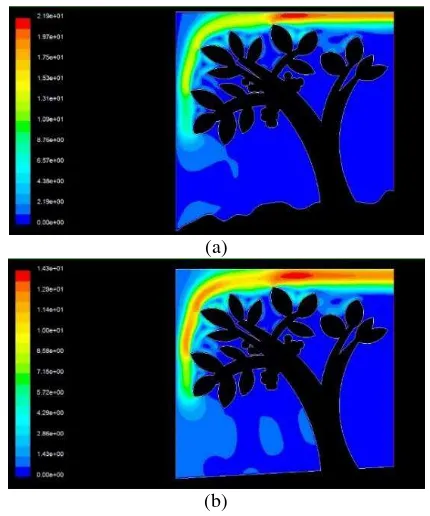
Figure 5. The air circulation on coffee plantation with the level of soil roughness
The second simulation was conducted to determine the effect of soil roughness on the air circulation in the coffee plantation. The initial velocity of air used is 1 m/s. The simulation results is shown in Figure 5. Figure 5(a) shows the velocity of air circulation coffee plantation with a large level of soil roughness of 0,9 is 2 m/s to 10 m/s, even reaches 20 m/s. It endangerous the coffee plantation as the higher the air circulation cause a bad pollination of coffee plantation. It also cause many coffee plants flowers are falling down. So the productivity of coffee bean will be low. Figure 5(b) shows the velocity of air circulation coffee plantation with a low level of soil roughness of 0,1 is 0,5 m/s to 10 m/s. The lower the air circulation give a good pollination of coffee plantation, then it will gain a good productivity of coffee beans.
The velocity average of air circulation of coffee plantation taken from coffee field is 1,27 m/s. while the average of air velocity of simulation results on the first rows is 1,25927 m/s. It shown that the simulation is relatively accurate. The error and relative error values is respectively 0,01073 and 0,85%.
CONCLUSIONS
soil roughness level should be high to have good air circulation. In this research we do not involve a protection tree. It will be more challenging if it is also considered a protection tree with a different cropping patterns for further research. Apart from this, the other researcher can study the effect of the humidity and soil of slope to the air circulation of coffee plantation.
REFERENCES
Badan Pendidikan, Latihan dan Penyuluhan Pertanian. 1984. Kopi. Jakarta: Badan Pendidikan, Latihan dan Penyuluhan Pertanian.
Kindangen. 2005. Investigasi Pola Aliran Udara Dalam Bangunan Bertingkat Akibat Pengaruh Penghalang di Depan dan di Belakangnya. Manado.
Muhidong, J., Mursalim, & Rahman, A. 2013. The effect of air flow rate on single-layer drying characteristics of Arabica coffee, International Food Research Journal, October 2013, Vol. 20 Issue 4, p1633.
Najiyati, S. dan Danarti. 2001. Kopi, Budi Daya dan Penanganan Lepas Panen. Cetakan XI. Jakarta: Penebar Swadaya.
Nilnont, W. dkk. 2012. Finite element simulation for coffee (Coffea arabica) drying 269,, Food & Bioproducts Processing: Transactions of the Institution o, April 2012, Vol. 90 Issue 2, p341.
Streeter, V. L. & Wylic, E. B. 1985. Mekanika Fluida. (Edisi Delapan Jilid 1). Alih Bahasa oleh Arko Prijono. 1986. Jakarta: Erlangga.
Versteg, H. K. & Malalasekera, W. 1995. An Introduction to Computational Fluid Dynamics : The Finite Volume Method. Loughborough: Longman Scientific & Technical.