Performance Analysis of High Voltage Insulators
Surface Condition Using Time-frequency
Distribution
A. Sulaiman, A. R. Abdullah, A. Aman, N.Norddin and N. Q. Zainal Abidin Faculty of Electrical Engineering
Universiti Teknikal Malaysia Melaka (UTeM) Malacca, Malaysia
Abstract- This paper presents the leakage current of polymeric and non–polymeric insulation materials in contaminated condition. High Density Polyethylene (HDPE) and Polypropylene (PP) are selected as polymeric materials. Meanwhile, glass is selected as non-polymeric material. The purpose of this study is to identify performance of insulator surface condition against its tracking and erosion and grouped according to the shapes of leakage current waveform. By using Incline Plane Tracking (IPT) test method for evaluating resistance to tracking and erosion is complying with BS EN 60587-2007. The result of leakage current waveforms were captured and recorded in continuous duration time. From that result, monitoring signal output will analyze using Time-Frequency Distribution (TFD). Spectrogram is used as a diagnostic tool to analysis time-frequency representation (TFR). Although, the harmonic components for polymeric and non-polymeric material can be define by Spectrogram. TFR result also will estimate to identify the signal characteristic patterns of the materials.
Keywords- IPT test, leakage current; Spectrogram; harmonic
I. INTRODUCTION
Insulating material usage changes from ceramic to polymeric in interest choose insulating material. There have advantages and disadvantages between ceramic and polymer electrical insulation as clarified in[1]. After 30 years more polymeric material is applied in high voltage insulator industry, not one insulating material nowadays has perfection as insulator. There are many concerns and challenges due to this various modernistic outdoor insulation [2].
Most modern composite insulators are characterized by a more or less hydrophobic surface, which minimizes the leakage current[3]. A hydrophobic property in the surface of the insulator needs to avoid the incidence of contamination flashover in high voltage transmission system [1]. High Density Polyethylene (HDPE) and Polypropylene (PP) are representing as hydrophobic materials [4].
Hydrophobicity property can be determined with a few different techniques using characterization surfactant and chemical investigation. Ganiometer, classification STRI surface morphology by scanning electron microscope (SEM) used to establish loss of hydrophobic material surface. Apart from that, one of the indicator uses to determine performance insulation was leakage current signal (LC).
Usually most previous analysis usage fast Fourier transform (FFT) to analyze the leakage current signal[5].
However, it does not offer temporal information and is not suitable for non stationary signal. The analysis using time frequency representation (TFR) such as spectrogram can be used to identify the harmonic components for polymer and non-polymer materials.
Tracking and erosion test based on BS EN 60587-2007 standard are performed, then leakage current frequency components is used as a diagnostic tool for their surface condition monitoring and degradation severity. Spectrogram in time representation provides information on frequency component with respect to time, frequency, and magnitude.
II. MATERIALS
The major factors that resolve to the failure of the insulation are dielectric and electrical field which are the key properties of insulating materials [6]. High Density Polyethylene (HDPE) and Polypropylene (PP) are non-ceramic or polymeric composite refer to hydrophobic materials. These substances selected based on nature dielectric strength and dielectric constant that is nearly identical [7]. While, glass are hydrophilic insulator often represent as non-polymeric composite.
Fig. 1. Erosion effect occur on the high density polyethylene (HDPE) and polypropylene (PP) but not on glass surface materials after the IPT test
A. High Density Polyethylene (HDPE)
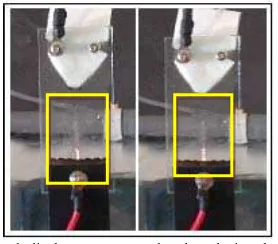
Fig.2. Spark discharge occur on the High Density Polyethylene material during the IPT test
B. Polypropylene (PP)
Polypropylene (PP) is one of versatile polymers [10] and does not absorb water. It is more hydrophobic which is incapable of dissolving in water. Also it can be considered the capability nearly identical with High Density Polyethylene (HDPE) [11].
Fig.3. Spark discharge occur on the Polypropylene during the IPT test
C. Glass
The glass surface is smoother and more hydrophilic which diverse from polymer. These properties of hydrophilic cause the fluid that flows over this surface would spread to most areas of the glass surface. Similarly, it occurs in the vicinity of the glass surfaces when liquid contamination on the surface of the glass discharges as shown in the Fig.4.
Fig.4. Spark discharge occur on the glass during the IPT test
III. EXPERIMENTAL WORK
Inclined-Plane Test (IPT) is normally used to evaluate the tracking and erosion resistance of insulating materials and recommended by BS EN 60587[12]. It is a valuable tool for the comparison and evaluation of new and different materials under electrical stress, and to compare the suitability of materials for the dielectric surface of an insulator. Three materials are being evaluated which are polymeric (high density polyethylene and polypropylene) and non-polymeric
(glass) having the dimensions of 50 mm wide by 120 mm long and 6 mm thick and inclined at 45° angle as shown in the schematic Fig. 3 which is the experimental setup for IPT test that are subjected to high voltage of 4.0 kV. In the test procedure, since it is done in the same place every day, there are three parameters that are assumed constant; humidity, pressure, and temperature. As stated in the standard, the contaminant conductivity level is set to 2.51 S/m and its flow rate at 0.6 ml/min. A non-ionic wetting agent (Triton X100) is added as prescribed in the standard test to provide uniform liquid for contamination. For standard procedure, this test is should be carried out for 6 hour for materials at constant voltage but for this purpose research its only takes for the different types data signal. LABVIEW program is developed for LC data monitoring and storage for analysis purpose.
Fig.5. Experiment setup for IPT Test
IV. LEAKAGE CURRENT ANALYSIS A. Analysis in Time-Frequency Representation
Spectrogram is one of the time-frequency representations (TFR) that represents a three-dimensional of the signal energy with respect to time and frequency. The analysis technique is motivated by the limitation of fast-Fourier transform (FFT) to cater non stationary signals whose spectral characteristics change in time. It is the result of calculating the frequency spectrum of windowed frames of the compound signal. Normally, the short-time Fourier transform (STFT) is computed at a finite set of discrete values of ω. In addition, due to the finite length of the windowed sequence, the STFT is precisely represented by its frequency sample as long as the number of frequency sample is larger than the window length. Spectrogram provides a distribution of the energy signal in a time-frequency plane and it can be defined as:
2 2 ) ( ) ( ) , ( x
S ∫
∞ ∞ −
− −
= x w t e j f dt f
t τ τ πτ (1)
Where x(τ) is the input signal and w(t) is the window
observation window. In this study, Hanning window is selected because of its lower peak side lope which is narrow effect on other frequencies around fundamental value (50 Hz in this study) and other frequency components. The highest power in spectrogram represented in red colour, while the lowest is represented by blue colour. Others leakage current parameters such Irms, I1rms, ITHD, ITnHD, and ITWD
V. RESULT AND DISCUSSIONS
Polypropylene and high density polyethylene is polymeric then glass is non-polymeric used in this study. The leakage current for each material was observed. The pattern from all material was represents in time frequency representation.
A. Non-polymeric (Glass)
Fig. 6(a) show the capacitive pattern for glass and fig. 6(b) show the spectrogram obtained. The waveform in sinusoidal but in very small level around µA. The capacitive state from different material shows the same pattern. Voltage observed for all materials at 60 V.
(a)
(b)
Fig.6. (a) Capacitive pattern for glass (b) Spectrogram for capacitive pattern
B. Polymeric (Polypropylene)
Fig. 7(a) show the resistive pattern for polypropylene and fig. 7(b) show the spectrogram obtained. At this state only sinusoidal signal of fundamental frequency, 50Hz exist. Voltage observed for all materials at 1.0 k V.
(a)
(b)
Fig. 7. (a) Resistive pattern for polypropylene (b) Spectrogram for resistive pattern
C. Polymeric (High Density Polyethylene)
It is observed that at 3.0 kV, heavy smoke, arching sound and minor spark occurred. At this level of voltage, the leakage current is classified to symmetrical discharge type as shown in Fig.8.
(a)
(b)
Fig.8. (a) Symmetrical pattern for High Density Polyethylene (b) Spectrogram for symmetrical pattern
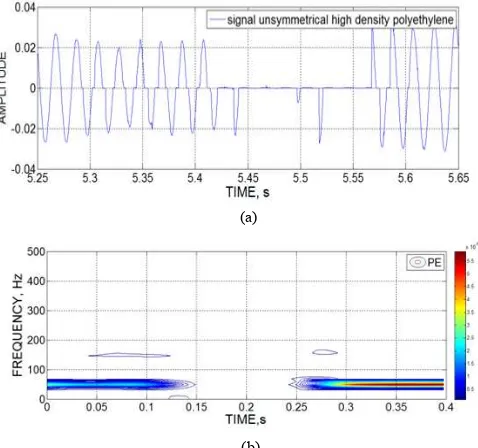
The higher voltages until 4 kV will increase the energy and generate heat from arcing event and subsequently form dry-band on the surface which then leads to fast tracking and erosion. At this level of voltage, the leakage current is classified to unsymmetrical discharge type. This phenomenon form discharge activities as shown in Fig.9. Heavy smoke, arching sound and spark is produced because of dry band region resulting from evaporation of conducting film. The effect of distorted non-linear symmetrical is associated with fundamental and non-fundamental frequency component.
(a)
(b)
VI. CONCLUSION
High Density Polyethylene (HDPE) and Polypropylene (PP) are selected as polymeric material. On the other hand, Glass is selected as non-polymeric material. The following conclusions can be drawn from the experimantal results on polymeric and non-polymeric materials in Fig. 10:
1) The capacitive pattern for polymeric and non-polymeric materials shows the same pattern. The waveform in sinusoidal but in very small level around µA. The voltage level for capacitive type is around started at range 45.5V - 46 V until below 1.0kV. Harmonic exist at 400-600Hz and Total wave distortion (TWD) started around 50% until 3% before change to resistive pattern. 2) All materials have nearly same result in the resistive
type condition. At this state only sinusoidal signal of fundamental frequency, 50Hz exist. Total wave distortion (TWD) occurred below 3%. On physically observed, smoke with weak arching sound occur from voltage 1.0kV to 2.5kV on polymer materials except for the glass (non-polymer) is only occur weak arching sound.
3) Were identified, all materials as well have equal condition symmetrical discharge. At voltage from 2.5 kV until 3.0 kV, harmonic exist at 3rd, 150Hz. Total wave distortion (TWD) varies from 1% to 100%. It is observed that at 3.0 kV, heavy smoke, arching sound and minor spark occurred except glass (non-polymer) material doesn’t have heavy smoke.
4) For unsymmetrical discharge condition, only polymeric materials have responded. Heavy smoke, strong arching sound and spark occur from voltage 3.5kV-4.0kV. Harmonic exist at 3rd, 150Hz and range for total wave distortion (TWD) is varies between 1% until 150%. Other general conclusions are:
1) From the result shows of high density polyethylene and polypropylene nearly same at finding test result. Irms,
I1rms, ITHD, ITnHD, and ITWD result also almost equal.
Based on physical condition, during high density polyethylene test smoke appeared more than polypropylene.
2) Due to hydrophilic property of glass. Does not have unsymmetrical signal pattern because of no erosion condition on surface of material glass. The surface is smoother and more which diverse from hydrophobic. These properties of hydrophilic cause the fluid that flows over this surface would spread to most areas of the glass surface. Physically by observation, arching sound and formation on glass surface less than polymeric materials. Formation of spark also smaller and thinner.
Pattern
Material
Capacitive Resistive Symmetrical
Unsymmet-rical Condition
Glass
Voltage range from
2.5kV-Fig.10 Data sheet of result
ACKNOWLEDGMENT
The authors gratefully acknowledge the Faculty of Electrical Engineering, Universiti Teknikal Malaysia Melaka and Universiti Teknikal Malaysia Melaka for the support for this study.
REFERENCES
[1] J. Mackevich and M. Shah, “Polymer outdoor insulating materials. Part I: Comparison of porcelain and polymer electrical insulation,” IEEE Electrical Insulation Magazine, vol. 13, no. 3, pp. 5–12, May 1997.
[2] S. M. Gubanski, “Modern Outdoor Insulation — Concerns,” IEEE Electrical Insulation Magazine, vol. 21, no. 6, pp. 5–11, 2005. [3] R. Hartings, “The AC-behavior of a hydrophilic and hydrophobic post
insulator during rain,” IEEE Transactions on Power Delivery, vol. 9, no. 3, pp. 1584–1592, Jul. 1994.
Properties and Applications of Dielectric Materials, 1994., Proceedings of the 4th International Conference on, vol. vol.1, no., pp. 1–4.
[5] A. Krivda and L. Schmidt, “Inclined-Plane Tracking and Erosion Test according to the IEC 60587 Standard,” … , 2008. CEIDP 2008. …, pp. 263–267.
[6] V. K. MS Naidu, HIGH VOLTAGE ENGINEERING 4E, 4th ed. Tata McGraw-Hill Education, 2009, 2009, p. 474 page.
[7] W. Tillar Shugg, Handbook of Electrical and Electronic Insulating Materials. 115 fifth avenue new york,10003: Jaico Publishing House, p. 598.
[8] M. A. Khan and R. Hackam, “Loss Of Hydrophobicity Of High Density Polyethylene - Electrical Insulation and Dielectric Phenomena, 1997. IEEE 1997 Anual Report. Conference on,” vol. vol.2, no. pp.378–381, pp. 5–8, 1997.
[9] C. Lynn, a. Neuber, J. Krile, J. Dickens, and M. Kristiansen, “Electrical conduction in select polymers under shock loading,” 2009 IEEE Pulsed Power Conference, pp. 171–174, Jun. 2009.
[10] Y. . Yoshino, K.; Ueda, A.; Demura, T.; Miyashita, Y.; Kurahashi, K.; Matsuda, “‘Property of syndiotactic polypropylene and its application to insulation of electric power cable -property, manufacturing and characteristics,’ Properties and Applications of Dielectric Materials, 2003. Proceedings of the 7th International Conference on,” vol. vol.1, no. c, pp. 175–178.
[11] Y. . Katsunami, K.; Ishii, K.; Tanaka, Y.; Ohki, “‘Dielectric properties of polymer blend of polypropylene and polyethylene,’ Properties and Applications of Dielectric Materials, 1991., Proceedings of the 3rd International Conference on,” Properties and Applications of Dielectric Materials, 1991., Proceedings of the 3rd International Conference on, vol. vol.2, pp. 999–1002.
[12] B. S. En, “Electrical insulating materials used under severe ambient conditions — Test methods for evaluating resistance to tracking and erosionerosion," ed: BS EN 60857:2007, 2007.,” vol. 3, 2007. [13] M. H. Abdullah, A.R.; Norddin, N.; Abidin, N.Q.Z.; Aman, A.; Jopri,