67:3 (2014) 37–42 | www.jurnalteknologi.utm.my | eISSN 2180–3722 |
Teknologi
Feature Analysis of Numerical Calculated Data from Sweep Frequency
Analysis (SFRA) Traces Using Self Organizing Maps
Z. H. Boharia*, S. Ab Ghania, M. F. Baharoma, M. N. M. Nasira,M. H. Jalia, Y. H. Md Thayoobb
aFaculty of Electrical Engineering, Universiti Teknikal Malaysia Melaka, Hang Tuah Jaya, 76100 Durian Tunggal, Melaka, Malaysia
bCollege of Graduate Studies, 4th Floor, Admin Building, Universiti Tenaga Nasional, Jalan IKRAM-UNITEN, 43000 Kajang, Selangor Darul Ehsan,
Malaysia
*Corresponding author: [email protected]
Article history
Received :23 October 2013 Received in revised form : 14 December 2013 Accepted :10 January 2014
Graphical abstract
Abstract
This paper presents a comprehensive investigation of the Self Organizing Map (SOM) classification process of good and defective power distribution transformers. Three main features were extracted from the numerical calculation method of the Sweep Frequency Response Analysis (SFRA) signals acquired from the transformers. These features are the input vectors for the SOM classification. Analysis of the results has shown the capability of the features and the SOM classification method to differentiate between good and defective transformers.
Keywords: Self Organizing Maps (SOM); power transformer; classification; SFRA
Abstrak
Dalam kertas penyelidikan ini pengkajian yang komprehensif tentang kemampuan Peta Penyusunan Kendiri (SOM) dalam mengklasifikasi alatubah kuasa pembahagian berada dalam baik atau bermasalah. Tiga ciri utama yang diekstraks dari kaedah pengiraan berangka melalui isyarat Analisis Tindak balas Frekuensi Sapuan (SFRA) yang diperolehi dari alat ubah. Ciri-ciri ini akan dijadikan sebagai vektor input untuk pengklasifikasi SOM. Hasil analisis menunjukkan yang ciri utama dan kaedah pengklasifikasi SOM mampu untuk membezakan antara alatubah yang baik dan yang bermasalah.
Kata kunci: Peta Penyusunan Kendiri (SOM); alat ubah kuasa; pengklasifikasi; SFRA
© 2014 Penerbit UTM Press. All rights reserved.
1.0 INTRODUCTION
SOM is one type of artificial neural networks (ANNs). This methodology introduce by Kohonen in 1989.1 Basically ANNs are
mathematical model that being designed based on human brains. ANNs contains group of interconnected neurons or nodes. ANN is widely used to find patterns or fingerprint between input and output data.2
Unsupervised learning (learning by observation) refer to the method that learns by itself according to input attributes and also apply competitive learning that made the output nodes to compete to be activated. Only one of the node will activated at any one time or we called winning neuron.2-3 The node competition can be
induced through negative feedbacks between neurons. The system is called Self Organizing Map (SOM) because all nodes are forced to be self organized through the feedback path.
Based on neurological studies, all human sensory inputs are mapped onto certain areas at the cerebral cortex that form a map called Topographic Map.2 It has two most important principals;
At each stage of processing, every each information is reserved in its proper environment.
Close related information nodes will be close to each other to ensure short synaptic connections.
SOM primary purpose is to transform incoming input patterns into a one or two dimensional discrete map. This process must be performing in orderly approach.
Figure 1 Test leads connection from the FRAnalyzer to a transformer5
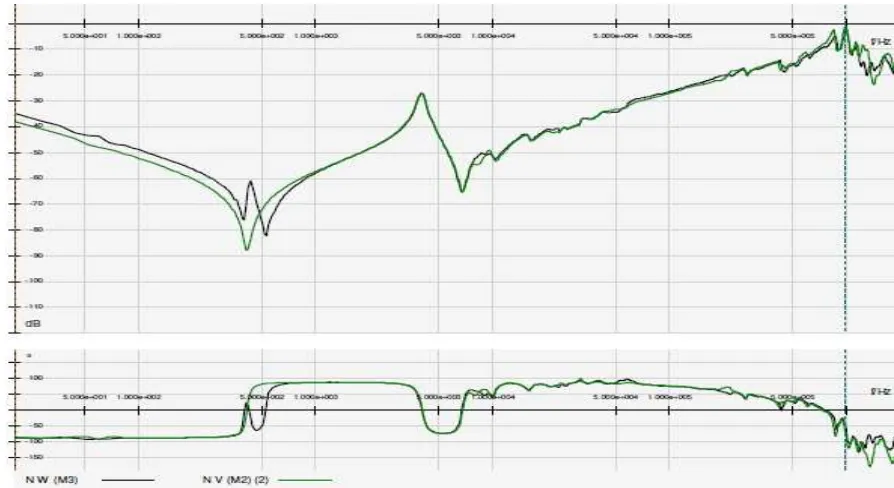
Figure 2 Graphical representation of SFRA results (y-axis: magnitude, x-axis: frequency in Hz)
2.0 THE TEST SETUP
The SFRA results utilized in the study were obtained from twelve 33/11kV transformers with ten transformers in good condition and two transformers were in defective condition. The SFRA measurement was conducted on HV winding. The whole experiment was setup at twelve different air insulated substation (AIS) and gas insulated substation (GIS). SFRA measurement has the ability to determine abnormality happen at transformer winding.8-9
There are four different types of SFRA measurement setup. These measurements can be defined as end to end open circuit,
end to end short circuit, capacitive and inductive interwinding measurement.4-5 The test configuration used in this test is the end
to end open circuit. Test leads connection between FRAnalyzer and transformer as depicted (Figure 1).
The measured data can be compared to other measurement results (history, pair, twin or phase data) to determine variations or differences.4 The most ideal method is to compare the
measured results with the health of same units (twin or pair transformer).4 In case of unavailability of same transformer, we
measurement will produce SFRA traces that are manipulated as an input in SOM clustering process. Each traces produced data in both magnitude and phase value (Figure 2).
Table 1 Transformer winding configuration and phase to phase comparison method
Winding
Data Description
Transformer Winding Code Phase to Phase Comparison
HV
H1H2 phase (red phase) H1H2 to H2H3 phase
H2H3 phase (yellow phase) H1H2 to H3H1 phase
H3H1 phase (blue phase) H2H3 to H3H1 phase
3.0 SELF ORGANIZING MAPS METHODOLOGY
3.1 Architecture of SOM Network
A typical SOM structure built from two main layers; input and output layer that array in two-dimensional preposition is shown in Figure 3. SOM algorithms resemble Learning Vector Quantization (LVQ). In LVQ all neurons are arranged on a grid together with selected neurons whereas SOM has a feed-forward structure with a single computational layer arranged in rows and columns. Each neuron is fully connected to all the source nodes in the input layer. Neighbouring nodes will be updated to perform neurons order. This indicates that SOM as a multidimensional scaling method from input space to two-dimensional output space. Visual format of SOM help researcher to define clusters, relations and structures in complex input database.
Figure 3 SOM basic architecture
3.2 Best Matching Unit (BMU)
Number of neuron may vary from a few dozen up to several thousands. Each neuron is represented by a d-dimensional weight vector (prototype vector, codebook vector) m = [m1,....,md], where
d is dimension of input vectors. Neurons connected to the adjacent neurons through neighbourhood relation that dictates its topology.
SOM is then subjected to iteration for training the network. Each iteration has one sample vector s from the input data will be selected randomly, and the distances between all the nodes are then calculated by particular distance measures. The neurons that have closest weight vector to the selected sample s is called best
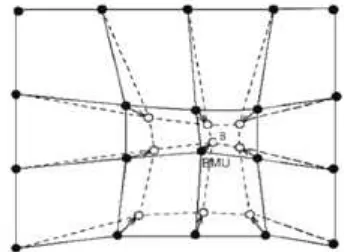
matching unit (BMU) (Fig. 2) and denoted by c
‖ − �‖ = � �‖ − �‖ (1)
where c is referred to Euclidean distance measure.2
Figure 4 Updated the BMU and its neighbourhood. Input sample marked as s. Solid line referring to origin situation and dashed line represent updated condition3
Upon determining BMU, SOM weight vectors are updated so that the BMU will be closer to the input vector in input space. This adaptation process will stretch the BMU and its topological neighbours towards the sample vector (Figure 4).
The SOM update rule for the weight vector m of unit i is input sample has on the SOM.
4.0 FEATURE EXTRACTION
In this research work, the measurement results from SFRA traces are converted into CSV 2.0 format. The retrieved raw data are then used to calculate the numerical parameters. There are three type of parameters as shown in Table 2 that are selected for feature extraction of the SFRA data which are the Cross-Correlation Coefficient Function (CCF) , Standard Deviation (SD) and Absolute Sum Logarithmic Error (ASLE).6-7
Table 2 Numerical parameters and its equations7
used in the measurement. Only the magnitude response data from SFRA measurements are used to compute the numerical features. These features are used as the input vectors for the SOM classification.
5.0 RESULTS AND DISCUSSION
Four sets of SOM parameters (normalization methods and number of neurons) need to be applied and optimized for SOM classification of the numerical features. Below, the results are presented and discussed.
5.1 SOM Parameters Optimization
Each simulation consists of the combination between various
normalization method (‘var’, ‘range’, ‘log’, or ‘logistic’) and optimum number of neurons (from 120 to 340 neurons). For ‘var’ data input, it will be normalized to unity and means to zero while
‘range’ input data will be normalized between zero and one. For
‘log’, natural logarithm as in the equation below is applied.
Xnew = log(X-m+ 1); m= min X (3)
while ‘logistic’ or softmax transformation scales all possible values between zero and one.3
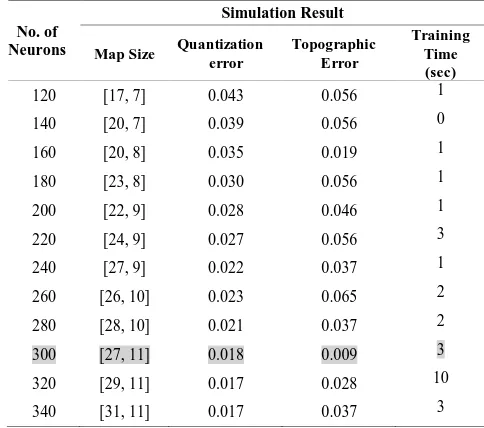
Data normalization is very vital in forming the maps to present higher values to dominate map topology and hide other components. Table 3, 4, 5 and 6 used the same data inputs from SFRA numerical calculated features which are CCF, SD and ASLE with different types of normalization method for SOM classification. All tables have shown that all normalization methods achieve very small quantization and topographic error using 340 neurons except for Table 5 (‘log’ normalization method) that manage to reach low value using only 300 neurons. Low quantization and topographic indicates that good and smooth classification is achieved through hexagonal lattice for all normalization method.
Training time for all classification is achieved by less than or equal five second. Short training time referred to good mapping capability and quality especially for classification process. Upon comparing the least value of quantization and topographic error and also training time, Table 6 or ‘range’ normalization is the best
selection. Therefore, for the SOM classification map, ‘range’
normalization with 340 neurons is selected.
Table 3 Result from MATLAB simulation using hexagonal topology and ‘var’ normalization method
Table 4 Result from MATLAB simulation using hexagonal topology and ‘range’ normalization method
Table 5 Result from MATLAB simulation using hexagonal topology and
Table 6 Result from MATLAB simulation using hexagonal topology and ‘logistic’ normalization method
No. of
5.2 The U Matrix Classification
For U Matrix classification map, hexagonal topology was chosen to get higher resolution and faster result because rectangular topology needed lesser number of neurons to achieve low quantization and topographic error. The U Matrix result (Figure 5) from the selected SOM parameters. The accuracy of classification via BMUs in the U Matrix is considered as almost precise and produces good and smooth mapping quality.
Figure 5 The U Matrix for the ‘range’ normalization for the classification, using Hexagon lattice, with 340 neurons. Both quantization error and topographic error are at 0.009
In the map units or neurons of the U Matrix (Figure 5) shown are labeled by their respective substation with alphabetical order from A to M where each neuron is represented by the vectors of the numerical features. Clearly, the clustering process is achieved by inspecting the data components that are grouped together and place inside a lighter color border that that signifies higher distances and inside darker color border for shorter distances.
It is proven that from the U Matrix visualization, abnormality that happen in a transformer can be analyzed through SOM. Numerical calculated data produced from SFRA signal raw data can be used as an input in clustering to separate between normal (good transformer) and abnormal (defective transformer) data.
5.3 Analysis of Extracted Feature
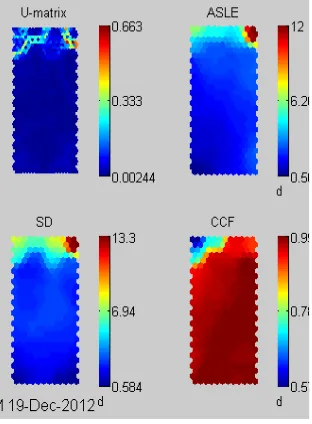
Component plane representation (Figure 6) for the U Matrix (Figure 5) is presented. Observe that, there are three main component planes that represent the numerical calculated features such as CCF, ASLE, and SD that are being used as the SOM classification input data. Each plane portrays the values and patterns of the respective numerical features from the lowest to the highest values as indicated by the indicator on the right of every component plane. The darkest colour corresponds to the lowest values while the lightest colour corresponds to the highest values.
Figure 6 The Plane Representation Showing Data Contribution of Three Numerical Calculated Data for the SOM Classification
The plane representation in Figure 6 also demonstrated that each component projects different pattern and no uniform distribution are found throughout the plane. Hence each plane is
from normal data. SOM visualizations depicted that data that have the same characteristics or conditions are mapped close together. Hence, the numerical features from the good transformers are separated from the defective transformers in the SOM U-Matrix classification. The analysis signifies that the methodology carried out in this research work is an effective way to evaluate the transformer condition from the SFRA traces.
Acknowledgement
Author 1 would like to thanks Ministry of Higher Education (MOHE) and Universiti Teknikal Malaysia Melaka (UTeM) towards financial support given for this research.
References
[1] S. V. Verdu, M. O. Garcia, C. Senabre, A. G. Marin and F. J. G. Franco. 2006. Classification, Filtering and Identification of Electrical Customer Load Patterns Through the Use of Self Organizing Maps. IEEE Transactions on Power System. 21: 1672–1682.
[2] C. Olaru and L. Wehenkel. 1999. Data Mining Tutorial. CAP Tutorial, July 1999. 19–25.
[3] J. Vesanto, J. Himberg, E. Alhoniemi and J. Parhangkas. 1999. Self-organizing Map in Matlab: the SOM Toolbox. Proceedings of the Matlab DSP Conference , Espoo, Finland. 35–40.
[4] A. Kraetge, M. Kruger, J. L. Velasquez, H. Viljeon and A. Dierks. 2009. Aspects of the Practical Application of Sweep Frequency Response Analysis (SFRA) on Power Transformers. CIGRE 6th Southern Africa
Regional Conference. 1–10.
[5] Omicron F. R. 2009. Analyzer User Manual, Sweep Frequency Response Analyzer for Power Transformer Winding Diagnosis. Omicron Electronics.
[6] G. M. Kennedy, A. J. McGrail and J. A. Lapworth. 2007.Using Cross-Correlation Coefficient to Analyze Sweep Frequency Response Analysis (SFRA) Traces. IEEE PES Power Africa 2007 Conference and Exposition, Johannesburg, South Africa. 1–6.
[7] P. M. Nirgude. D. Ashokraju, A. D. Rajkumar and B. P. Singh. 2008. Application of Numerical Evaluation Techniques for interpreting Frequency Response Measurements in Power Transformers.IET Science, Measurement and Technology. 2(5): 275–285.
[8] M. De Nigris , R. Passaglia, R. Berti L. Bergonzi, R. Maggi. 2004.
Application Of Modern Techniques For The Condition Assessment Of Power Transformers. A2-207: 1–12