OPTICAL REFLECTANCE ANALYSIS OF
ARICE FIELD
SYARA ILA FIRDA
DEPARTEMENT OF PHYSICS
FACULTY OF MATHEMATIC AND NATURAL SCIENCES
BOGOR AGRICULTURAL UNIVERSITY
BOGOR
THE THESISSTATEMENTAND
SOURCES OFINFORMATION
Herewith I declare that the thesis entitled Optical Reflectance Analysis of a Rice Field is true of my work under the guidance of the supervisor committee and has not been published in any form to any college. Resources derived or quoted from works published and unpublished from other writers mentioned in the text and listed in the References at the end of this thesis.
Bogor, July 2013
ABSTRACT
Syara Ila Firda.Optical Reflectance Analysis of a Rice Field. Supervised by MUH. NUR INDRO and MAHMUD RAIMADOYA.
Basic of physics concept for applied by remote sensing as a lidar is the basic concept of electromagnetic wave that have a relationship with light speed, wavelength, and frequency. That component usually used to describe travel energy in the sinusoidal wave form. The wavelength of electromagnetic wave can show optical reflectance of the lidar data. It used to analyze the age of paddy and rice field classification. The method of this research is analyze lidar data from the NEST and Fugro-viewer Software. Rice field classification can be determine by using reflectance wavelength in basic physics theory. In this research, electromagnetic region of rice field wavelength for all band are ultraviolet region, visible region, and near-infrared until middle-infrared region. The wavelength of each paddy plot has range of 170-3580 nm with all of lidar band in aerial photo. Keyword: Lidar data, Paddy, Reflectance, Wavelength
ABSTRAK
Syara Ila Firda. Analisis Pemantulan Optik Pada Lahan Sawah. Dibimbing oleh MUH. NUR INDROdan MAHMUD RAIMADOYA.
Konsep dasar fisika dalam aplikasi penginderaan jauh seperti lidar merupakan suatu konsep dasar gelombang elektromagnetik yang memiliki hubungan antara kecepatan cahaya, panjang gelombang, dan frekuensi. Komponen tersebut biasanya digambarkan sebagai bentuk energi berjalan dalam gelombang sinosuidal. Panjang gelombang pada gelombang elektromagnetik dapat memperlihatkan pemantulan optik pada data lidar. Data lidar ini digunakan untuk menganalisis umur padi dan klasifikasi lahan sawah. Metode yang dilakukan pada penelitian ini yaitu menganalisis data lidar menggunakan perangkat lunak NEST dan Fugro-viewer. Klasifikasi lahan sawah dapat diketahui menggunakan pemantulan panjang gelombang dalam teori dasar fisika. Pada penelitian ini, daerah elektromagnetik dari panjang gelombang pada lahan sawah untuk semua kanal berada di daerah ultraviolet, daerah cahaya tampak, dan daerah inframerah dekat hingga tengah. Panjang gelombang dari setiap plot padi memiliki nilai sekitar 170-3580 nm berdasarkan semua kanal lidar di foto permukaannya.
i
The Thesis
submitted in partial fulfillment of the requirements for the degree of
SarjanaSains
at The Department of Physics
OPTICAL REFLECTANCE ANALYSIS OF
A RICE FIELD
DEPARTEMENT OF PHYSICS
FACULTY OF MATHEMATIC AND NATURAL SCIENCES
BOGOR AGRICULTURAL UNIVERSITY
BOGOR
i
Title :Optical Reflectance Analysis of a Rice Field Name : Syara Ila Firda
NIM : G740900031
Approved by,
Drs. Muh. Nur Indro, M.sc Supervisor I
Ir. Mahmud Raimadoya, M.si Supervisor II
Known by,
Dr. Ir.Irmansyah, M.si Head of Applied Physics Division
Date:
PREFACE
Praise and thankfulness to Allah SWT for giving bless, power, and wonderful life that given to author for finished this research proposal named “Optical Reflectance Analysis of a Rice Field”. Greeting also send to the prophet Muhammad SAW becauseof his legacy had inspired author to get better in every each day of life.
On this preface, I want to thankful to everybody that has supported me for this research proposal. First, I would like to thank you to my parents which have support me from the beginning of my life, thank you so much for advice and motivation. I’m also want to thanks to my supervisor, Drs. Muh. NurIndro for the every support and helpful my research. Next, I would like to thanks to Ir. Mahmud Raimadoya for his support of my research process and method. And then for my friend in Geophysical Department that help me for using remote sensing software.
Thanks to all of my friends in Physics Department of IPB for support and motivation that makes a spirit to finish this research proposal when the author want to give up, especially for my beloved friend, nadia, kania, upri, helen, vina, and indri. For the last, I want to thank you to my partner of my life, Mawardiansyah that always give me a support and motivation.
Finally, I hope this research can more forward and developed in science and technology. This research is far for perfect therefore author wants critic and suggestion that build on this research to be better.
Bogor,July2013
i
The Instrument of Research 2
Research Procedure 2
Intensity of Reflectance 3
Physic Formulation 3
The Area of Each Rice Terraces 4
RESULTANDDISCUSSION 5
The Electromagnetic Region 5
The Classification of a Rice Field 8
CONCLUSIONAND SUGGESTION 10
Conclusion 10
Suggestion 10
REFERENCES 11
CURRICULUM VITAE 20
THE LIST OF FIGURE
1 Wave Propagation 4
2 The Flow Chart of Research 5
THE LIST OF TABLE
1 Band Classification 5
2 The Reference Paddy Information 6
3 Rice Field Classification 8
THE LIST OF APPENDIX
1 Observation Location Map (Area of Interest) 12
2 Digitization System in TheNEST software 13
1
INTRODUCTION
Background
Remote sensing data can offer a powerful information source on vegetation parameters, which are needed in all sort models describing processes at the Earth’s surface. This research is using active sensor type of remote sensing,there is Laser Light Detection and Ranging (Lidar). Mapping technology utilizes a laser light detection and ranging (lidar) system and an airborne navigation system that accurately tracks platform location and attitude to produce a dense array of geographic coordinates from points where laser pulses are reflected off a surface.1
Lidar has grown in popularity for remote sensing from airborne platforms. It works on the same principle as radar with pulses of laser light, which are illuminate the Earth’s surface. The conventional version of lidar requires a laser transmitter to launch short pulses of coherent light, and scattered from terrestrial targets. Then records the return time to calculate based on the distance between a sensor and the Earth’s surface.2
In each case, lidar systems possessing different wavelengths are selected to record the elevation or depth (in bathymetric applications) of features. Typically, lidar operates within eye-safe ranges and power levels in the visible and near- to short-wave infrared region of the electromagnetic spectrum by using laser.
The laser pulse does not travel with the speed of light,but with a packet velocity of the coherent light packet, which is a little less than the speed of light.3Since the packet velocity of the laser pulse can be considered invariant for the distances commonly used ALS (Airbone Laser Scanning) practise, this return time measurement can easily be converted to a distance by multiplying it with the speed of the light packet.
Characteristic wavelength of the optical signals dependence allows the measurement of the vegetation parameter in the rice field. This characteristic wavelength can be analyzed using the basic theory of electromagnetic wave. The basic of physics concept for applied by remote sensing are a relationship with light speed, wavelength, and frequency that usually used to describe travel energy in the sinusoidal wave form.4
Wavelength that are low in energy will complicate the process of sensing and sensors operating. Therefore these wavelengths are relative to the large area viewed of the Earth’s surface in order to obtain a detectable energy signal.2
Effective use of an electromagnetic radiation measured by a sensor. It is depend on understanding the physical processes that control the transmission of the electromagnetic radiation from the source to the target. The intensity of the lidar transmission is determined objects reflectance.
The spectrum of electromagnetic wave is commonly divided into region for convenience and by tradition within the field of remote sensing. Electromagnetic waves is used for remote sensing at ultraviolet (UV) to middle infrared (MIR) wavelength.
high frequency and high energy. Near infrared (780-1500 nm) start of the region beyond the red wavelength. Its like the visible region, and frequently used in remote sensing. Middle infrared comprises two main portion: shortwave infrared (SWIR, 1500-3000 nm) and MIR (3000-5000). Middle infrared radiation measured by sensors can comprise a mixed signal of reflected radiation and radiation emitted from the earth's surface.5,6
Problem Formulation
Based on the background described, the author propose problem formulation in this research is how can Lidar data estimate the wavelength of paddy by using the physical basis formulation about electromagnetic energy?
Research Purpose
The purpose of this study is determine the wavelength of paddy using Lidar data with the physical basis formulation about electromagnetic energyfor geting rice field classification.
METHOD
Study Area
The study was conducted in a west Bayah in Banten, close to Cilograng Street. (Appendix 1) The study site had been scanned by laser for study purposes several time in 25 March 2012. Source of data taken from PT. ASI Pudjiastuti Geosurvey as a Lidar data.
The Instrument of Research
Lidar data used the laser scanner surveys. This provided a point cloud were taken by ALS 70 (Airbone Laser Scanning) and aerial photo captured by Leica RCD30 Medium Format Camera. The both of that instrument were on the Piratus Porter PC6 plane. The aerial photo and point cloud of lidar data can be analysis by using the NEST and Fugro-viewer Software. The every area of the rice plot can be get by using ArcMap Software.
Research Procedure
3
Intensity of Reflectance
First, paddy fields divided into 10 different plots using digitization system in the NEST program. (Appendix 2) In every each plot of paddy field, the intensity analysis of reflectance value is using by NEST program. The point cloud of lidar data can be show every point in the form of LAS format by using Fugro-viewer software. Intensity value for each paddy plot is searching for the average, median and standard deviation value. Based on those value which are not much different form paddy plot can be grouped.
Physic Formulation
Electromagnetic radiation provides the link between each component of remote sensing system. It is a form one target to another through space and media and behaves in two inseparable ways: as regular waves of energy and as rapidly moving and indivisible particles or photons.4 The former is described by the basic wave theory that combine with power energy and travel energy formulation. Power is the rate of energy conversion per unit of time.7 Power, P, is determined by
In the system, intensity (I) develops when power is distributed over area.8 Specifically, intensity is equal to power per unit area, or power divided by area (A), or, conversely
The unit of power is watt. Thus,
. 6,9 Now this equation can be rewritten in a slightly different form,
Quantum theory describes electromagnetic radiation as composed of many discrete units called quanta or photon. The use of the basic wave and quantum theory of electromagnetic radiation are complementary and useful for understanding the physical basis of remote sensing.4The radiant energy is expressed as,
where h = Planck's contant, 6.62 x 10⁻³⁴ J sec, and c = the velocity of light, 3 x 10⁸. is a wavelength of the electromagnetic wave that can be get with substituted equation (4) and (5), so
Since the packet velocity of the laser pulse can be considered invariant for the distances commonly used ALS (Airbone Laser Scanning) practise, this return time measurement can easily be converted to a distance by multiplying it with the speed of the light packet:
Note the number two in the denominator, which is due to the fact that the laser pulse travels the distance between scattering element and emitter/receiver twice (Figure 1). is a little less than the speed of light, but can in most computations be exchanged for the real speed of the light. 3 Subtitue equation (6) to (7) and the equation given by,
Figure 1. Wave Propagation 2 The Area of Each Rice Terraces
The area of each paddy plot was analyzed by using ArcMap program with GeoTiff format. The analysis is used a digitation method, that must get the real geoposition and geocoding first. The wavelength can be characterized through a number of variables:4
(i) Speed: all electromagnetic waves travel at the speed of light (c)
(ii)Planck constant describes the behavior of particle and waves at atomic level as well as the particle nature of light.
(iii) The intensity (I) refers to the amount of object reflectance (iv) Area is size of a surface part of the rice field
5
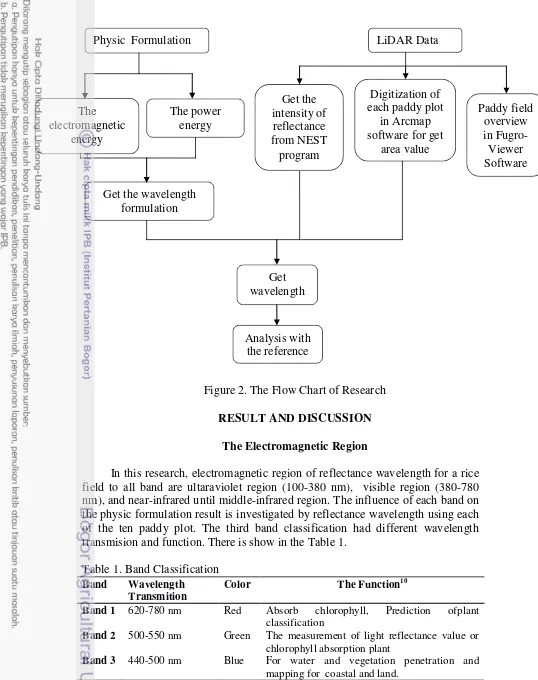
Figure 2. The Flow Chart of Research RESULT AND DISCUSSION
The Electromagnetic Region
In this research, electromagnetic region of reflectance wavelength for a rice field to all band are ultaraviolet region (100-380 nm), visible region (380-780 nm), and near-infrared until middle-infrared region. The influence of each band on the physic formulation result is investigated by reflectance wavelength using each of the ten paddy plot. The third band classification had different wavelength transmision and function. There is show in the Table 1.
Table 1. Band Classification
Band Wavelength
Transmition
Color The Function10
Band 1 620-780 nm Red Absorb chlorophyll, Prediction ofplant
classification
Band 2 500-550 nm Green The measurement of light reflectance value or
chlorophyll absorption plant
Band 3 440-500 nm Blue For water and vegetation penetration and
mapping for coastal and land.
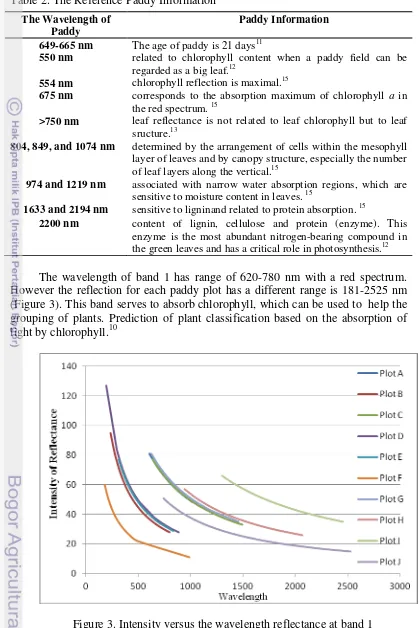
Table 2. The Reference Paddy Information
The wavelength of band 1 has range of 620-780 nm with a red spectrum. However the reflection for each paddy plot has a different range is 181-2525 nm (Figure 3). This band serves to absorb chlorophyll, which can be used to help the grouping of plants. Prediction of plant classification based on the absorption of light by chlorophyll.10
Figure 3. Intensity versus the wavelength reflectance at band 1
The Wavelength of Paddy
Paddy Information
649-665 nm The age of paddy is 21 days11
550 nm related to chlorophyll content when a paddy field can be regarded as a big leaf.12
554 nm chlorophyll reflection is maximal.15
675 nm corresponds to the absorption maximum of chlorophyll a in the red spectrum. 15
>750 nm leaf reflectance is not related to leaf chlorophyll but to leaf sructure.13
804, 849, and 1074 nm determined by the arrangement of cells within the mesophyll layer of leaves and by canopy structure, especially the number of leaf layers along the vertical.15
974 and 1219 nm associated with narrow water absorption regions, which are sensitive to moisture content in leaves. 15
1633 and 2194 nm sensitive to ligninand related to protein absorption. 15
7
Figure 4. Intensity versus the wavelength reflectance at band 2
Band 1 have different range of wavelength and function than another band. The wavelength of band 2 has a range of 500-550 nm with green spectrum. However the reflection for each paddy plot has a different range is 170-2148 nm (Figure 4).This band is for the measurement of light reflectance value or chlorophyll absorption plant as well as measurement of plant condition. 10
The wavelength of band 3 has a range of 440-500 nm with blue spectrum. Whereas the wavelength reflection for each paddy plot has a range of 294-3580 nm (Figure 5). Actually, this band is dedicated for water and vegetation penetration as well as mapping for coastal and land.10 Its not very effective for vegetation classification of a rice field but it more useful to water analysis in the wet land.
The Classification of The Rice Field
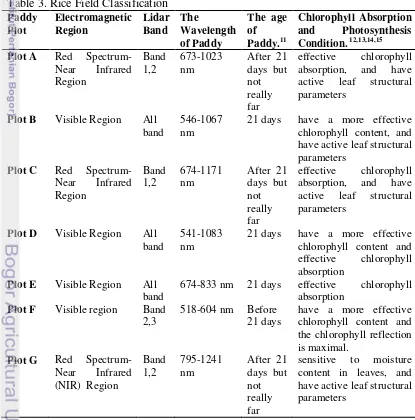
Referring to the fundamental analysis, i.e. the impact of the LIDAR bands on the results only, the following findings can be stated the value of each paddy plot is not much different are B, E, D plot has a range in ultraviolet region until visible region and A, C, and G plot that have a range in red spectrum until midlle infrared but in the band 3 those plot just in the infrared region. The classification in each paddy plot can be show in Table 3.
Table 3. Rice Field Classification
Paddy Plot A Red
Spectrum-Near Infrared
21 days have a more effective
chlorophyll content, and have active leaf structural parameters
Plot C Red Spectrum-Near Infrared
21 days have a more effective
chlorophyll content and effective chlorophyll absorption
Plot E Visible Region All band
674-833 nm 21 days effective chlorophyll
absorption
Plot F Visible region Band 2,3
518-604 nm Before
21 days
have a more effective chlorophyll content and the chlorophyll reflection is maximal.
9 sensitive to lignin and protein absorption
sensitive to lignin and protein absorption, and sensitive to lignin and protein absorption, and
more effective photosynthesis
The previous researchers11 said that in the 21 days show the wavelength of paddy from 649 nm until 665 nm.In this research, the paddy plot has a wavelength in that region are plot B, plot E, plot D. Its means just plot B, plot E and plot D has the value of wavelength is able to show the age of paddy is 21 days. This analysis can be show another plot of paddy age. The age of paddy in the plot F has a less days, before 21 days. Moreover, the another plot like plot A, plot C, plot G, plot H, plot I, and plot J has a pass days, after 21 days but for plot A and C the age of paddy is closer to that day.
The value of wavelength in 550 nm was related to chlorophyll content when a paddy field can be regarded as a big leaf.12The paddy plot has a wavelength in that region are plot B, plot E, plot D and plot F that have a more effective chlorophyll content than another plot. In addition, the 554 nm band is located at the green reflectance peak in the visible region, where chlorophyll reflection is maximal.15
The wavelength at 675 nm corresponds to the absorption maximum of chlorophyll a in the red spectrum.15The paddy plot has a wavelength in that region are plot A, plot B,plot C, plot D and plot E that have a more effective chlorophyll absorption than another plot.
Structural parameters play a key role in the incoming signal radiation especially in the near-infrared region (>750 nm) where leaf reflectance is not related to leaf chlorophyll but to leaf sructure.13The reflectance at 804, 849, and 1074 nm are mainly determined by the arrangement of cells within the mesophyll layer of leaves and by canopy structure, especially the number of leaf layers along the vertical. The 974 and 1219 nm bands are associated with narrow water absorption regions, which are sensitive to moisture content in leaves.15The paddy plot has a wavelength in that regionare plot A, plot B, plot C, and plot G that have a active leaf structural parameters than another plot. The wavelength in 1219 nm plot G, plot H and plot J that are sensitive to moisture content in leaves.
The wavelength at 1633 nm corresponds to the first overtone of N-H absorption and the third overtone of NH3+NH deformation, in the short wave
in that region are plot H, plot I and plot J that have a more sensitive to lignin and protein absorption than another plot.
The value of wavelength in 2200 nm is to content of lignin, cellulose and protein (enzyme). This enzyme is the most abundant nitrogen-bearing compound in the green leaves and has a critical role in photosynthesis.12 The paddy plot has a wavelength in that region are plot I and plot J that have a more effective photosynthesis than another plot. However, in the band 2 that have green spectrum for chlorophyll will likely be reflected, because in the process of photosynthesis does not require energy in the green wavelength.14
CONCLUSION AND SUGGESTION
Conclusion
This present study shows a relation between the intensity of reflectance and the reflectance wavelength of a rice field. The main feature of this relation is the intensity of reflectance decreases as when the wavelength increases. This corresponds with the physical basis formulation about electromagnetic energy that have empirical equation of this relation has been proposed.
The classification of a rice field can be determine by using reflectance wavelength. In this research, electromagnetic region of reflectance wavelength for a rice field to all band are ultraviolet region, visible region, and near-infrared until middle-infrared region. The wavelength of each paddy plot has arange of 170-3580 nm with all of lidar band in aerial photo.
The paddy age of plot B, plot D, and plot E are 21 days in the wavelength from 570.55 nm to 566.01 nm and have effective chlorophyll content including plot F in the wavelength from 550 to 554 where chlorophyll reflection is maximal. Plot A,plot C, and plot G have the older age but the different is not really far. In this age, paddy have a more effective chlorophyll absorption and sensitive to moisture content in leaves.
The paddy age of plot H, plot I, and plot J has a pass days, after 21 days. These plot have a more sensitive to lignin and protein absorption and have a content of lignin, cellulose and protein (enzyme). This enzyme is the most abundant nitrogen-bearing compound in the green leaves and has more effective photosynthesis.
Suggestion
11
REFERENCES
1. Hartfield, Kyle A, et all. Fusion of High Resolution Aerial Multispectral and Lidar Data: Land Cover in the Context of Urban Mosquito Habitat. Remote Sensing. 2011;3:2364-2383.
2. Chu,Xinzhao. Lidar Remote Sensing. CU-BOULDER, FALL. 2012.
3. Morsdorf, Felix. LIDAR Remote Sensing for Estimation of Biophysical Vegetation Parameters Remote Sensing Series 47. Zurich University: Remote Sensing Laboratories. 2007
4. Boyd, D.S. Physical Basis of Remote Sensing. GEOINFORMATICS Kingston University, UK. 2005;1.
5. ayuyui. Spektrofotometri. [22 june 2013]. http://ayuyui.wordpress.com /2012/06/ 20 /spektrofotometri/. 2012.
6. Giwangkara S. Spektrofotometri Infra Merah. [22 june 2013]. http://persembahanku. wordpress.com/2007/06/26/spektrofotometri-infra-merah/. 2007.
7. Schobert, Harold H. Energy and Society. New York, Taylor & Francis. 2002.
8. Gelfrand,Stanley A. Essentials of Audiology. New York, Thieme Medical Publishers. 2009.
9. Newell, Philip. Recording Studio Design. Burlington, USA: Elsevier Ltd. 2008.
10.Wuryadi. Studi Terrain Prospecting area Lampung dengan Pengindraan dan Integrasi Data Lapangan.Laporan Tahap Akhir: PT. PERTAMINA EP. 2010.
11.Banyo,Yunia E. Konsentrasi Klorofil Daun Padi Pada Saat Kekurangan Air yang Diinduksi Dengan Polietilen Glikol, Jurnal Ilmiah Sains. 2013;13, No. 1
12.Inoue Y, Moran M S, Horie T. Analysis of spectral measurament in paddy field for predicting rice growth and yield based on a simple crop simulation model. The Journal of Plant Production Science. 1998: I, No. 4. 13.Stroppiana D. et al.Remotely Sensed Estimation Of Rice Nitrogen
ConcentrationFor Forcing Crop Growth Models. Italian Journal of Agrometeorology.2006;3:50 - 57
14.Sukmono A, Handayani H H, Wibowo A. Algoritma Estimasi Kandungan Klorofil Tanaman Padi Dengan Data Airborne Hyperspectral. The paper of ITS.2011
15.Wang F, et all. Optimal waveband identification for estimation of leaf areaindex of paddy rice. The Journal of Zhejiang University Science B. 2008
APPENDIX 1
13
APPENDIX 2
Digitization System in The NEST software
Plot B
15
Plot D
Plot F
17
Plot H
19
APPENDIX 3
CURRICULUM VITAE
The author was born in Pasar Minggu, South Jakarta, in 29th January 1992 from couple of Mr. Eddy Arus Sentani and Mrs. Puji Astuti. She is first sister from there three children. The author finished her study in Yasporbi III Elementary school for six years, and then 107 junior high school in South Jakarta for three years. Next education in senior high school of Al Azhar 2 Pejaten and active as vice chairman ofteeneger scientific papers organization in 2006 until 2008, as well as active in outside school organization such as Karang Taruna in 2006 until 2009