THE INFLUENCE OF SPATIAL URBANIZATION TO REGIONAL CONDITION IN PERIURBAN AREAS
OF YOGYAKARTA
Andri Kurniawan
Bambang Sriyanto Eko Prakoso
Faculty of Geography, Gadjah Mada University, Bulaksumur, Yogyakarta Phone (0274) 6492331, Fax (0274) 6492348
E-mail : [email protected]; [email protected]
ABSTRACT
I
t is interesting to study periurban areas because of its transitional characteristic. Periurban areas undergo dynamic changes as a result of spatial urbanization. This study is aimed at: (1) examining the development pattern of spatial urbanization in Yogyakarta and finding out the influential determinant factors; (2) examining the dynamics of land use changes in periurban areas and finding out the resultant impacts; (3) examining the pattern and development of services (infrastructures) and finding out the determinant factors supporting the development of services (infrastructures) in periurban areas; (4) examining the role of the development of periurban services (infrastructures) as magnetic forces for periurban development; and (5) making policies concerning periurban development and management in order to achieve optimal development and to balance the functions of urban and rural areas. The methods used in this research are secondary data analyses and aerial photo interpretation. This study applies secondary data analysis by comparing the data to find out the extent of the changes. Descriptive statistics, scaling, and discri-minant analysis are used as the analytical techniques to find out the determinant factors of urban growth in periurban areas. Spatially, urbanization in Yogyakarta periurban areas tends to move toward the western part (Ngestiharjo village), northern part (Catur Tunggal village) and eastern part (Banguntapan village). Besides centrifugal forces, the development of built land and urban characteristics in the western, northern and eastern parts are also influenced by the main roads (corridors) from Yogyakarta to Kaliurang, from Yogyakarta to Wates, and from Yogyakarta to Solo. The existence of the corridors prompts the functions of trade and services which, in turn, trigger the development of the surrounding housing complex. On the contrary, in the southern and south-east part of Yogyakarta the activities of service have not yet well-developed and neither have the new housing complex. The development of number and density population are variables determining urban development in Yogyakarta periurban areas. The dynamics of land use changes in Yogyakarta periurban areas are characterized by the decrease in agricultural land (6.46 % per year) and the increase in built land. The decrease in agricultural land reduces the sustainability of agricultural environment. Agricultural production can no longer satisfy periurban people’s needs for food. The different strength in interaction results in the difference in the facilities of service (infrastructure) between periurban areas. The periurban dynamics in Yogyakarta are also characterized by the increase in function and sustainability of services. The development of service (infrastructure) in Yogyakarta periurban areas have a lot of impacts especially those related to the increase in urban characteristics. In some parts of periurban areas, there is a relation between the increase in service provision and the development of urban characteristics.Keywords : Influence, Spatial Urbanization, Regional Condition, Periurban Areas
INTRODUCTION
Periurban areas are interesting to study in terms of their transitional charac-teristics. These areas are dynamic and
consequence of urban center centrifugal movement and government policy. The development of housing complex and in-frastructures in periurban areas will poten-tially change the areas into urban (built up areas). In many cases, some areas grow even faster than the prediction. It can be seen from the mega or mini projects conducted by developers in the form of residential resorts, mini estates, agro-estates, and in-tegrated resorts in periurban areas (Lee, 1979). Without the readiness of regional socio-economic basis, this phenomenon has reclassified suburban areas into urban areas, and hence, it does not encourage the functional change of the areas. Also, the spatial physical changes (interchange dy-namic) caused by land exploitation and infrastructural development in periurban areas have caused spatial fragmentation.
In fact, periurban areas have no uni-form spatial characteristics. Periurban areas appear in diverse physical characteristics (Yunus, 2001). The diversity is influenced by the centrifugal and centripetal move-ment as well as the magnetic forces (Colby, 1959). The various magnetic forces in periurban areas bring about the different spatial appearance. The development of functional agglomeration and the additional facilities in periurban areas prompt the functional changes of the surrounding land. These phenomena generate the existence of spatial transformation in periurban areas. The development of new functions because of spatial transformation will have an impact on the socio-economic condition of periurban residents (Garland, et. al., 2007). Reorientation of land use and economic activities will be the consequence of the change in land value.
This research is aimed at:
1. Studying the developmental pattern of spatial urbanization in Yogyakarta and finding out the influential determinants. 2. Studying dynamic changes of land use in periurban areas and finding out the impacts
3. Studying the developmental pattern of infrastructure and finding out the de-terminant factors that support the infrastructural development in periur-ban areas.
4. Examining the role of infrastructural development as a magnetic force for the periurban development.
5. Making policies concerning periurban development and management in order to achieve optimal development and to balance the functions of urban and ru-ral areas.
With the above objectives, the re-search results hopefully will be able to pro-vide direction for policy makers (local gov-ernment) or city planners to formulate re-alistic spatial policies in managing periurban areas as a part of urban develop-mental management. In addition, the re-search results will be able to be employed as guidance in the development of hous-ing complex and infrastructures in periurban areas in order to achieve optimal develop-ment and to balance the functions of ur-ban and rural areas.
RESEARCH METHOD
Diagram of Framework Flow
pro-cess, and impact. To understand the pat-tern, physical morphological approach is used in terms of deductive reasoning. The discussion of developmental process and impact employ empirical approach (1996 and 2006). The variables used in this re-search covering landuse, production, num-ber dan density of population, livelihood, number and types of services. That vari-ables source from Village Potentialities Data. The analytical techniques used namely descriptive statistics, scaling, and discriminant analysis are used to find out the determinant factors of urban growth in periurban areas.
The characteristics of periurban area is used to determine of periurban areas. In this research, the selected periurban areas are located around Yogyakarta city (parts of Sleman dan Bantul Regency). Those ar-eas are indicated by the mixture of urban and rural land uses. This mixture is the main characteristic of a periurban area. The sample areas are selected purposively by considering the aspect of developmental speed, developmental orientation, intensity and form of land changes, and accessibil-ity rate.
The analyses in this research are di-vided into three main groups : (1) analysis of pattern, (2) analysis of process (devel-opment), and (3) analysis of impact. These three analyses are related to each other in explaining the changes in periurban areas. The view of changes include the infrastructural development, spatial trans-formation, and socio-economic condition of periurban residents. The analysis of pat-tern has three dimensions : (1) spatial di-mension, (2) temporal didi-mension, (3) spa-tial policy dimension (Yunus, 2001). Next,
the research on physical spatial aspect and socio-economic condition of periurban residents is conducted to analyze the im-pact. Air photo interpretation and Geo-graphic Information System are used to examine the spatial transformation. This research employs time series data to exam-ine the development.
RESEARCH RESULT AND DISCUS-SION
Spatial Urbanization of Yogyakarta Periurban Areas
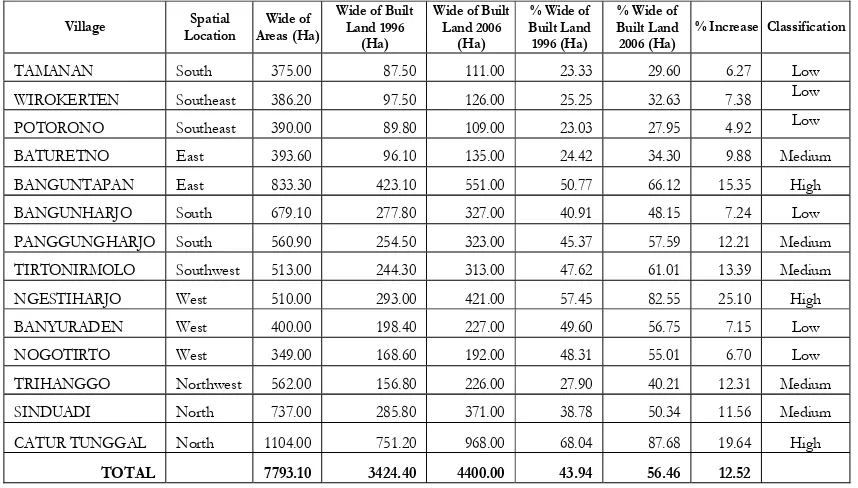
Every year, Yogyakarta periurban areas develop significantly. It is shown from the extension of urban physical appearance as a result of spatial urbanization. The pat-tern of spatial urbanization in periurban areas can be identified by observing the development of built land and the extent urban development in Yogyakarta periur-ban areas.
The development of built land is one of the elements when observing the urban development. The development of built land will show physical development of buildings. Therefore, urban characteristics can be clearly observed physically. The development of built land in periurban ar-eas is the impact of urban development (McGee, 1987).
roads (corridors) from Yogyakarta to Kali-urang, from Yogyakarta to Wates, and from Yogyakarta to Solo. The existence of the corridors prompts the functions of trade and services which, in turn, trigger the
de-velopment of the surrounding housing com-plex. On the contrary, in the southern and south-east part of Yogyakarta the activi-ties of service have not yet well-developed and neither have the new housing complex.
Village Spatial Location
% Increase Classification
TAMANAN South 375.00 87.50 111.00 23.33 29.60 6.27 Low
WIROKERTEN Southeast 386.20 97.50 126.00 25.25 32.63 7.38 Low
POTORONO Southeast 390.00 89.80 109.00 23.03 27.95 4.92 Low
BATURETNO East 393.60 96.10 135.00 24.42 34.30 9.88 Medium
BANGUNTAPAN East 833.30 423.10 551.00 50.77 66.12 15.35 High
BANGUNHARJO South 679.10 277.80 327.00 40.91 48.15 7.24 Low
PANGGUNGHARJO South 560.90 254.50 323.00 45.37 57.59 12.21 Medium
TIRTONIRMOLO Southwest 513.00 244.30 313.00 47.62 61.01 13.39 Medium
NGESTIHARJO West 510.00 293.00 421.00 57.45 82.55 25.10 High
BANYURADEN West 400.00 198.40 227.00 49.60 56.75 7.15 Low
NOGOTIRTO West 349.00 168.60 192.00 48.31 55.01 6.70 Low
TRIHANGGO Northwest 562.00 156.80 226.00 27.90 40.21 12.31 Medium
SINDUADI North 737.00 285.80 371.00 38.78 50.34 11.56 Medium
CATUR TUNGGAL North 1104.00 751.20 968.00 68.04 87.68 19.64 High
TOTAL 7793.10 3424.40 4400.00 43.94 56.46 12.52
Table 1. The Dynamics of Built Land in Yogyakarta Periurban (1996 and 2006)
Source: Result of Data Analysis of Village Potentialities in 1996 and 2006
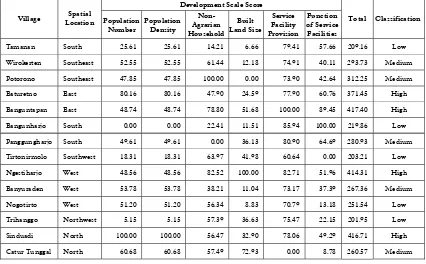
Spatial urbanization in periurban ar-eas can also be identified from the extent of urban development. This development is studied using multivariate statistics. The appropriate method is discriminant analy-sis. Before applying discriminant analysis, variables characterizing urban development are classified and presented in the form of a table. The table contains the composite scores of the development of each vari-able characterizing urban development (Table 2.). Total scale scores of the devel-opment of each variable describe the final result of overall development. The mea-surement of the development composite
index will show the development of urban characteristics of every village. The final development score will then be tested to find out the most determinant factor of urban development.
tics developed to northern, western and eastern parts of Yogyakarta periurban ar-eas. The northward development reached not only to Catur Tunggal village but spread out to the west of Catur Tunggal, i.e. Sinduadi village.
The eastern rapid development shows the strong influence of the city. Two villages, Banguntapan and Baturetno, showed the categories of high urban de-velopment. The western part, represented by Ngestiharjo village, provided a good access from the western areas. In the south-ern parts of Yogyakarta, urban character-istics were not well developed as a result of the low growth of service functions.
Next. discriminant analysis is applied to find out the determinant factors of ur-ban development. Discriminant analysis is
a multivariate technique as a part of de-pendence method involving dependent and independent variables. It means that the result of some variable depends on the data of independent variables. The specific fea-tures of this analysis are that the data of dependent variable must be in the form of category data and that the independent data must be in the form of non-category data. The variable used here is the urban devel-opment measured using scaling technique. The result of discriminant analysis is pre-sented in the following table:
The above table presents the analyti-cal test on the difference of group means of each independent variable toward depen-dent variable. After finding the difference of group means of each variable, the vari-able with real difference can be determined. This variable becomes a determinant
vari-Development Scale Score
Wirokerten Southeast 52.55 52.55 61.44 12.18 74.91 40.11 293.73 Medium
Potorono Southeast 47.85 47.85 100.00 0.00 73.90 42.64 312.25 Medium
Baturetno East 80.16 80.16 47.90 24.59 77.90 60.76 371.45 High
Banguntapan East 48.74 48.74 78.80 51.68 100.00 89.45 417.40 High
Bangunharjo South 0.00 0.00 22.41 11.51 85.94 100.00 219.86 Low
Panggungharjo South 49.61 49.61 0.00 36.13 80.90 64.69 280.93 Medium
Tirtonirmolo Southwest 18.31 18.31 63.97 41.98 60.64 0.00 203.21 Low
Ngestiharjo West 48.56 48.56 82.52 100.00 82.71 51.96 414.31 High
Banyuraden West 53.78 53.78 38.21 11.04 73.17 37.39 267.36 Medium
Nogotirto West 51.20 51.20 56.34 8.83 70.79 13.18 251.54 Low
Trihanggo Northwest 5.15 5.15 57.39 36.63 75.47 22.15 201.95 Low
Sinduadi North 100.00 100.00 56.47 32.90 78.06 49.29 416.71 High
Catur Tunggal North 60.68 60.68 57.49 72.93 0.00 8.78 260.57 Medium
Source: Result of Data Analysis of Village Potentialities in 1996 and 2006
able since according to the principle of dis-criminant analysis, a determinant variable determines the difference of each group or is often called a distinguishing variable.
The variable determining the differ-ence can be seen in the probability or the significance score (sig.). If the probability or sig. score < 0.05. there is a real differ-ence between groups caused by the vari-able. If the probability or sig. score > 0.05. there is no real difference between groups. Having found out the distinguishing vari-able. the variable determining the differ-ence of urban development in survey ar-eas can be identified the development of population numberand of the development of population density (sig. score < 0.05) are variables determining the difference of urban development in research areas.
That condition indication that growth of population number in periurban areas disseminate not flatten, while other town variable experience of more growth flatten. Periurban areas is place accommo-date migrants and urban workers, growth of population number which tend to con-centration at selected regional shares, as in
Sinduadi and Catur Tunggal in upstate and also Baturetno in southeast. But that way, growth of high enough population number in the periurban areas do not followed by the have expanding of service types and amount, so that result downhilll of serving capacity him and service function. And so it is with factor growth of opportunity of non agriculture disseminating do not in line with spatial g rowth in Yog yakarta periurban. That Condition if let will be potency peep out the problem of not serv-ing and the increasserv-ing of unemployment in some part of Yogyakarta periurban espe-cially at upstate region and south-east.
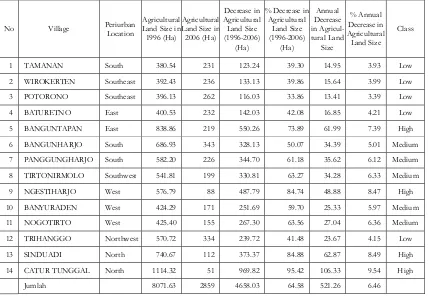
Transfor mation in Yog yakarta periurban areas was also identified by land use changes. especially related to agricul-tural land (Yunus, 2000). According to the data. from 1996 to 2006 the agricultural land in Yogyakarta periurban areas had re-duced to 4658.03 hectare. The decrease of 64.58% in agricultural land is of high sig-nificance. It means that during the period the conversion of agricultural land to non-agricultural land in Yogyakarta periurban areas reached 6.46% per year (Table 4.). Table 3. The Result of Discriminant Analysis
Source: Result of Data Processing
Wilks’
Lambda F Df1 Df2 Sig
Scale score of the development of population number 0.386 8.746 2 11 0.005
Scale score of the development of population density 0.386 8.746 2 11 0.005
Scale score of the development of non-agrarian households 0.869 0.830 2 11 0.462
Scale score of the growing size of built land 0.769 1.657 2 11 0.235
Scale score of the development of service facility provision 0.801 1.368 2 11 0. 295
The high percentage of agricultural land conversion resulted from people’s growing needs of residential land. A lot of new resi-dential buildings were built in Yogyakarta periurban areas to accommodate the grow-ing number of population interested to live in periurban areas. These areas were inter-esting for living because of the comfort and the considerable price of the land. In addi-tion, the conversion of agricultural land also resulted from the development of urban functions as the manifestation of urban development. The development of urban functions generated the growing demand for the establishment of trade centers, offices, and service facilities. This condition con-verted the agricultural land into non-agri-cultural land so that the agrinon-agri-cultural land decreased.
Spatially, the decrease in agricultural land was primarily observed in the northern and western part. In the northern part, Catur Tunggal village suffered the highest-level land conversion, reaching 9.54 % per year. In the western part, Ngestiharjo village suf-fered the highest-level land conversion, reaching 8.47 % per year. In the northern part, the high-level land conversion was caused by the growing number of educa-tional functions (universities) and trade cen-ters that converted the agricultural land in Sinduadi village into non-agricultural land. The location of Sinduadi village on the ac-cess road between Yogyakarta and other important areas in the northern part induced the high-level land conversion. In Ngesti-harjo village, land conversion was primarily instigated by the development of roads that
No Village Periurban
Location
Source: Result of Data Processing of Village Potentialities in 1996 and 2006
opened the access to the periurban housing complex. Relatively preservable agricultural land can be found in the southeastern part of Yogyakarta, including Tamanan, Wiro-kerten, Potorono, and Baturetno villages. In those 4 villages, the residential development and urban functions had not been progres-sively developed and brought few impacts on land conversion. Therefore, the south-eastern part of Yogyakarta can be used as the center of rice production in periurban areas by implementing policies controlling agricultural land conversion. In the south part of Yogyakarta, however, despite its rela-tively low level, the agricultural land con-version must be well controlled given that most of technically irrigated agricultural land is found in this area.
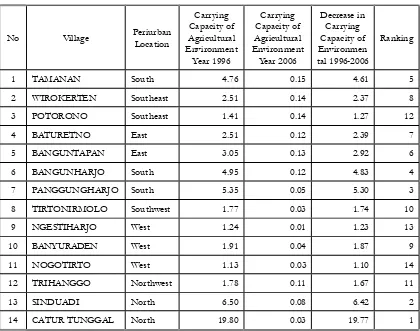
Periurban areas are often associated with the development of agricultural sec-tor. The land conversion in periurban areas affects agricultural sector. The changes in agricultural sector can be seen in the dy-namic carrying capacity of agricultural en-vironment (Soemarwoto, 1982). From 1996 to 2006, there was a significant decrease in the carrying capacity of agricultural envi-ronment in Yogyakarta periurban areas (Table 5.). In 1996, the carrying capacity of agricultural environment in Yogyakarta periurban areas was relatively high (> 1). Agricultural production could satisfy the needs of Yogyakarta periurban and even urban people. In 2006. however, the carry-ing capacity of agricultural environment declined significantly. Agricultural produc-tion could no longer satisfy the needs of periurban people. This condition was rep-resented by the score of carrying capacity of agricultural environment by < 1 in all villages. Even in Ngestiharjo, Nogotirto, Tirtonirmolo, and Catur Tunggal villages, the carrying capacity of agricultural
envi-ronment was very low indicated by the lim-ited scope of agricultural land; hence, agri-culture was no longer considered as a reli-able sector.
The decrease in the sustainability of residential environment in Yogyakarta periurban areas stemmed largely from the high conversion of agricultural land into non-agricultural land due to people’s grow-ing needs for housgrow-ing. The land conversion also resulted from the building of various facilities and the development of urban functions in periurban areas. The significant decrease of 19.77 in sustainability of agri-cultural environment was observed in Catur Tunggal village (Table 5.). This significant decrease resulted from the high level of land conversion due to the development of urban functions and the impacts of urban sprawl. The primary cause of the decrease in agricultural land in Catur Tunggal vil-lage was the development of residential areas and facilities especially those associ-ated with educational services. As a result, most of agricultural land was converted into non-agricultural land; and this conver-sion decreased the sustainability of agricul-tural environment. Such a significant de-crease was also observed in Sinduadi vil-lage in the northern part of Yogyakarta city. This village was greatly affected by the growth of Yogyakarta having a tendency to move northward. In addition. the agri-cultural land conversion in Sinduadi also resulted from the increasing operational use of Yogyakarta – Semarang corridor.
and service. The development of trade and service sectors can be observed by the in-creasing growth of trade centers built in agricultural land.
The dynamics of land use changes in Yogyakarta periurban areas had an in-fluence on the change in people’s living structure (Montgomery, 2008). The num-ber of non-agrarian household increased reaching 10531 households from 1996 to 2006 (Table 6). The increasing number of non-agrarian household resulted from the limited opportunity in agricultural sector and wider opportunity in non-agricultural sector. The decrease in work opportunity
in agricultural sector was in line with the annual decrease of 6.46 % in agricultural land size. The limited agricultural land made it impossible for households in periurban villages to rely only on agricul-tural sector. They had to earn additional income from non-agricultural sectors, such as trade and service. Some of periurban households even “pulled” themselves away from agricultural sector by selling their ag-ricultural lands and worked totally in non-agricultural sectors. This changing trend of living structure developed from the wider opportunity in non-agricultural sectors (trade and service) as a consequence of the development of urban functions.
Table 5. The Dynamic Carrying Capacity of Agricultural Environment in Yogyakarta Periurban Villages (1996 and 2006)
No Village Periurban
Location
Carrying Capacity of Agricultural Environment
Year 1996
Carrying Capacity of Agricultural Environment
Year 2006
Decrease in Carrying Capacity of Environmen tal 1996-2006
Ranking
1 TAMANAN South 4.76 0.15 4.61 5
2 WIROKERTEN Southeast 2.51 0.14 2.37 8
3 POTORONO Southeast 1.41 0.14 1.27 12
4 BATURETNO East 2.51 0.12 2.39 7
5 BANGUNTAPAN East 3.05 0.13 2.92 6
6 BANGUNHARJO South 4.95 0.12 4.83 4
7 PANGGUNGHARJO South 5.35 0.05 5.30 3
8 TIRTONIRMOLO Southwest 1.77 0.03 1.74 10
9 NGESTIHARJO West 1.24 0.01 1.23 13
10 BANYURADEN West 1.91 0.04 1.87 9
11 NOGOTIRTO West 1.13 0.03 1.10 14
12 TRIHANGGO Northwest 1.78 0.11 1.67 11
13 SINDUADI North 6.50 0.08 6.42 2
14 CATUR TUNGGAL North 19.80 0.03 19.77 1
The increasing number of non-agrar-ian household is observed in Sinduadi vil-lage. reaching 2688 non-agrarian house-holds from 1996 to 2006. This phenom-enon stemmed primarily from the high population growth of 2.34% per year and agricultural land conversion. The growing population number made it impossible to absorb all people to work in agricultural sector. Many of them are employed in non-agricultural sector. This condition also ap-plies in other villages but Tamanan, Catur Tunggal, Trihanggo, and Panggungharjo villages. In these three villages, the num-ber of non-agrarian households decreased. The decreasing number of non-agrarian households is not caused by wider oppor-tunity in agricultural sector but rather caused by the increasing number of
popu-lation moving out of the villages to find better living.
The development of services (infra-structure) is analyzed by observing the de-velopment from 1996 to 2006 focusing on the development of provision and function of service facilities. The development of provision of service facilities will show ag-glomeration of urban socioeconomic activi-ties (Sati and Mansoori, 2007). The devel-opment of function of service facilities will show the extent to which each kind of fa-cilities can serve the population of each area.
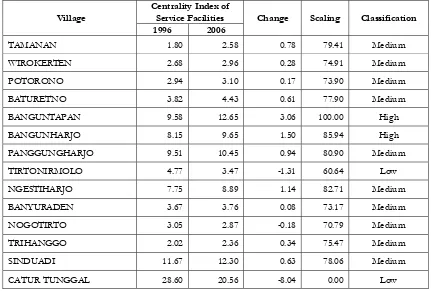
The change in service facility provi-sion rate is described by the change in cen-trality index in 1996 and 2006. Cencen-trality index is a description of the number of ser-Table 6. Dynamics of the Number of Non-Agrarian Households
in Yogyakarta Periurban Villages (1996 and 2006)
Source: Result of Data Processing of Village Potentialities in 1996 and 2006
No Village Periurban
vice facilities provided in each area. From the table below, it is seen that the change in centrality index varies throughout vil-lages. The positive centrality index indicates the increase in number and/or kind of ser-vice facilities while the negative centrality index indicates the decrease in number and/ or kind of service facilities.
The highest centrality index of 3.06 is found in Banguntapan village (Table 7). This figure indicates that for 10 years since 1996 the number and kind of service fa-cilities had increased by 3.06 % of total service facilities for all villages. The small-est centrality index of -8.04 is found in Catur Tunggal village. This figure indicates that since 1996 in Catur Tunggal village the number and kind of service facilities had
decreased by 8.04% of total service facili-ties for all villages. The changing number and kind of service facilities indicates the dynamic development of Yogyakarta periurban areas.
The dynamics of Yogyakarta periur-ban development is one of the impacts of urban development. The dynamics also in-dicate the interaction between urban and periurban areas. The dynamic interaction brings about different regional abilities to absorb urban influences and creates a gap of development among Yogyakarta periur-ban areas. The different strength in inter-action among periurban areas also gener-ates different rate of development of ser-vice facilities (Douglass, 1988). The strength in interaction capable of
develop-Table 7. Classification of the Change of Centrality Index of Service Facilities in 1996 and 2006 in Yogyakarta Periurban Areas
Source: Result of Data Processing of Village Potentialities in 1996 and 2006
Centrality Index of Service Facilities Village
1996 2006
Change Scaling Classification
TAMANAN 1.80 2.58 0.78 79.41 Medium
WIROKERTEN 2.68 2.96 0.28 74.91 Medium
POTORONO 2.94 3.10 0.17 73.90 Medium
BATURETNO 3.82 4.43 0.61 77.90 Medium
BANGUNTAPAN 9.58 12.65 3.06 100.00 High
BANGUNHARJO 8.15 9.65 1.50 85.94 High
PANGGUNGHARJO 9.51 10.45 0.94 80.90 Medium
TIRTONIRMOLO 4.77 3.47 -1.31 60.64 Low
NGESTIHARJO 7.75 8.89 1.14 82.71 Medium
BANYURADEN 3.67 3.76 0.08 73.17 Medium
NOGOTIRTO 3.05 2.87 -0.18 70.79 Medium
TRIHANGGO 2.02 2.36 0.34 75.47 Medium
SINDUADI 11.67 12.30 0.63 78.06 Medium
ing service facilities (infrastructure) was possessed by areas along the corridors of Yogyakarta – Solo, Yogyakarta – Semarang, Yogyakarta – Wates, indicated by the emer-gence of various kinds of service facilities.
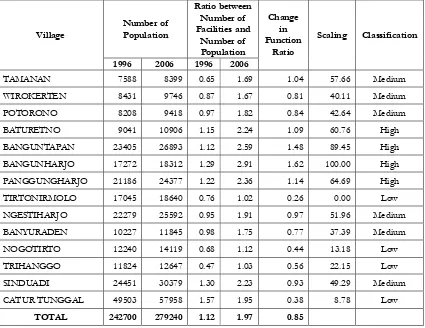
In addition to the increase in num-ber and kind of service facilities. a signifi-cant development could also be observed in the functions of service facilities. The development of function described the serving capacity of the service facilities provided to satisfy people’s needs in the related areas. The analytical result of the function of service facilities is presented in the following table.
The ratio of service function indi-cates the abilities of each service facilities in serving the people in a certain area. The higher ratio figure means the higher serv-ing capacity of the service facilities. To-tally, the change rate of the function ratio in the research areas is 0.85 (Table 8). It means from 1996 to 2006 the change in serving capacity of each service facility had reached 0.85 %. This figure also means that the serving capacity of each kind of ser-vice facility in research area increased by 0.85 % of the number of population in the basic year. In other words, each kind of service facility can serve the growing
num-Number of Population
Ratio between Number of Facilities and
Number of Population Village
1996 2006 1996 2006
Change in Function
Ratio
Scaling Classification
TAMANAN 7588 8399 0.65 1.69 1.04 57.66 Medium
WIROKERTEN 8431 9746 0.87 1.67 0.81 40.11 Medium
POTORONO 8208 9418 0.97 1.82 0.84 42.64 Medium
BATURETNO 9041 10906 1.15 2.24 1.09 60.76 High
BANGUNTAPAN 23405 26893 1.12 2.59 1.48 89.45 High
BANGUNHARJO 17272 18312 1.29 2.91 1.62 100.00 High
PANGGUNGHARJO 21186 24377 1.22 2.36 1.14 64.69 High
TIRTONIRMOLO 17045 18640 0.76 1.02 0.26 0.00 Low
NGESTIHARJO 22279 25592 0.95 1.91 0.97 51.96 Medium
BANYURADEN 10227 11845 0.98 1.75 0.77 37.39 Medium
NOGOTIRTO 12240 14119 0.68 1.12 0.44 13.18 Low
TRIHANGGO 11824 12647 0.47 1.03 0.56 22.15 Low
SINDUADI 24451 30379 1.30 2.23 0.93 49.29 Medium
CATUR TUNGGAL 49503 57958 1.57 1.95 0.38 8.78 Low
TOTAL 242700 279240 1.12 1.97 0.85
Table 8. Classification of Change in the Ratio of Service Facility Function in 1996 and 2006 in Yogyakarta Periurban Areas
ber of population; and the number of served people is 0.85 % of total popula-tion in the basic year.
The change in the ratio of each vil-lage shows no big difference. The biggest difference is found in Bangunharjo village (1.62); and the smallest difference is found in Tirtonirmolo village (0.26). From the classification, four villages, namely Baturetno, Banguntapan, Bangunharjo, and Panggungharjo, underwent a high level of change. This indicates that the highest change in serving capacity is found in the northern, western, and eastern areas. The high level of change is possibly influenced by two primary factors, the increase in num-ber and kind of service facilties and the decrease in the number of population. The
bigger possibility, however, is the increase in number and kind of service facilities.
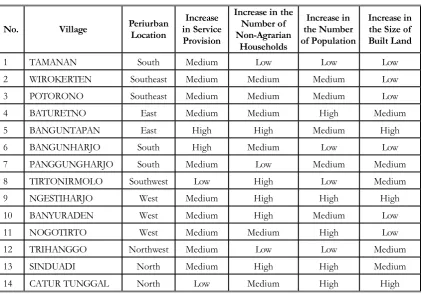
The development of services (infra-structure) in Yogyakarta periurban areas influnced various conditions especially re-lated to the development of urban charac-teristics. In several periurban areas. there is a relationship between the increase in ser-vice provision and the development of ur-ban characteristics. In Sinduadi, Ngestiharjo, Banyuraden, and Banguntapan villages, the increase in service provision brings about the increasing number of non-agrarian house-holds. This indicates that the increase in ser-vice provision especially economic serser-vices in the fourth villages can widen job oppor-tunities especially in trade and service sec-tors. The similar condition can also be
ob-Table 9. Classification of the Increase in Service Provision and Urban Characteristics in Yogyakarta Periurban Areas
Source: Result of Data Processing of Village Potentialities in 1996 and 2006
No. Village Periurban
Location
Increase in Service Provision
Increase in the Number of Non-Agrarian
Households
Increase in the Number of Population
Increase in the Size of Built Land
1 TAMANAN South Medium Low Low Low
2 WIROKERTEN Southeast Medium Medium Medium Low
3 POTORONO Southeast Medium Medium Medium Low
4 BATURETNO East Medium Medium High Medium
5 BANGUNTAPAN East High High Medium High
6 BANGUNHARJO South High Medium Low Low
7 PANGGUNGHARJO South Medium Low Medium Medium
8 TIRTONIRMOLO Southwest Low High Low Medium
9 NGESTIHARJO West Medium High High High
10 BANYURADEN West Medium High Medium Low
11 NOGOTIRTO West Medium Medium High Low
12 TRIHANGGO Northwest Medium Low Low Medium
13 SINDUADI North Medium High High Medium
served in Tirtonirmolo village although the increase in service provision is not as high as that in Banguntapan villages (Table 9).
The increase in service provision can also increase the number of population. Such a condition can be found in Baturetno, Nogotirto, Ngestiharjo, and Sinduadi vil-lages. The development of socioeconomic services in fourth villages can serve as magnetic force to attract people outside the areas to live there. The similar situation can also be found in Nogotirto and Baturetno villages. Besides demographical aspects, the increase in service provision also had an influence on physical aspect of land. Re-lated to urban characteristics, the physical aspect of land refers to the size of built land. In fact, the development of service facilities can increase the size of built land. This condition can be obser ved in Banguntapan and Ngestiharjo villages.
From the above explanation, it can be concluded that the increase in service provi-sion can develop urban characteristics in sev-eral periurban areas although it has no sig-nificant influence on several other periurban areas especially in the southern part.
CONCLUSION AND IMPLICA-TIONS FOR POLICY
Conclusion
1. Spatially, urbanization in Yogyakarta periurban areas tends to move toward the western part (Ngestiharjo village), northern part (Catur Tunggal village), and eastern part (Banguntapan village). Besides centrifugal forces, the develop-ment of built land and urban charac-teristics in the western. northern and eastern parts are also influenced by the main roads (corridors) from Yogyakarta
to Kaliurang, from Yogyakarta to Wates and from Yogyakarta to Solo. The ex-istence of the corridors prompts the functions of trade and services which, in turn, trigger the development of the surrounding housing complex. On the contrary, in the southern and south-east part of Yogyakarta the activities of ser-vice have not yet well-developed and neither have the new housing complex.
2. The development of population num-berand of the development of popula-tion density are variables determining urban development in Yog ykarta periurban areas.
3. The dynamics of land use changes in Yogyakarta periurban areas is desig-nated by the decreasing agricultural land and the increasing built land. The an-nual rate of land conversion from agri-cultural to non-agriagri-cultural in Yogya-karta periurban areas reached 6.46 %. It resulted from the high pressure on agricultural land especially for residen-tial needs.
4. The reduced agricultural land decreased the carrying capacity of agricultural environment. Agricultural production could no longer satisfy periurban people’s needs for food. This condition is represented by the score of carrying capacity of agriculture environment by < 1 in all villages.
and Solo, Yogyakarta and Semarang, and Yogyakarta and Wates. Those three in-teractions generated various service fa-cilities along the corridors.
6. The dynamics in Yogyakarta periurban areas are also designated by the increase in functions or serving capacity of ser-vices. The serving capacity of service facilities in research areas on average increased by 0.85 % of total popula-tion in the basic year.
7. The development of services (infrastruc-ture) in Yogyakarta periurban areas in-fluenced various conditions especially related to the development of urban characteristics. In several periurban ar-eas, there is a relationship between the increase in service provision and the development of urban characteristics.
Implications for Policy
1. It is necessary to plan specific space for periurban areas especially in determin-ing the borders of agricultural land and areas for urban development.
2. The urban planning must be shifted from ‘urban oriented’ to ‘rural-urban oriented’. The ‘rural-urban oriented’ urban planning will incorporate the interests to develop urban functions and to preserve agricul-tural land. The sprawl of urban appear-ance will take the form of ‘dispersed plan’ instead of the round compact form.
3. Agricultural land in Yog yakarta periurban areas should be developed to the southeastern and southern parts. 4. The location of the construction of
facilities and infrastructures should con-sider the subsequent impacts such as the growing number of buildings for housing and business. This is to antici-pate the uncontrolled sprawl of built land that will, in turn, increase the pres-sure on agricultural land.
5. The development of housing complex gives no support to the development of area functions. Therefore, the residen-tial complex must be developed to cer-tain areas in order to optimize the de-velopment of space structure pattern.
6. Urban functions must be evenly distrib-uted to reduce the burden of periurban areas in the northern, eastern, and west-ern parts and to increase the develop-ment of southern periurban areas.
Acknowledgements
REFERENCES
Beny Haryadi. 2005. “Deteksi Kekritisan Lahan dengan Penginderaan Jauh dan Sistem Informasi Geografi (Studi Kasus Lahan Kritis Sub DAS Alang, Wonogiri)”. Forum Geografi, Vol. 19, No. 1, Juli 2005. Hlm. 1-15.
Colby, C.C. 1959. Centrifugal and Centripetal Forces in Urban Geography. In Mayer and Kohn (eds.) : Readings in Urban Geography. University of Chicago. Chicago.
Douglass, M. 1988. Landuse and Environment Sustainability of The Extended Metropolis: Jabotabek and Jabopunjur Corridor. Paper Presented at The Conference on Extended Metropolis In Asia. 19-23 September 1988: EWEAPI.
Garland, A., Massoumi, M., Ruble, B.A.R, and Tulchin, J.S. 2007. Poverty and the Periphery: Cities in Latin America and the Former Soviet Union. Geogetown Journal. Summer/Fall 2007.
Lee, Linda. 1979. Factors Affecting Land Use Change at the Rural Urban Fringe. In Growth and Change : A Jounal of Regional Development. Vol X. October 1979.
McGee, T.G. 1987. Urbanization or Kotadesasi? The Emergence of New Regions of Economic Interaction in Asia. EWC-EAPI. WP-87-8. Honolulu.
McGee, T.G. 1997. The Emergence of Desa-kota Regions in Asia : Expanding a Hypothesis in Norton Ginsburg. Bruse Kopel. T..G. McGee (eds.). The Extended Metropolis and Settlement Transition in Asia. The University of Hawaii Press. Honolulu.
Moh. Gamal Rindarjono. 2007. “Residential Mobility di Pinggiran Kota Semarang Jawa Tengah (Studi Kasus Kaum Miskin Kota di Kota Semarang)”. Forum Geografi, Vol. 21, No. 2, Desember 2007. Hlm. 135-146.
Montgomery, M.R. 2008. The Urban Transformation of the Developing World. Science Journal. Vol. 319 No. 5864.
Sati, V.P. and Manssori, I.K. 2007. Trends of Urbanization in Gwalior Metro – City (India) and Its Environs. Journal of Environmental of Research and Development. Volume 2 No.1. July – September 2007.
Soemarwoto, Otto. 1982. Interelation Among Population. Resources. Environment and Development in ESCAP Region. with Special Reference to Indonesia. Institute of Ecology. Padjajaran University. Bandung.
Yunus, Hadi Sabari. 2000. Struktur Tata Ruang Kota. Pustaka Pelajar. Yogyakarta.