Tracking System of Location and Level Leak of
Distribution Pipe in PDAM Tirta Bumi Serasi
Kabupaten Semarang
Antono Adhi
#, Adi Susanto
+, Santo Priyanto
##
Department of Industrial Engineering
University of Stikubank, Semarang, Jawa Tengah, Indonesia [email protected]; [email protected]
+
Department of Information Management
University of Stikubank, Semarang, Jawa Tengah, Indonesia [email protected]
Abstract — Distribution is an important process in water
consumption from source to the customer in PDAM Tirta Bumi Serasi, Kabupaten Semarang. The water distributed flow thru pipeline network. In any case there are leaks in distribution process. It will increase cost of distribution. PDAM need a tracking system for tracking where the leak are and how much is the level of leak. Leak Tracking Information System (LTIS) is developed to handle this problem. This system will provide information of location and level leak of distribution pipe. Data need for running this system recived from existing data of PDAM, namely master data of pipe and customer, and stand meter data of pipe and customer. LTIS will calculate this data and give information to PDAM. PDAM will take an action if leak of a pipe is more than 20%. This action will reduce loss of water consumption and cost effectively.
Key words – Distribution, leak, leak tracking system.
I. INTRODUCTION
Good distribution, is an attempt to minimize production costs and increase profitability of a company. Unnecessary activities would cause additional expenditure, therefore a company must carry out design of good, proper, and effective distribution. A slightest negligence in this process will deprive an amount of loss. Considering the importance of this process, some companies spend a lot of money to monitor the distribution process. The Company will maintain distribution process if appear a problem to improve the effectiveness of the product flow and quality.
Worldwide the shortage of drinking water is a subject of increasing concern [1]. This is because of the increasing demand for water and decrease in water supplies [1]. A partial solution to this problem can be obtained by controlling the amount of water loss in distribution networks. Water loss mainly occurs due to leakage in distribution networks [1].
Department of Distribution in Perusahaan Daerah Air Minum (PDAM) Tirta Bumi Serasi has task to distribute clean water from water source to the customers. In the distribution process, PDAM Tirta Bumi Serasi always put efficiency and effectiveness of the distribution as a main task. The main problem that occurs in the distribution process is a pipeline
leak. Distribution pipe leaks occur very often and this is very detrimental to PDAM Tirta Bumi Serasi. The leak detection system will help all water utilities, to save water by dramatically improving their effectiveness in locating leaks in all types of pipes [2]. Leak will result loss of revenue. Leaks can occur due to various things. Leak can be caused by damage of the pipe due to the declining quality of the pipes, high pressure that causes damage to the pipe, can also be caused by a theft committed by customers. For it is necessary to find a solution to overcome the problem of leak exactly where the leak and how many losses.
II. SYSTEM ANALYZE
Development in information technology has led to increase in information in organizations and institutes life and movement [3]. Ordinary individuals could not make decisions in reaching their goals, without being influenced by information [4]. An information system includes a set of individuals, data/information, methods, software, hardware and communications which are active in a company to provide useful information to accelerate and ease the activities, create coordination and control, assist with problems analysis, support decision making and reduce uncertainty in decision-making [5].
There are a lot of matter in developing of the system. Especially in relation with the type of pipe and consumer data in PDAM Tirta Bumi Serasi. This research also must consider the process of business. The system is called Leak Tracking Information System (LTIS). LTIS as a Management Information System (MIS) plays a very important role across organizations. In any organization major portion of the time is utilized in data collection, processing, documenting as well as communicating it to the people [6].
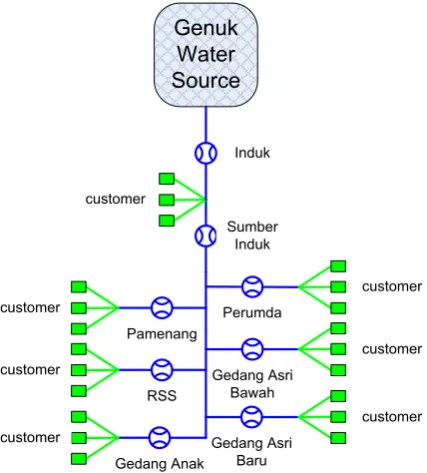
Data of pipe and customer as in Fig. 1, form tree diagram as in Fig. 2. Fig. 1 describes form of the water pipeline network from source to the customers and Fig. 2 describes tree diagram of the water pipeline network. Node-link tree diagrams are employed in many application domains to express hierarchical structures [7]. Besides the easy way to draw them, they have many benefits due to the fact that straight links can readily be tracked by the human eye and, hence, lead to an efficient and reliable interpretability of hierarchical structures and substructures [7].
Genuk
Water
Source
customer
RSS
Perumda
Gedang Asri Baru Gedang Anak
Gedang Asri Bawah
Induk
customer
customer customer customer customer
customer
Pamenang
Sumber Induk
Fig 1. Water pipeline network of Genuk water source.
Water meter of the pipe in the this tree diagram is symbolled by . Based on tree form of the diagram, the data structure and tracking process will refer to this form. It is include status of the pipe as a parent or child from the other pipes.
Sumber Induk
Pamenang Perumda Gdg Asri Bwh Gdg Asri Baru Gdg Anak Induk
RSS
Fig 2. Tree form of water pipeline network.
For avoiding redundancy of data, LTIS try to use data of stand meter, both of pipe and customer, from PDAM Tirta Bumi Serasi. Fortunately, existing system of PDAM that handle customer water distribution, provides data in Microsoft
Excel platform. Therefore, LTIS must has capability in importing data from Microsoft Excel platform.
For tracking of the location and leaks level, the system will be developed refer to the tree diagram. But not all of the searching method used, system also accommodate searching by query to the database.
III. SYSTEM DESIGN
System will be designed before developed. The purpose of designing is to direct development process efficiently and effectively. Design will be created in Data Flow Diagram (DFD) and Entity Relationship Diagram (ERD).
DFD has been chosen because it is an approach for specifying, constructing and visualizing the model of a system graphically and has been in practical used on a very wide basis [8]. DFD describes whole of the system. It describe relation between external entity and the system, and between process and process, also process and data store, according to the flow of the data. The level 0 of DFD is called Context Diagram, describes main relation between system and the external, as in Fig. 3.
locat ion and lev el of leaked pipe month f or track ing leaks
month f or pipe meter month f or customer meter
pipe stand meter cust omer stand meter
pipe cust omer
0
Leak Trac king Inf ormation Sy stem
+ PDAM
Fig 3. Context Diagram of the LTIS.
The Context Diagram shows that LTIS has relation with one external entity that is PDAM. System receives data master of pipes and customers. System also receives data of stand meter monthly, both customers and pipes, from PDAM. For tracking leaks, PDAM send month where the leaks will be tracked. System will process and then send information of locations and level of leaked pipe.
Detail of Context Diagram will describe features or functions of LTIS. There are five functions as shown in Fig. 4. Functions provided in the system is importing master data of customers, entry pipe data, importing stand meter data of customers, entry pipe stand meter, and tracking leaks.
data that connect customer to the pipeline, therefore importing month f or track ing leaks
pipe stand meter
month f or customer meter
month f or pipe meter
Fig 4. Functions of the LTIS.
Existing system from PDAM also does not provide data meter of pipe. It is recorded manually in a book. LTIS provide entry data function for the stand meter of pipe. Stand meter data of customer measures water consumption of customer. Data is provided from existing system and can be downloaded in Microsoft Excel platform. According to the manual recording of stand meter data from pipeline, LTIS provides data entry for the stand meter.
In the tracking leak process, it is started by getting month measurement, as shown in Fig. 5. Fig. 5 is DFD level 2 that detail tracking leak process. Process continued with getting customer stand meter and recapitulating it to the parent pipe of customer. Pipe stand meter is recapitulated to its parent, level by level, started from lower level. Water consumption of customer is also recapitulated to the higher level of parent pipe. The differences between stand meter data of pipe and its child indicates there is a leak between the parent pipe and child pipe. Information also support leak from the pipe until the water consumed by customer. Those information of location and level leak of the pipe will be sent to the PDAM. PDAM will take an action if the leak is more than 20%.
The data structure is designed in Entity Relationship Diagram (ERD). The ERD has been widely used in structured analysis and conceptual modelling [9]. The ERD approach is easy to understand, powerful to model real-world problems and readily translated into a database schema [9]. It is designed in conceptual model as shown in Fig. 6, and in physical model as shown in Fig.7.
Data structure design will create tables in the database of LTIS. There are 4 tables needed in the data structure. Pipe, Customer, PipeStandMeter, and CustomerStandMeter.
Table Pipe contains pipes, which is characterized by meter number that record in column MeterNum. The attribute to describes information of the pipe is recorded in field Location. Field MeterPrn is used for developing tree diagram of pipeline
network. It contain which source pipe that distribute water to the pipe. Parent pipe is recorded in this table too. Field PipeLevel is used to mark level of the pipe in tree diagram. It is useful for recapitulating stand meter data from child to parent pipe. Calculation of recapitulation is started from lowest level (with biggest number) to the top of level. Field PipeCode is useful for sorting and searching the data. From this field, data of parent, and grand parent pipe can be traced. It is only used to help the tracking process but never appeared for the user. month f or track ing leaks
PDAM
Fig 5. Data Flow Diagram level 2 of tracking leak process.
Cus tomer
Fig 6. Conceptual model of data structure.
pipe can be deleted but it doesn’t have delete the customer data. Therefore data of MeterNum can be value null.
CUSTOMER CONNNUM METERNUM NAME ADDRESS PIPE
METERNUM LOCATION METERPRN PIPELEVEL PIPECODE
PIPESTANDMETER MONTHM ETER METERNUM STANDM ETER CONSUMPTION REALCONSUMPTION TOTALCONSUM PTION
CUSTOMERSTANDMETER MONTHM ETER
CONNNUM STANDM ETER CONSUMPTION
Fig 7. Physical model of data structure.
Table PipeStandMeter record stand meter data of a pipe. It has relationship with table pipe for getting meter number of the pipe. The other primary key for the table is field MonthMeter. This field is used for recording which month is the stand meter data, while stand meter data of the month is recorded in field StandMeter. In tracking process, difference between stand meter data in difference month is recorded in field Consumption. Field RealConsumption records recapitulation of stand meter data from all of the child pipe. Field TotalConsumption record total of water consumed by the customer that distributed from the pipe.
Table CustomerStandMeter record stand meter data of the water flow consumed by the consumer. The primary key of this table is ConnNum that indicates which customer, and MonthMeter that indicates which month is stand meter data recorded. Field ConnNum is received from relation with table Customer. This relationship is one to many and dependent. Therefore field ConnNum become primary key in table CustomerStandMeter. Stand meter data is recorded in field StandMeter. Field Consumption records difference of stand meter data from one month before data.
IV. APPLICATION DEVELOPMENT
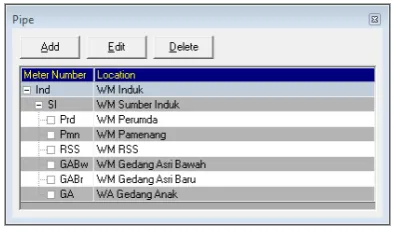
Provided menu in LTIS is used to entry master data of customer and pipe, entry stand meter data of customer and pipe, and menu for tracking leak. Dialog for pipe data entry is shown as in Fig. 8. Dialog of pipe data entry shown as a tree. Data entry of a pipe done one by one through this dialog because there is no pipe data from the existing system in PDAM can be imported. Adding of new data will request location and parent pipe. If the pipe water meter is as water
source, it doesn’t have parent pipe. Just fill the parent pipe
with blank data. Editing process is only for changing the location of the pipe meter. If there is mistake while create of place the pipe from the parent, unfortunately it has to be deleted. Delete a pipe will delete all of child pipe from the deleted pipe.
Fig 8. Dialog of master pipe.
Dialog for managing master customer shown as in Fig. 9. Entry data of customer can be done simultaneously by importing data from existing system of PDAM. Data is in Microsoft Excel platform. In importing process, existing data can be replaced by new data. LTIS also provide setting parent pipe of customer one by one. This dialog is filtered by pipe meter or shown all by emptying the pipe meter filter.
Fig 9. Dialog of master customer.
Dialog for entering stand meter data of pipe water meter shown as in Fig. 10. Before entry data, filter of month has to be set. Default of the month is now. Data meter is entered by updating column StandMeter in the data grid. Automatically column Consumption will be calculated and shown by reducing the StandMeter data with data in one month before.
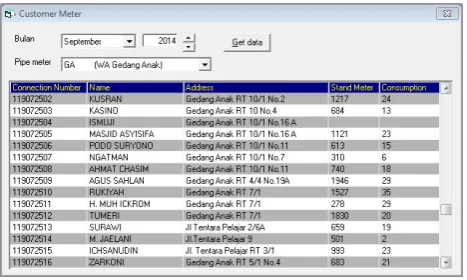
Dialog for entering customer meter data shown as in Fig. 11. Entering data process done by importing data from existing system of PDAM. Before importing process, month of stand meter has to be set first. This dialog also has pipe meter filter as parent pipe of customer.
Fig 11. Dialog of customer stand meter.
The prime dialog is dialog for tracking leaks as shown in Fig. 12. Before process the tracking, month of stand meter data has to be set first. Leak data shows water distribution loss in meter cubic. PDAM determine tolerance value 20% for leaking that has to be concerned.
There are two leak data shown in this dialog, leak and total leak. Leak data is calculated from differences with the direct child pipe, and total leak is calculated from water consumed by customer.
Fig 12. Dialog of tracking leaks.
V. CONCLUSIONS
Leak Tracking Information System (LTIS) provide function to track location and level leak of pipeline in a distribution network. The tracking leaks process depend on existing system of PDAM Tirta Bumi Serasi. Data is received by entering or importing. Data used in LTIS is master data of pipe and customer, also stand meter of pipe and customer. The quality of data from existing system is not perfect. Some data are missing and not recorded well. It will influence quality of tracking process.
Difference between two months stand meter data indicates leak of the pipeline. Leak data indicates there is a leaking in pipeline between two water meter. It is the location of leaking. And the value of leak show how much water loss in the
distribution. Total leak data indicates loss of water consumed by consumer. If this data shown, it mean that leak value is more than 20%, PDAM must take an action to handle this leak. The application of LTIS help PDAM Tirta Bumi Serasi, Kabupaten Semarang, handling loss of cost by giving information of leak pipe.
ACKNOWLEDGMENT
The authors would like to acknowledge help and assistance from PDAM Tirta Bumi Serasi, Kabupaten Semarang, and the staf.
REFERENCES
[1] Pal, Maninder, Dixon, Neil, and Flint, James, “Detecting & Locating Leaks in Water Distribution Polyethylene Pipes”, Proceedings of the World Congress on Engineering 2010 Vol II WCE 2010, June 30-July 2, 2010, London, U.K.
[2] Hunaidi, Osama, and Wang, Alex, “A New System for Locating Leaks in Urban Water Distribution Pipes”, Management of Environmental Quality: An International Journal, vol. 17, no. 4, pp. 450-466, 2006. [3] Jahromi, Shohrehosadat Karimi, and Manteghi , Nikzad, ”Designing
Financial Information System Using Structured System Analysis and Design Method”, International journal of Computer Networking and Communication (IJCNAC), Vol. 1, No. 2, pp. 11-19, November 2013. [4] Papatsoutsos, Dimitrios,“Information Systems Development
Methodologies in the Age of Digital Economy”, University of Athens Department of Informatics University Campus TYPA Buildings, 2005. [5] Ed o’Donnel, Julie Smith David, “How Information Systems Influence
User Decisions: A 5-Research Framework and Literature Review”, International Journal of Accounting Information systems, 1, pp 178-203, 2000.
[6] Bhutia, Chowang Dolma, Shilpa, R.G., and Sharma, Pankaj, “Development of Business Information System for an Aerospace Company”, SASTECH, Volume 10, Issue 2, Sep 2011.
[7] Burch, Michael, and Heinrich, Julian, “Evaluation of Traditional, Orthogonal, and Radial Tree Diagrams by an Eye Tracking Study” VISUS, University of Stuttgart, 2011.
[8] Ibrahim, Rosziati, and Yen, Siow Yen, “A Formal Model for Data Flow Diagram Rules”, ARPN Journal of Systems and Software, Volume 1 No. 2, pp. 60-69, May 2011.