ISSN 2249-6343
International Journal of Computer Technology and Electronics Engineering (IJCTEE) Volume 1, Issue 3
Abstract— This paper proposes a novel feature extraction method for unsupervised multispectral image segmentation by pruning the two dimensional texture feature named combine neighborhood differences. In contrast with the original CND, which is applied with traditional image, the pruned CND is computed on a single pixel with various bands. The proposed algorithm utilizes the sign of differences between bands of the pixel. The difference values are thresholded to form a binary codeword. A binomial factor is assigned to the codeword to form another unique value. These values are then grouped to construct the multiband CND feature image where is used in the unsupervised segmentation. Experimental results, with respect to segmentation and classification accuracy using two LANDSAT multispectral images test suite have been performed. The result shows that the pruned CND feature outperforms spectral feature, with average classification accuracies of 87.55% whereas that of spectral feature is 55.81%.
Index Terms—unsupervised segmentation, multispectral image, remote sensing, combined neighborhood differences.
I. INTRODUCTION
Segmentation is a process of partitioning an image space into some nonoverlapping meaningful homogeneous regions [1]. Multispectral image segmentation is one of the important approaches of information extraction. The success of object-based image analysis is very dependent on the quality of the image segmentation results as input. However, multispectral images contain more information than single-band (gray) images. Usually, multispectral image has three to seven bands. If the extra information can be utilized efficiently, it can lead to more accurate image segmentation and classification result. On the other hand, mishandling of this extra band information can lead to low performance of image segmentation.
Manuscript received Oct 15, 2011.
Khairul Muzzammil Saipullah, Faculty of Engineering and Computer
Engineering, Universiti Teknikal Malaysia Melaka., (e-mail:
[email protected]). Melaka, Malaysia,
Nurul Atiqah Ismail, Faculty of Electronic and Computer Engineering, Universiti Teknikal Malaysia Melaka, Melaka, Malaysia, (e-mail: [email protected]).
Deok-Hwan Kim, Dept. of Electronic Engineering, Inha Universiti, Nam-gu Incheon, Korea, (e-mail: [email protected]).
Two popular approaches for remote sensing image segmentation are gray value thresholding and pixel classification. In image thresholding [2], a set of thresholds T is searched so that all pixels with gray values in range
1
[ ,
T T
i i)
constitute the ith region type. In the pixel classification, homogeneous regions are determined by clustering the feature space of multiple image bands. Both thresholding and pixel classification methods can be either local or global. Because each pixel in multispectral image is represent by a set of values (pixel values in each band), pixel classification-based segmentation is frequently applied.Pixel classification-based segmentation can be divided into two approached which are histogram-based and cluster based approaches which are based on the spectral feature space [3]. The histogram-based methods assume that homogeneous regions in the image correspond to modes of image histogram. Cluster-based segmentation methods assume that interesting structures in the image form clusters in the band domain. The basic idea behind histogram and cluster-based segmentation is that image pixels are processed as general data samples in the feature space.
The performance of cluster-based segmentation method is depending on the feature of each pixel. Standard cluster-based method for multispectral image applies the spectral information as the feature of each pixel. However this information is not enough and often leads to misclassification. In order to increase the feature information, extra information needs to be extracted from the spectral.
In this paper, we propose a novel feature extraction of spectral information based on Combined Neighborhood Differences (CND) texture feature [4]. CND is based on the local neighborhood difference in an image and uses 2D image space in its construction. A new algorithm is presented by pruning the CND so that it can process a 1D data, as in the spectral.
The remainder of this paper is organized as follows: in Section 2, related work is presented; in Section 3, detailed algorithm to implement the pruned CND in multispectral image segmentation is presented; experimental evaluations are described in Section 4 and finally conclusions and future works are given in Section 5.
The Pruning of Combined Neighborhood
Differences Texture Descriptor for Multispectral
Image Segmentation
A.Combined Neighborhood Difference
The texture descriptor CND is based on the combination of difference values used in local binary patterns (LBP) [9] and local neighbor difference (LND) [10], namely the centralized neighborhood differences and the surrounding neighborhood differences. By comparing the entropy and the feature vectors, the thresholding of LND and LBP difference values generated more discriminative information compared to that of the phase. Because of that, the thresholding is using of the difference values to combine the difference values of LND and LBP.
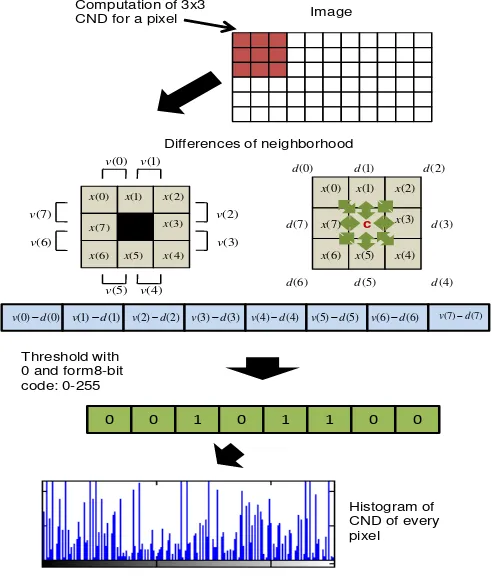
The detail algorithm of CND is shown in Fig. 1. For each 3x3 window of an image, two neighborhood differences which are the centralizedd v (n) and surrounding neighborhood d (n) differences are calculated. v(n) and d(n) can be calculated using the following formula:
9 mod
,
0,1,....,
1
v n
x n
x
n
N
n
N
(1)
,
0,1,...,
1
d n
c
x n n
N
(2)
where N is the number of neighbors which is eight for 3x3 neighborhood and c is the center pixel of the window. Then the differences between v(n) and d(n) are thresholded against zero in order to converted the difference values into binary codewords, given by
1,
0
0,
if v n
d n
p n
otherwise
(3)The next step is to create a unique value from the binary codewords by assigning binomial factor of 2 for each p(n) and it can be calculated using the following formula:
1 02
N k kCND
p k
(4) Based on (4), this CND is a decimal value between 0 and 255 resulting from the 8-bit binary code. Next, a histogram is constructed with 256 dimensions using the CND codes and the histogram denotes the distribution. Finally, the texture descriptor is obtained from the histogram. A statistical approach using the distribution of the feature values is known to work well for micro-textures [5][11].
The starting point of d(n) and pixel gap of v(n) play an important role in generating informative texture feature of CND. It is because, the wrong location of starting point and pixel gap will result in the same information retrieved by LBP or LND.
as the pixel gap of v(n) is because they generated highest histogram entropy based on the evaluation on Brodatz texture database [12]. The entropy of a histogram can be calculated using the following formula:
1 0log
D i iEntropy
p
pi
(5)
where D is the histogram dimension and
p
i is the probability for each bin of the histogram.Image Computation of 3x3
CND for a pixel
Histogram of CND of every pixel Differences of neighborhood
Threshold with 0 and form8-bit code: 0-255
(0) (0)
v d v(1)d(1) v(2)d(2) v(3)d(3) v(4)d(4) v(5)d(5) v(6)d(6) v(7)d(7)
0 0 1 0 1 1 0 0
(0)
d d(1) d(2)
(3) d (4) d (5) d (6) d (7) d c (0) x (7) x (2) x (4) x (3) x (6)
x x(5) (1) x (6) v (7) v (0)
v v(1)
(2) v (3) v (4) v (5) v (0) x (7) x (2) x (4) x (3) x (6)
x x(5) (1)
x
Fig. 1. The CND algorithm
The extremely simple computations for constructing the CND make it very fast in extracting image feature. The performance of CND is also better than similar local texture descriptor such as LBP and LND.
III. PROPOSED METHOD
ISSN 2249-6343
International Journal of Computer Technology and Electronics Engineering (IJCTEE) Volume 1, Issue 3
F(x,y,1) F(x,y,n)
F(x,y,2)
f (1) f (2) f (n)
1D CND feature image F(x,y,i)
p(1 ) p(2 ) p(3 )
. . . .
p(n)1D data of each pixel on each channel
v(1,1) v(1,2) v(1,n-1)
….
x(1,1) x(1,2) x(1,3) x(1,n-1)
d(1,1)d(1,2)d(1,3) d(1,n-1)
(1) c
….
Ch1 (x,y) Ch n(x,y)
Ch 2 (x,y)
Multispectral image
Break into center and neighborhood
value
….
Calculate differences
Threshold with 0 and form (n-1) bit code
0 0 1
…
0….
….
(1)
f
f
(2)
f
(3)
f n
( )
Assigned binomial factor to
binary code: 0~H^n Save f(n)
to feature space
…
(1,1) (1,1)
v d v(1, 2)d(1, 2) v(1,3)d(1,3) v(1,n 1) d(1,n1)
d(n,1) d(n,2) d(n,3) d(n,n-1)
( ) c n
0 0 1
…
0 0 and form n-bit Threshold with codev(n,1) v(n,2) v(n,n-1)
….
x(n,1) x(n,2) x(n,3) x(n,n-1)
…
( ,1) ( ,1)
v n d n v n( , 2)d n( , 2) v n( ,3)d n( ,3) v n n( , 1) d n n( , 1)
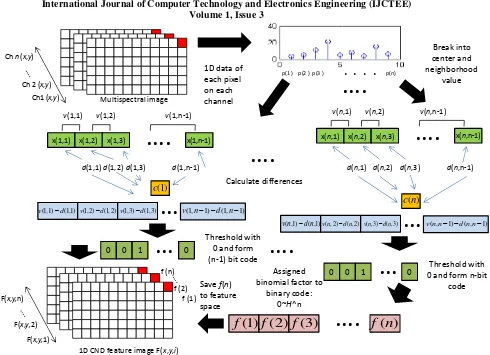
Fig.2.The pruned CND algorithm for multispectral image
Each pixels of a multispectral image contains several values depending on the number of the band. To increase the feature information, the CND feature is pruned and applied to each band for each pixel. The main goal of this feature extraction is to create a feature image Ch(x,y,i) from a multispectral image F(x,y,i). This can be done by applying the pruned CND algorithm to the 1D signal that gathered from each pixel (x,y) on every band i. The algorithm to prune CND is shown in Fig. 2. First, the pixel value from each band/channel of the multispectral image is gathered to form a 1D data p(i), i=1, 2,…, n where n is the number of band in the multispectral image. Then, p(i) in divided into the center group c(i), i=1, 2,…, n and the neighborhood group x(i,b), i=1, 2, …, n, b=1, 2,…, n-1 as follows:
( )
( )
1, 2,...,
,
( , )
1 mod
1
1, 2,...,
1
c i
p i
i
n
x i b
p i b
n
b
n
(6)
From the formula we can see that the size of c(i) is 1 by n whereas the size of x(i,b) is n by n-1. Same as the original CND algorithm, the centralized difference d(i,b) and neighboring difference v(i,b) are calculated using the following formula:
( , ) ( ) ( , ),
( , ) ( , ) , 1 mod 1 ,
1, 2,..., , 1, 2,..., 1
d i b c i x i b
v i b x i b x i b n n
i n b n
(7)
Then the differences between d(i,b) and v(i,b) is calculated and the values are thresholded against 0 as follows:
1, if ( , ) ( , ) 0
( , ) ,
0, otherwise 1, 2,..., , 1, 2,..., 1
v i b d i b T i b
i n b n
(8)
T(i,b) can be seen as an 2D array of binary code. By handling each row in T(i,b) as a n-1 bit of binary codeword, it is possible to transform (8) into a unique 1D CND number for each band. It is done by assigning a binomial factor H for each T(i,b), given by
1
1 1
( )
( , )
,
1, 2,...,
n
b
b
f i
T i b H
i
n
(9)
original CND. In other word, the pruned CND can also be called as 1D CND. The original CND converts an image to a feature image whereas the pruned CND converts a 1D discrete signal into another 1D feature signal. If we see each pixel from each in a multispectral image as a 1D signal, the pruned CND can be applied to each of the 1D signals thus will result in a multispectral feature image F(x,y,i).
F(x,y,i) is then used as the feature in the segmentation of the multispectral image. In the feature image F(x,y,i), each pixels have a set of 1D CND values. The number of 1D CND code each pixel has is the same as the number of band H in the multispectral image.
B.The Segmentation
The K-Means algorithm [8] is used as the clustering method in the unsupervised segmentation of the multispectral image. K-Means algorithm classifies the input data points into multiple classes based on their inherent distance from each other. The algorithm assumes that the data features form a vector space and tries to find natural clustering in them. Given a set of points x=(
x x
1,
2,...,
x
d), where each point is a n-dimensional real vector. The points are clustered around centroids
i
i
1,...,
k
which are obtained by minimizing the within-cluster sum of squares
2 1 j ik
j i
i x S
V
x
(10)where there are k clusters,
S
i, i=1,2, …, k and
i is thecentroids or mean point of all of the points
x
j
S
i.To segment the multispectral image, pixels values in F(x,y,i) feature image are grouped into a group of points
x=(
x x
1,
2,...,
x
d), where each 1D CND values of each pixelin F(x,y,i) is assigned as the n-dimensional vector of the points.
IV. EXPERIMENTAL RESULTS
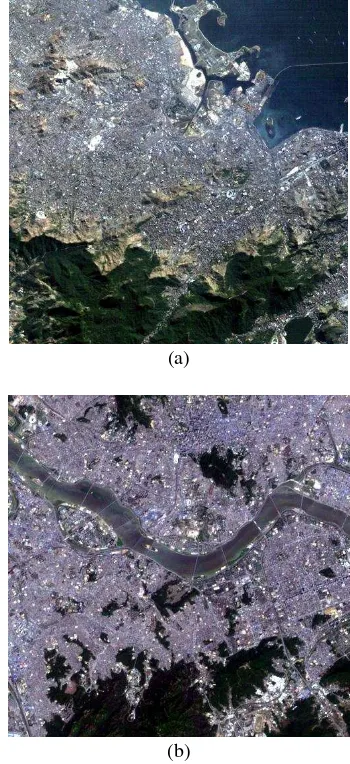
For evaluate the performance of the pruned CND in segmentation of multispectral images, the classification and segmentation of two LANDSAT 7 multispectral images of Rio Janeiro and a partial of Seoul have been conducted. The images of Rio Janeiro and Seoul in the RGB band can be seen in Fig. 3. We can judge the segmentation performance by scrutinizing the clarity of the segmentation result. The precision of the segmentation also can be assessed using classification accuracy which can be calculated as follows:
no. of correctly classified pixels accuracy(%)
no. of pixels in each class
(11)
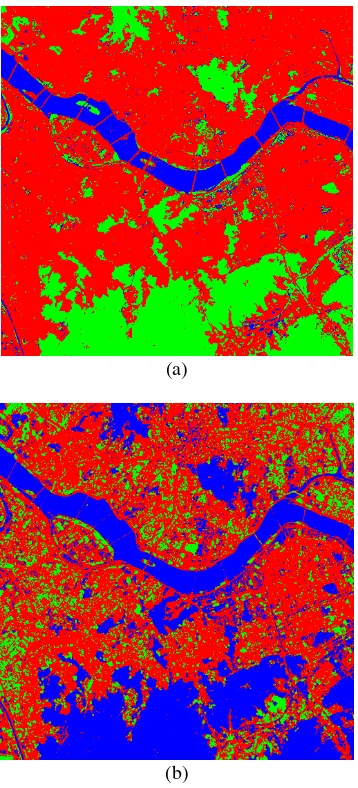
Seoul image contains six bands. The binomial factor H assigned for Rio Janeiro image is 2 while for Seoul image is 3. The pixels are grouped into a set of points in order to perform the K-mean clustering with Euclidean distance. The pixels in the image are clustered into three main classes (K=3) namely, water, build-up and vegetation. The segmentation performance using pruned CND feature is compared with that of segmentation using spectral feature. The results of the segmentation of Rio Janeiro multispectral image using the pruned CND feature and spectral feature are showed in Fig. 5, while the segmentation of Seoul multispectral image using the pruned CND feature and spectral feature are showed in Fig. 6. The classification accuracy result can be seen in Table I.
(a)
(b)
Fig. 3. Rio Janeiro (a) and Seoul (b) images in RGB bands
ISSN 2249-6343
International Journal of Computer Technology and Electronics Engineering (IJCTEE) Volume 1, Issue 3
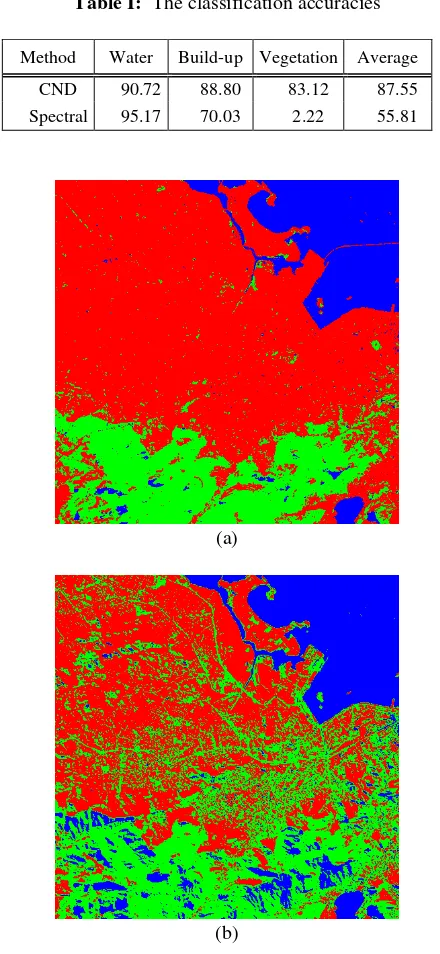
From the result, we can see that the segmentation using spectral feature misclassified these two areas. On the contrary, the pruned CND manages to classify these two areas almost perfectly. From the classification accuracy results, we can see that the pruned CND perform consistently in the classification with average accuracy of 87.55%. The classification accuracy using spectral feature is unstable since a lot of vegetation areas are misclassified as water areas. This misclassification causes low average classification accuracy, which is 55.81%.
Table I: The classification accuracies
Method Water Build-up Vegetation Average
CND 90.72 88.80 83.12 87.55
Spectral 95.17 70.03 2.22 55.81
(a)
(b)
Fig.4. The segmentation result of Rio Janeiro images using (a) pruned CND and (b) spectral feature.
V.CONCLUSION AND FEATURE WORKS
In this paper, we propose a novel feature extraction method for multispectral image based on the CND called the pruned CND or the 1D CND. The pruned CND is calculated on single pixel with various bands. The result of segmentation using CND feature shows excellent result compare to those of using spectral feature. The pruned CND feature also achieves high segmentation accuracy compared to those of spectral feature. For the future works, we would like to implement the CND algorithm (the pruned CND or the original CND) in the hyperspectral image analysis. Hyperspectral image contains more than 200 dimensions, and the feature extraction of extremely high dimensional image is not an easy task. A new CND algorithm will be formed to extract the feature and reduce the dimensions of this high dimensional image.
ACKNOWLEDGMENT
This manuscript is supported Universiti Teknikal Malaysia Melaka under the contract PJP/2011/FKEKK(44B)/S00979, in part by the Defense Acquisition Program Administration and Agency for Defense Development, Korea, through the Image Research Center at Korea Advanced Institute of Science and Technology under the contract UD100006CD and in part by the Ministry of Knowledge Economy(MKE) and Korea Institute for Advancement in Technology (KIAT) through the Workforce Development Program in Strategic Technology.
REFERENCES
[1] Pal, S.K.; Mitra, P., “Multispectral image segmentation using the rough-set-initialized EM algorithm”, IEEE Trans.on Geosci. and Rem. Sens., 40(11), pp. 2495- 2501, 2002.
[2] S. K. Pal, A. Ghosh, and B. U. Shankar, “Segmentation of remotely sensed images with fuzzy thresholding, and quantitative evaluation,” Int. J. Remote Sens., Vol. 21, No. 11, pp. 2269–2300, 2000. [3] Pavel Paclik, Robert P W. Duin, Geert M. P. Van Kernpen,
“Multi-Spectral Image Segmentation Algorithm Combining Spatial and Spectral Information”, Proc. SCIA Conf. pp. 230–235, 2001 [4] Khairul Muzzammil, Shao-hu Peng, and Deok-Hwan Kim, “Texture
Descriptor for Texture-Based Image Retrieval and Its Application in Computer-Aided Diagnosis System”, Journal of the Institute of the Electronics Engineers of Korea, 47-CI(.4), July, 2010.
[5] Timo Ojala, Matti Pietikainen and David Harwood, “A Comparative Study of Texture Measures With Classification Based on Feature Distributions”, Pat. Recog., pp. 51-59, 1996.
[6] Khairul Muzzammil, Shao-hu Peng, Min-Wook Park and Deok-Hwan Kim, “Texture Classification Using Local Neighbor Differences”, Proc. KIPS Spring Conf., 2010.
[7] R.A. Schowengerdt, Remote Sensing: Models and Methods for Image Processing. CA: Academic, 1997.
[8] Lloyd, S. P., "Least squares quantization in PCM", IEEE Trans. on Info.Theory 28(2), pp. 129–137, 1982.
[9] P T. Ojala, M. Pietikainen, and T. Maenpaa, Multiresolution Gray-Scale and Rotation Invariant Texture Classification with Local Binary Patterns, IEEE Transactions on Pattern Analysis and Machine Intelligence, volume. 24, No. 7, pages 971–987, (2002)
[10] Khairul Muzzammil, Shao-hu Peng, Min-Wook Park and Deok-Hwan Kim, “Texture Classification Using Local Neighboring Differences”, Proc. KIPS Spring Conf., 2010.
[11] Haralick R, “Statistical and structural approaches to texture”, Proc. IEEE, vol. 67, no. 5, pp. 786-804., 1979.
Electronics Engineering from Inha University, South Korea. He is currently working as lecturer at Universiti Teknikal Malaysia Melaka. His research interests are in the area of Real-Time Image Processing for Embedded Device, Texture Image Analysis, Medical Image Processing, Computer Vision, and Embedded System.
Nurul Atiqah Ismail was born in 1987 in Pahang, Malaysia anddid
Bachelor of Electronics Engineering & Computer Engineering from Universiti Teknikal Malaysia Melaka in year 2011. She is currently pursuing her Master in Electronics Engineering at Universiti Teknikal Malaysia Melaka. Her research interests are in Image Processing and Embedded System.
Deok-Hwan Kim was born in Republic of Korea in 1964. He received
M.S. and Ph.D. from Korea Advanced Institute of Science and Technology. He is an associate professor of Inha University in Korea. His research interest includes embedded systems, image processing, multimedia information.
(a)
(b)