DOI: 10.12928/TELKOMNIKA.v11i4.1404 775
Feature Extraction of Composite Damage on Acoustic
Emission Signals
Han Wen Qin*1, Zhou Jin Yu2
Department of Material Engineering, Jiangsu University of Technology No.1801,ZhongWu Avenue,ChangZhou, JiangSu Province, China
*Corresponding author, e-mails: [email protected], [email protected], Ph:+86-519-86953289
Abstrak
Tujuan dari penelitian ini adalah untuk mengembangkan metode yang efisien untuk membedakan mekanisme kerusakan yang berbeda dari komposit. Untuk tujuan ini, integrasi metode dekomposisi empiris (EMD) dan transformasi Hilbert-Huang (HHT) diaplikasikan untuk mendefinisikan deskriptor waktu-frekuensi yang lebih relevan. Sebuah metodologi yang lengkap untuk pasca pengolahan gelombang emisi akustik (AE) terekam selama uji tarik kuasi-statis material komposit serat karbon yang dibuat pada pekerjaan ini. Sinyal AE didekomposisi menjadi beberapa komponen IMF melalui algoritma EMD. EMD ini dapat melepaskan dan mengekstrak semua mode kerusakan yang berisi sinyal AE. HHT menyediakan frekuensi seketika dalam skala-waktu sinyal AE, yang dapat digunakan sebagai deskriptor waktu-frekuensi baru dari mode kerusakan komposit.
Kata kunci: komposit, emisi akustik, HHT, pengolahan sinyal, identifikasi kerusakan
Abstract
The aim of this study was to develop efficient methods to discriminate different damage mechanisms of composite. For this purpose, integration of Empirical Mode Decomposition (EMD) method and Hilbert-Huang Transform (HHT) was applied to define more relevant time-frequency descriptors. A complete methodology for the post-processing of the acoustic emission (AE) waveforms recorded during the quasi-static tension test of carbon fiber twill weave composite material was established in this work. AE signal is decomposed into several IMF components by means of EMD algorithm. The EMD can detach and extract all damage modes which consist in an AE signal. The HHT provide instantaneous frequencies in time-scale of an AE signal, which can be used as a new time-frequency descriptors of composite damage modes.
Keywords:composite, acoustic emission, HHT, signal processing, damage identification
1. Introduction
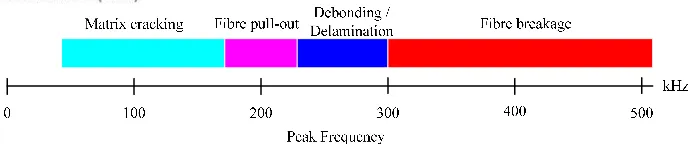
Composite structures integrity is sensible to service life. Their application in the aeronautical and space engineering implies the necessity to insure their integrity through nondestructive evaluations. Among the different non-destructive techniques, acoustic emission (AE) was chosen for its ability to detect progressive defects during in-service life of structures. AE phenomenon is the result of transient elastic wave generated by a rapid release of energy within a material because of changes in local stress and strain fields. AE signals mostly originate from various sources, such as matrix cracking, fiber breakage, delamination, and debonding on composite structures [1]. Hence, discrimination of AE signals corresponding to different failure mechanisms is of great importance in the use of AE technique.
Figure 1 Typical AE waveform with basic parameters
Figure 2. Frequency ranges defined in [5]
2. Experiment procedure
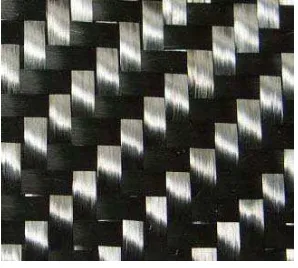
The experimental raw material is T300 carbon fiber twill weave and epoxy resin, the mesostructure of carbon fiber twill weave is as shown in Figure 3. A 300mm×300mm×3.5mm CFRP composite laminate is fabricated with 10 layers by vacuum bag molding process, tensile specimens of size 250mm×25mm×3.5mm were cut from the fabricated laminate according to GB/T1447-2005 standards.
Tensile tests were performed in a universal test machine at the cross-head speed of 1 mm/min. A broadband, resonant-type, single-crystal piezoelectric transducer manufactured by Physical Acoustic Corporation (PAC) with operating range of frequencies between 10 and 1000 kHz was used as the AE sensor. For the purpose of good acoustic coupling between the sensor and the specimens, grease was used for covering the surface of the sensor. The threshold value of 40 dB could filter the noise of ambient and the test device very well. AE signals were monitored by two sensors (S1,S2) which were placed in a linear configuration located at a distance of 100 mm, as shown in Figure 4.
3. EMD and HHT
[image:2.595.125.473.376.448.2]
Figure 3. Carbon fiber twill weave Figure 4. Shematic of experimental set-up
3.1 Fundamental principles of EMD
The empirical mode decomposition (EMD) is based on the direct extraction of the energy associated with various intrinsic time scales to generate a collection of intrinsic mode functions (IMF)[13,14]. Each IMF allows a well-behaved Hilbert transform, from which the instantaneous frequency can be calculated. It is based on the sequential extraction of energy associated with various intrinsic time scales of the signal starting from high frequency modes to low frequency modes, which exhibits the excellent ability of nonlinear and non-stationary time series analysis and processing.
An IMF represents a simple oscillatory mode compared with the simple harmonic function.With the definition, any signal
x t
can be decomposed as follows:(1) Find the positions and amplitudes of all local maxima, and all local minima, in the input signal
x t
,then an upper envelope is created by cubic spline interpolation of the localmaxima, and a lower envelope by cubic spline interpolation of the local minima. The mean of the upper and lower envelopes is defined as
m t
1
. The difference between the signal
x t
andm t
1
is the first component,h t
1
1 1
h t
x t
m t
(1)Ideally, if
h t
1
is an IMF, thenh t
1
is the first IMF component ofx t
.(2) If
h t
1
is not an IMF,h t
1
is treated as the original signal and repeat the previousprocess, then
11 1 11
h
t
h t
m
t
(2)Repeat this sifting procedure k times until
h
1k
t
is an IMF; this is designated as thefirst IMF.
1 1k
c t
h
t
(3)(3) Separate
c t
1
fromx t
, we could get
1 1
r t
x t
c t
(4)
1
r t
is treated as the original data and repeat the above processes, the second IMFcomponent
c t
2
ofx t
could be derived. The above process is repeated n times until1
j
Thus, one can achieve a decomposition of the signal into n-empirical modes, and a residue
r t
n
,which is the mean trend ofx t
. The IMFsc c
1,
2,
,
c
n includes differentfrequency bands ranging from high-to-low and is stationary.
3.2 Hilbert spectrum analysis
For given data,
c t
, the Hilbert transform of each IMFc t
i
is defined as
1
ˆ
ii
c
c t
d
t
(7) With this denition,c t
ˆ
i
andc
i
can be combined to form the analytical signalz t
i
,
given by
ˆ
ji ti i i i
z t
c t
jc t
A t e
(8)where time-dependent amplitude
A t
i
and phase
i
t
are found as
2
ˆ
2
i i i
A t
c
t
c t
ˆ
tan
i ii
c t
t
c t
From the polar coordinate expression of Eq.(8), the instantaneous frequency can be defined as
i
i
d
t
t
dt
(9)Applying the Hilbert transform to the n IMF components of
x t
in Eq.(6), the datax t
can bewritten as
1Re
in
j t dt
i n
i
x t
A t e
r t
(10)Eq. (10) is written in terms of amplitude and instantaneous frequency associated with each component as functions of time. The frequency-time distribution of the amplitude is designated as the Hilbert amplitude spectrum,
H
,
t
, or simply Hilbert spectrum, defined as
1,
n i iH
t
A t
(11)Hilbert spectrum described the change rule of the amplitude along with frequency and time.
4. Result and Discussion
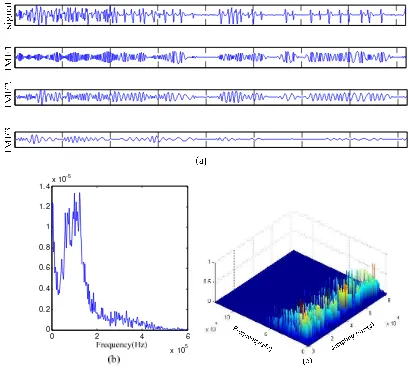
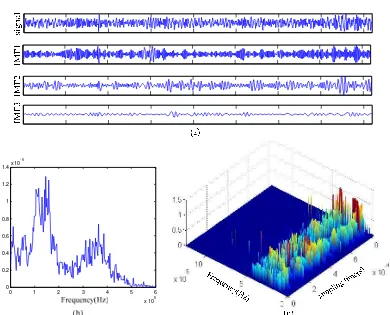
The major failure mechanisms in fibre-reinforced composites are fibre breakage, matrix cracking, fibre–matrix interfacial debonding, delamination and fibre pull-out. Figure 5 shows AE signal of matrix cracking, Figure 5(a) is the waveforms of AE signal and the former 3 IMFs by EMD, it is seen that the dominant frequency range of Hilbert marginal spectrum by HHT is 80-140kHz, the three-dimensional unite time-frequency chart provide instantaneous frequencies in time-scale of an AE signal in Figure 5(c),obviously,frequency range of 80-140kHz is a majority in time-scale. In spite of AE signal is decomposed into several IMFs, the FFT(Fast Fourier Transform) analysis is performed on former 3 IMF waveforms(shown in Figure 6), the dominant frequency range of each IMF is still 80-140kHz approximately, it comes to a conclusion that the frequency feature of this AE signal be supposed to correspond to damage mode of matrix cracking.
0 2 4 6
x 105 0
0.2 0.4 0.6 0.8 1 1.2 1.4x 10
-5
Figure 5. AE signal of matrix cracking:(a) EMD;(b) Hilbert marginal spectrum (c) the three-dimensional unite time-frequency chart of HHT
0 1 2 3 4
x 105 0
20
0 1 2 3 4
x 105 0
5
0 2 4 6
x 105 0
[image:6.595.90.502.91.268.2]0.5 1
Figure 6. FFT of IMFs on AE signal of matrix cracking
0 1 2 3 4 5 6
x 105 0
0.2 0.4 0.6 0.8 1 1.2 1.4x 10
-5
[image:6.595.93.500.314.662.2]
0 1 2 3 4 5 6
x 105 0
0.2 0.4 0.6 0.8 1 1.2 1.4x 10
-5
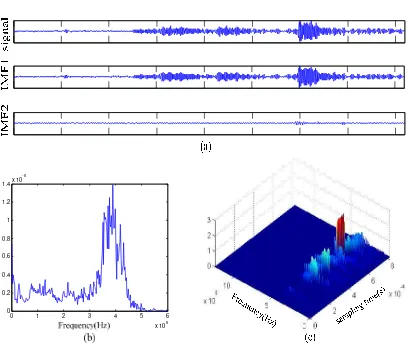
Figure 8. AE signal of matrix cracking and fibre breakage:(a) EMD;(b) Hilbert marginal spectrum; (c) the three-dimensional unite time-frequency chart of HHT
5. Conclusion
In order to get a deep understanding of composite failure mechanisms, the new advanced signal processing methodologies are established for the analysis of acoustic emission (AE) data obtained from the quasi-static tension test of carbon fiber twill weave composite. For this purpose, AE signals have been collected and post-processed for tension test, and are analysed with two signal processing methods: Empirical Mode Decomposition(EMD) and Hilbert-Huang Transform(HHT). AE signals can be decomposed into a set of Intrinsic Mode Functions(IMF) components, results from this study revealed that the EMD can detach and extract all damage modes information consist in an AE signal. The HHT of AE signals can clearly express the frequency distribution of IMF component in time-scale in different damage stages, and can calculate accurate instantaneous frequency for damage modes recognition. Once the acoustic emission signatures of the different damage mechanisms are recognized, real time damage detection and its severity estimation of composite structures may be possible.
Acknowledgement
The project was supported by the National Natural Science Foundation of China(51275221); and was supported by the Natural Science Foundation of jiangsu province, china(BK2011261)
References
[1] Hugueta S, Godina N, Gaertnera R, et al. Use of acoustic emission to identify damage modes in glass fibre reinforced polyester. Compos Sci Technol. 2002; 62(10):1433–1444
[7] R. Gutkin, C.J. Green , S. Vangrattanachai , et al. On acoustic emission for failure investigation in CFRP:Pattern recognition and peak frequency analyses. Mechanical Systems and Signal Processing. 2011;25 (4): 1393–1407
[8] V.Arumugam, S.Sajith, A.JosephStanley. Acoustic Emission Characterization of Failure Modes in GFRP Laminates Under Mode I Delamination. J Nondestruct Eval. 2011; 30 (3):213–219
[9] Mardiyono Mardiyono, Reni Suryanita, Azlan Adnan. Intelligent Monitoring System on Prediction of Building Damage Index using Artificial Neural Network. TELKOMNIKA Telecommunication Computing Electronics and Control. 2012; 10(1): 147-154.
[10] M. Moevus, N. Godin, M. RMili, et al. Analysis of Damage Mechanisms and Associated Acoustic Emission in Two SiCf/[Si-B-C] Composites Exhibiting Different Tensile Behaviours. Part II. Unsupervised Acoustic Emission Data Clustering. Compos. Sci. Technol. 2008; 68(6): 1258–1265 [11] R. de Oliveira, A.T. Marques. Health Monitoring of FRP Using Acoustic Emission and Artificial Neural
Networks. Comput. Struct. 2008; 86(3-5): 367–373
[12] N. Godin, S. Huguet, and R. Gaeertner. Integration of the Kohonens Self-Organizing Map and k-Means Algorithm for the Segmentation of the AE Data Collected During Tensile Tests on Cross-Ply Composites. NDT&E Int. 2005; 38(4): 299–309
[13] Norden. E. Huang, M. C. Wu, S. R. Long, et al. A confidence limit for the empirical mode decomposition and Hilbert spectrum analysis. Proc R Soc Lond A. 2003; 459(4): 2317-2345